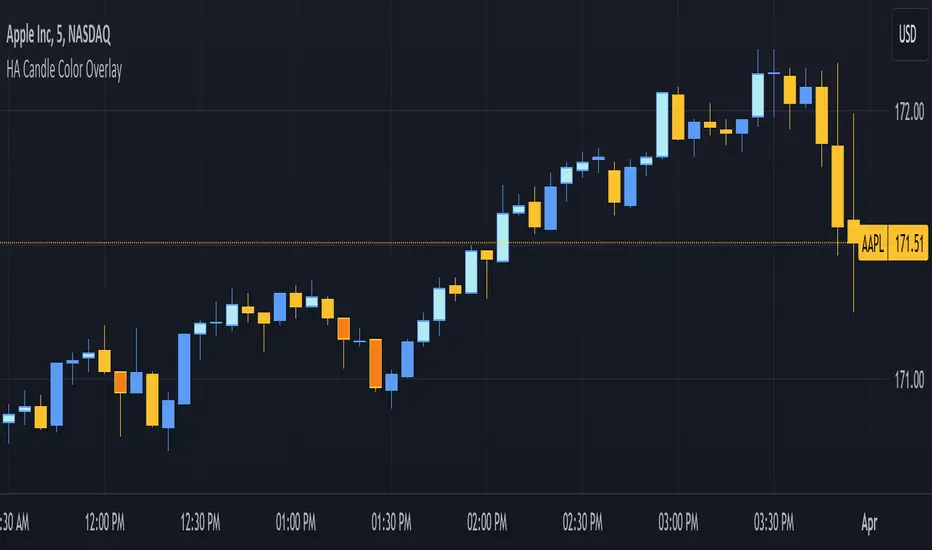
Candle Emotion Index (CEI) StrategyThe Candle Emotion Index (CEI) Strategy is an innovative sentiment-based trading approach designed to help traders identify and capitalize on market psychology. By analyzing candlestick patterns and combining them into a unified metric, the CEI Strategy provides clear entry and exit signals while dynamically managing risk. This strategy is ideal for traders looking to leverage market sentiment to identify high-probability trading opportunities.
How It Works
The CEI Strategy is built around three core oscillators that reflect key emotional states in the market:
Indecision Oscillator . Measures market uncertainty using patterns like Doji and Spinning Tops. High values indicate hesitation, signaling potential turning points.
Fear Oscillator . Tracks bearish sentiment through patterns like Shooting Star, Hanging Man, and Bearish Engulfing. Helps identify moments of intense selling pressure.
Greed Oscillator . Detects bullish sentiment using patterns like Marubozu, Hammer, Bullish Engulfing, and Three White Soldiers. Highlights periods of strong buying interest.
These oscillators are averaged into the Candle Emotion Index (CEI):
CEI = (Indecision + Fear + Greed) / 3
This single value quantifies overall market sentiment and drives the strategy’s trading decisions.
Key Features
Sentiment-Based Trading Signals . Long Entry: Triggered when the CEI crosses above a lower threshold (e.g., 0.1), indicating increasing bullish sentiment. Short Entry: Triggered when the CEI crosses above a higher threshold (e.g., 0.2), signaling rising bearish sentiment.
Volume Confirmation . Trades are validated only if volume exceeds a user-defined multiplier of the average volume over the lookback period. This ensures entries are backed by significant market activity.
Break-Even Recovery Mechanism . If a trade moves into a loss, the strategy attempts to recover to break-even instead of immediately exiting at a loss. This feature provides flexibility, allowing the market to recover while maintaining disciplined risk management.
Dynamic Risk Management . Maximum Holding Period: Trades are closed after a user-defined number of candles to avoid overexposure to prolonged uncertainty. Profit-Taking Conditions: Positions are exited when favorable price moves are confirmed by increased volume, locking in gains. Loss Threshold: Trades are exited early if the price moves unfavorably beyond a set percentage of the entry price, limiting potential losses.
Cooldown Period . After a trade is closed, a cooldown period prevents immediate re-entry, reducing overtrading and improving signal quality.
Why Use This Strategy?
The CEI Strategy combines advanced sentiment analysis with robust trade management, making it a powerful tool for traders seeking to understand market psychology and identify high-probability setups. Its unique features, such as the break-even recovery mechanism and volume confirmation, add an extra layer of discipline and reliability to trading decisions.
Best Practices
Combine with Other Indicators . Use trend-following tools (e.g., moving averages, ADX) and momentum oscillators (e.g., RSI, MACD) to confirm signals.
Align with Key Levels . Incorporate support and resistance levels for refined entries and exits.
Multi-Market Compatibility . Apply this strategy to forex, crypto, stocks, or any asset class with strong volume and price action.
Tìm kiếm tập lệnh với "candle"
Last Candle Close Above/Below AlertHow it works:
The script calculates whether the close of each candle is above or below the close of the previous candle, same as the initial code.
isLastBar is checked and the last candle to be created is the only one that will receive the condition from this variable.
If a highlight is needed it will use this criteria and apply the correct color for the last candle only, and any other candle will not be colored.
If alerts are enabled they will only work for the last bar too.
How to Use:
Add this script to your TradingView chart.
Use the inputs to set the desired timeframe to analyze, whether you want an alert for candles closing above or closing below and the background colors.
The last candle will highlight yellow when the close is higher or lower than the previous candle.
Alerts will be triggered on the last candle if you enable the alert conditions.
Key Features:
Timeframe Selection: You can choose a different timeframe in the settings.
Candle Highlight: Candles that close above or below the previous candle are highlighted in yellow.
Alerts: Alerts are configurable to trigger for "Close Above" or "Close Below" conditions, based on your selection in the settings.
Candle ThermalsThis indicator color candles based on their percentage price change, relative to the average, maximum, and minimum changes over the last 100 candles.
-It calculates the percentage change of all candles
-Calculates the minimum, maximum and average in the last 100 bars in percentage change
-Changes color of the candle based on the range between the current percent and min/max value
-The brightest candle provides the highest compound effect to you account if you act on it at the open.
-Candles that have a percentage close to the average then they are barely visible = lowest compound effect to your account
This indicator functions like a "heatmap" for candles, highlighting the relative volatility of price movements in both directions. Strong bullish candles are brighter green, and strong bearish candles are brighter red. It's particularly useful for traders wanting quick visual feedback on price volatility and strength trends within the last 100 bars.
Engulfing Candle Indicator with SweepTHIS IS ENGULFED SWEEP CANDLE
This TradingView indicator identifies and highlights bullish and bearish engulfing candlestick patterns with an additional condition: the recent candle must "sweep" the high or low of the previous candle. This refined approach helps to confirm the strength of the engulfing pattern by ensuring that the current candle extends beyond the previous candle's range.
Features:
- **Bullish Engulfing Detection**: Identifies a bullish engulfing pattern where the current candle fully engulfs the previous candle's body, and the low of the current candle is below the low of the previous candle.
- **Bearish Engulfing Detection**: Identifies a bearish engulfing pattern where the current candle fully engulfs the previous candle's body, and the high of the current candle is above the high of the previous candle.
- **Visual Indicators**: Marks bullish engulfing patterns with a green label below the bar and bearish engulfing patterns with a red label above the bar.
- **Alert Conditions**: Provides customizable alerts for detected patterns, enabling you to be notified when a bullish or bearish engulfing pattern with a sweep is detected.
#### Usage:
1. **Apply to Chart**: Add the indicator to your chart to start detecting engulfing patterns with sweep conditions.
2. **Set Alerts**: Configure alerts to receive notifications when the indicator identifies a bullish or bearish engulfing pattern with a sweep.
#### Ideal For:
- Traders looking for additional confirmation in engulfing patterns.
- Users who want to incorporate price action signals into their trading strategy.
By incorporating the sweep condition, this indicator aims to enhance the reliability of the engulfing patterns and provide more actionable signals.
---
Feel free to adjust the description based on any specific details or features you want to highlight. If there are any additional features or details about the indicator that should be included, let me know!
Engulfing CandlesThis script serves as the "Engulfing Candles" indicator in TradingView. Here's what it does:
- It identifies bullish candlestick patterns where the current candle's high is lower than the previous candle's high, the current candle's low is higher than the previous candle's low, the current candle's close is higher than the previous candle's close, and the current candle's open is higher than the previous candle's open. It also identifies bearish candlestick patterns where the conditions are reversed.
- The indicator colors bullish candles in a specific color (Yellow Green) to visually highlight the bullish pattern, and colors bearish candles in another color (Purple pink) to visually highlight the bearish pattern.
- Additionally, it triggers an alert when either the bullish or bearish triangle shape appears, notifying traders with the message "A Southern Star Shadows pattern has appeared!"
HTF CandlesHTF Candles Indicator (High Time Frame Candles for Low Time Frame Charts)
Overview:
This indicator plots High Time Frame (HTF) candle boxes on Lower Time Frame (LTF) charts. The purpose is to provide traders with a visual representation of (HTF) candlestick movements on a lower timeframe (LTF) within a specified interval.
Usage:
Traders can utilize this indicator to gain insights into HTF candle movements on LTF charts. It helps in identifying the range, direction, and bodies of candles from a higher timeframe perspective.
HTF Candle Box Formation:
The script identifies the start of a new interval on the HTF by monitoring changes in the specified timeframe (Interval).
For each new interval, it records key data points, including the open, high, low, and bar index.
The indicator then uses this information to draw a box on the LTF chart, encapsulating the HTF candle's high and low.
Candle Body Representation:
Users can choose to include the candle body in the box (BodyCandleBox).
If selected, the script draws an additional box representing the HTF candle body, from the open to the previous bar's close.
Color Customization:
Traders can customize box colors for long and short candles on the HTF.
Boxes can be transparent or filled with a specified color.
Multiple Timeframes:
The script supports multiple timeframes simultaneously, allowing traders to overlay HTF candle boxes from different intervals on the same chart.
Configurable options (Interval, Interval1, Interval2) provide flexibility in selecting additional timeframes.
Note:
Understanding the visual representation of HTF candles on LTF charts can aid traders in making more informed decisions, especially when considering the interplay between different timeframes.
Crypto Candlestick Patterns - CN VersionIntroduction:
The candlestick chart has been used for centuries since the Japanese applications. Based on the candlestick charting, people developed candle pattern analysis. Now we have tons of books or articles illustrating the usage of reversal patterns and continuation patterns, and computers provide a faster and preciser way to recognize these pattern.
Originally we have a common *All Candlestick Patterns* indicator to use. This indicator works well for most of the markets or commodities including stocks and futures. However, for cryptocurrency market, quite a few patterns are not suitable anymore. For example, crypto markets are continuously running 7x24hrs and the big coins with good volume tend to have almost continuous price in commonly used time periods. Hence, original patterns with "window" or "jump" concepts are usually not applied to crypto.
For these issues, I modified the original *All Candlestick Patterns* indicator and introduced the Chinese version for people speaking such language.
Like most of the other indicators, I personally do not recommend anyone to simply follow the patterns it shows to enter the market. You may take these recognized patterns as a reference, and further actions on trading should be done with several other tools, such as MACD, RSI, Stochastic and etc.
Usage:
The application of this indicator is basically the same as the original *All Candlestick Patterns* and you will get an automatically generated pattern recognition by your computer system.
There are a few parameters to adjust for the indicator:
Trending Detection Settings: Here you can choose SMA-Fast, SMA-Fast/Slow or None detecting options to recognize the current market trend. This is a minor improvement from the original indicator and you can choose your preferred trending detecting settings by changing the length of SMA.
Candlestick Settings: You may adjust the rules to recognize the properties of candlesticks. I add a "perturbation" parameter here, which actually is an error tolerance for pattern recognition. Some seemingly pattern may not fulfill the strict rules of classic candlestick patterns, but we may recognize them by watch the charting on our own. Hence this error tolerance may show more potential patterns from the charting.
Plot Settings: It is the usually colour choice and providing options for bullish/bearish.
Pattern Settings: Here you can select the patterns that you would like to see from the charting. You can pick the preferred reversal patterns or choose to show all the patterns. It's all up to you!
Features:
Language Translation: Since this is a Chinese language version. I have replaced all the English explanation of patterns to Chinese ones. Move your mouse to the label, you will find a brief intro of the pattern and a notice about bullish or bearish signals it indicates.
Alerts: As the same as the original one, we will have the alert options from this indicator. All the alerts and their messages are Chinese. You can activate alerts based on this indicator from the alert management section, as the same as many other indicators you have used before.
Future Improvements:
For now I am satisfied with the work I have done, and I may apply it to several charts. It's welcome for any users to take a look at the codes and put modifications or improvements towards it. Currently most of the comments in the code are in Chinese language, since basically it's for Chinese speaking users, while the code itself and the parameter names should be pretty easy to understand in English. (I have been using English for writing in the past 8 years, hence this introduction is in English as well.)
Z Score CANDLE and Exciting candle signal [DJ D]This script paints candles when their zscore reaches above 2 standard deviations in price from the mean. The blue candle represents up candle above 2. Magenta candle below -2. The candles can signal the beginning of a move and also importantly exhaustion.
The script also signals when a candle has volatility above 6. The higher the sensitivity the less frequent it will paint. These are real time paints and signals. You can adjust for higher time frames by adjusting the length of the z score and adjust the sensitivity of the volatility candles.
The yellow candle is a mean candle and can signify consolidation and/or indecision. Drawing a Darvis type box around around mean candles can give you a zone to watch.
These settings are for 1 minute scalping. The volatility sensitivity range between 1- 2 is good for 15, 30, (ie 1.0 or 1.2) and your discretion....
[Holy] Candle BlocksThis experimental indicator overlays candles from higher timeframes directly onto your current chart. The concept of Candle Blocks aims to offer an intuitive way to view price action across multiple periods simultaneously.
FEATURES
Multiple Timeframe Support: Choose from various timeframes to overlay, such as hourly, daily, weekly, etc.
Customizable Opacity: Adjust the transparency of the overlay to ensure the primary chart remains visible.
Color Coding: The overlay uses distinct colors to indicate bullish and bearish candles from the higher timeframe.
Real-time Update: The overlay updates in real-time as new higher timeframe candles are formed.
USE CASES
Trend Confirmation: Validate the trend direction of your primary timeframe by examining higher timeframe Candle Blocks.
Support & Resistance: Identify key support and resistance levels more clearly by seeing them on multiple timeframes.
Fourth-Dimensional Decision Making: This indicator aims to move towards a 4th-dimensional trading perspective, where time is considered as a vector. This helps traders to always make decisions with multiple timeframes in mind.
EXPERIMENTAL
This indicator is in its experimental stage, and future updates will be made based on its effectiveness and the feedback received. If you find this concept useful or have suggestions for improvement, please provide feedback. This will aid in further development and refinement of the indicator.
Buy/Sell EMA CandleThis indicator is designed to display various technical indicators, candle patterns, and trend directions on a price chart. Let's break down the code and explain its different sections:
Exponential Moving Averages (EMA):
The code calculates and plots five EMAs of different lengths (13, 21, 55, 90, and 200) on the price chart. These EMAs are used to identify trends and potential crossovers.
Engulfing Candle Patterns:
The code identifies and highlights potential bullish and bearish engulfing candle patterns. It checks if the current candle's body size is larger than the combined body sizes of the previous and subsequent four candles. If this condition is met, it marks the pattern on the chart.
s3.tradingview.com
EMA Crossovers:
The code identifies and highlights points where the shorter EMA (ema1) crosses above or below the longer EMA (ema2). It plots circles to indicate these crossover points.
Candle Direction and RSI Trend:
The code determines the trend direction of the last candle based on whether it closed higher or lower than its open price. It also calculates the RSI (Relative Strength Index) and determines its trend direction (overbought, oversold, or neutral) based on predefined thresholds.
s3.tradingview.com
Table Display:
The code creates a table displaying trend directions for different timeframes (monthly, weekly, daily, 4-hour, and 1-hour) for candle direction and RSI trends. The trends are labeled with "L" for long, "S" for short, and "N/A" for not applicable.
High Volume Bars (HVB):
The code identifies and colors bars with above-average volume as either bullish or bearish based on whether the price closed higher or lower than it opened. The color and conditions for high volume bars can be customized.
s3.tradingview.com
Doji Candle Pattern:
The code identifies and marks doji candle patterns, where the open and close prices are very close to each other within a certain percentage of the candle's high-low range.
RSI-Based Candle Coloring:
The code adjusts the color of the candles based on the RSI value. If the RSI value is above the overbought threshold or below the oversold threshold, the candles are colored yellow.
Usage and Interpretation:
Traders can use this indicator to identify potential trend changes based on EMA crossovers and candle patterns like engulfing and doji.
The RSI trend direction can provide additional insight into potential overbought or oversold conditions.
High volume bars can indicate potential price reversals or continuation patterns.
The table provides an overview of trend directions on different timeframes for both candle direction and RSI trends.
Keep in mind that this is a complex indicator with multiple features. Users should carefully evaluate its performance and consider combining it with other indicators and analysis methods for more accurate trading decisions.
The table is designed to provide a consolidated view of trend directions and other indicators across multiple timeframes. It is displayed on the chart and organized into rows and columns. Each row corresponds to a specific aspect of analysis, and each column corresponds to a different timeframe.
Here's a breakdown of the components of the table:
Row 1: Separation.
Row 2 (Header Row): This row contains the headers for the columns. The headers represent the different timeframes being analyzed, such as Monthly (M), Weekly (W), Daily (D), 4-hour (4h), and 1-hour (1h).
Row 3 (Content Row): This row contains labels indicating the types of information being displayed in the columns. The labels include "T" for Trend, "C" for Current Candle, and "R" for RSI Trend.
Row 4 and Onwards: These rows display the actual data for each aspect of analysis across different timeframes.
For each aspect of analysis (Trend, Current Candle, RSI Trend), the corresponding rows display the following information:
Monthly (M): The trend direction for the given aspect on the monthly timeframe.
Weekly (W): The trend direction for the given aspect on the weekly timeframe.
Daily (D): The trend direction for the given aspect on the daily timeframe.
4-hour (4h): The trend direction for the given aspect on the 4-hour timeframe.
1-hour (1h): The trend direction for the given aspect on the 1-hour timeframe.
The trend directions are represented by labels such as "L" for Long, "S" for Short, or "N/A" for Not Applicable.
The table's purpose is to provide a quick overview of trend directions and related information across multiple timeframes, aiding traders in making informed decisions based on the analysis of trend changes and other indicators.
Inside Candle by HarshiniThe concept behind this indicator is that the inside candle indicates a pause in the current move and the following candle after inside candle will indicate the direction of the next move. This indicator informs you when an inside candle is formed and based on the next candle, it gives you buy/sell signal.
When an inside candle is formed, a label will appear above the candle, which makes it very easy to identify the inside candle in live charts. Once the inside candle is formed, the Buy/Sell signal depends on the next candle. If the candle formed after the inside candle gives a breakout above then "Buy" signal is indicated, you can take a trade with 1:2 risk reward. Similarly if the next candle gives a breakout below, then a "Sell" signal is generated and you can take a sell with 1:2 risk reward. This indicator can be applied to any chart like stocks, crypto, commodities etc...
Here's how you can trade using this indicator:
1) Apply this indicator in a 15 mins time frame :
Even though this indicator identifies inside candle formation in almost every time frame, it works very well when applied to a 15 mins chart.
2) Always keep minimum 1:2 Risk Reward :
While taking trades initially, stick on to 1:2 risk reward. If there are other confluences as well along with the inside candle, you can book target accordingly.
Note : It is observed that this indicator works well in a trending market and not in ranging bound market.
Yearly CandlesPlots yearly candles from monthly candles data. This indicator could also be used to view yearly candles of those symbols for which candlesticks are not available in TradingView (for e.g., ECONOMICS:USINTR , ECONOMICS:USIRYY , ECONOMICS:USWG etc)
As these are not out of the box candles they do have these shortcomings -
Last candle's data is not available in status line, a separate label lists OHLC and change details near its close level
The very first candle's width may vary based on how much data is available for that year
Works only with monthly timeframe
Only those indicators that can be added on other indicators can be applied, however, they may still not work as intended as this still technically is a monthly chart!
Impactful pattern and candles pattern AlertThe Alertion indicator!
impactful pattern:
pattern that happen near the zone or in the zone at lower timeframe and give us entry and stop limit price.
It is helpful for price action traders and those who want to decrease their risk.
There are 3 IP patterns:
Quasimodo
Head and shoulder
whipsaw engulfing
These patterns may occur near the zone or may not occur but by them, you can decrease your trading risk for example you can
trade with half lot before IP pattern and enter with other half after pattern.
how to use?
for example:
you find zone at 1h timeframe for short position
when price enter to your zone
you run this indicator and choose your lower timeframe, for example 15m and click on short position.
Then make the alert by right-click on your chart and choose the add alert and at condition box choose the impactful pattern and then click on create
now wait for message :)
Candles pattern:
like reversal bar, key reversal bar, exhaustion bar, pin bar, two-bar reversal, tree-bar reversal, inside bar, outside bar
these occur when the trend turn, so it is usable when the price enter to your zone or near your zone.
This pattern can decrease your risk.
Inside bar and outside bar:
if this pattern engulf up, it is bullish pattern and if engulf down, it is bearish pattern.
what does this indicator do?
this indicator is for making alert
it helps you to decrease your risk and failure.
You optimize it to alert you when IP pattern happen or candle pattern happen or inside bar or outside bar engulfing or all of them.
For IP pattern, it will message you entry and stop limit price.
It works at 2 different timeframes, so you can make alert for example in 1h TF for candles pattern and 15m TF for IP pattern.
Indicator will alert you for candles pattern at your chart timeframe and for IP pattern at timeframe you've chosen when you run the indicator, and it is changeable
in setting.
setting options
TIMEFRAME
IP: select the timeframe for IP patterns it means when IP pattern happen at that timeframe the indicator will alert you
example = your TF is 1h, you found the supply zone and want to trade, note that IP pattern happen in lower TF, so you select 15m TF or TF lower than 1h.
Short position: select it if you want to make short position.
BUFFERING
indicator send you entry and stop limit price
you can change it by amount of percent
it is your strategy to change your entry and stop loss or not
example= in head and shoulder pattern at short position, the stop limit is high price of head in pattern
so the indicator will message you the exact price but if you want to put
your stop limit 5 percent upper than exact price you can enter 5 in front of stop loss
or you want to enter 5 percent lower than exact high price of shoulder, you can optimize it.
ALERTION
you choose what alert you want
IP alert or candle alert or inside and outside bar alert
type your text for alert
you can write additional text for your message
ADVANCE
IP alert frequency option:
1. Once per bar : indicator will alert you for IP pattern once at your chat timeframe bar, and you should wait til next bar for next alert.
2. Once per bar close : alert you when your chart timeframe bar closed and next alert will happen when next bar is closed.
3. All: alert you all the times IP pattern happen
pivot left and right bars: lower will find smaller pattern
at the END:
this indicator is not strategy
it is part of your strategy that help you to increase your winning rate.
It is helpful for scalping and candle patterns finding.
After you make an alert, you can delete the indicator or change your timeframe or make another alert, your previous alert won’t change.
Thank you all.
Determine Consecutive Candles█ OVERVIEW
This is a simple script that will plot labels over or under candles to show where there had been consecutive candles that closed in a similar fashion. This script was inspired by a Tweet about Bitcoin experiencing its first 7th-consecutive weekly black candle and I sought out to test that.
█ INPUTS
There are three inputs for this script.
"offset" ( integer ) - (Can be 0 or 1) Allows the user to apply this script at the currently closing candle or the most recently closed candle.
"Number of Candles" ( integer ) - (From 3 to 100*) Allows the user to select how many candles to back test for consecutive-ness.
"Black or White" ( boolean ) - Allows the user to select what kinds of candles to look for in this script. (true - Black , false - White ).
*Publishing open-sourced, this selection was arbitrary and can be modified at will.
█ USAGE
Because I had created this in a little over an hour, this is just a simple experiment that I wanted to share with others. Its applications are unknown to me, but I am interested in hearing how others may find what this script does useful.
Candle checker for long/short for scalping/day tradingHey.
This strategy is still in working.
For it I check a x amount of candles in the past if they been for example all red/green in row, and based on that I enter. For example candle 7 < candle 6 .... candle 3 < candle 2 .... candle 1 < candle current for long and viceversa for short.
After that,once the trade is initiated, I exit based on 2 possibilities : candle color is different than the color of candle when entry, or based tp/sl.
Let me know what you think of it.
I will try to make the process to calculate automatically and input the number of candles to check like 5-10-15 and so on.
Real Candles Heikin Ashi (HA) Candle functionsThis script plots both real and HA candles regardless or which are used on the chart in TV settings.
(and has the functions for you to use.)
Lots of people seem to misunderstand backtesting (or scam people) based on HA candles.
Backtesting with HA candles leads to impossible trades. ALWAYS backtest with real candles.
That doesn't mean you might not want to look at HA candle values to make trading decisions.
Add the code below to calculate HA candles from real and use that in your HA trading algo,
but test it on real charts.
Candles - Cheat SheetWhat is up y'all ? (french trying to sound American)
I found that in my script archives, way back in an old cave. I think this might be useful as a few really asked me how to define a green/red candle, how to capture the wick value, the body, etc..
This is not a fancy script as usual and I'm sure they're plenty of candles pattern scripts out there but I saw no one sharing a simple candle cheat sheet for pinescript coding
Being able to define candles using codes is an essential skill to have for any Pinescripter
Still on the train so won't write a roman as usual... Kidding... I actually did it here What-is-an-Hard-Exit-and-a-few-notes-on-trading-management/
It won't bring me as many likes as any magic p**p cannon accounts promising the moon at each trade but if I can help at least 1 trader a day not losing his/her money, I'll be happy and my daily goal will be fulfilled
All the best
Dave
____________________________________________________________
Be sure to hit the thumbs up
- I'm an officially approved PineEditor/LUA/MT4 approved mentor on codementor. You can request a coaching with me if you want and I'll teach you how to build kick-ass indicators and strategies
Jump on a 1 to 1 coaching with me
- You can also hire for a custom dev of your indicator/strategy/bot/chrome extension/python
MA CandlesOHLC calculated with a moving average.
You can replace sma with anything. EMA, Hull, sma(sma(sma(sma(close, etc.
You could also make it look clean like Heikin Ashi candlesticks if you include min/max for low/high wicks on candles.
Squeeze Momentum Early In and Out CandlesJohn Carter presented some candles called "Early In and Out Candles". Although I couldn't imitate the exact candles and warnings I create better indications and bars in my opinion.
When the Candles are above Donchian MA then we have a bullish Momentum.
When the Candles are bellow Donchian MA then we have bearish momentum.
This indicator works best to get an WARNING to enter and close EARLY positions.
Bullish:
When the candles are Light Blue then we have early warning to enter.
When the candles are Dark Blue then we have early warning to close the position.
Bearish:
When the candles are Red then we have early warning to enter.
When the candles are Yellow then we have early warning to close the position.
IMPORTANT NOTES:
Always combine it with the Squeeze Pro indicator.
Suggested Donchian MA: 5 (You can adjust it).
Don't let candles only to be your closing indication once again there are EARLY WARNINGS therefore can move your stop loses to maximize your profits when you are exiting.
I tested my self and I found that is the best strategy when we get Dark Blue candle in the Bullish move I move my stop loss little bit bellow the candle.
Therefore here we go we have early warnings for In and Out.
Thank you and Good Luck.
3 Candle FVG with 5m S/R3 candle breakout indicator.
Shows EMA 50.
Shows Support and Resistance from the 5m chart on every timeframe.
Indicates every engulfing candle.
Indicates entry at 3 consecutive candles in the same direction where the middle candle has an FVG and it crosses the EMA.
Indicates entry at 3 consecutive candles in the same direction where the middle candle has an FVG and it does not cross the EMA.
Stop Hunt Candlesticks (Liquidity Wicks)🕯️ Stop Hunt Candlesticks
Wick Highlighter – Spot Extreme Wicks Instantly
This indicator highlights candles where the upper or lower wick exceeds a customizable percentage of the asset’s price — perfect for quickly spotting strong rejections, liquidity grabs, stop hunts or exhaustion moves.
💡 Key Features
Visual Background Highlight: Automatically colors the chart background when a wick surpasses your defined % threshold (default 1%).
Customizable Threshold: Adjust wick sensitivity to suit different assets or timeframes.
Upper & Lower Wick Filters: Choose whether to track upper wicks, lower wicks, or both.
Dynamic Price Basis: Compare wick size relative to Close, Open, HL2, or OC2.
Optional Labels: Display the exact wick percentage directly on the chart.
Alerts Ready: Get notified whenever a candle shows an extreme wick condition.
⚙️ How It Works
The script measures each candle’s wick size relative to your chosen price basis:
Upper wick % = (High − max(Open, Close)) / Basis × 100
Lower wick % = (min(Open, Close) − Low) / Basis × 100
If the result exceeds your chosen threshold, the chart background changes color.
Red for upper wicks, green for lower wicks by default.
🎯 Use Cases
Identify strong rejections or stop hunts near key levels.
Confirm price exhaustion or potential reversals.
Filter fake breakouts or high-volatility events.
🧩 Customization
Tweak colors, transparency, and label visibility to fit seamlessly into your chart setup.
Burner Volume CandlesVisually see different candle colors based on volume relative to the look back period (default is last 20 candles).
This allows you to see if a current candle print is standard, high, or extreme sell/buy volume relative to the look back period.
This has been primarily used on the 30s timeframe on NQ.
It is also advised to take the NY open candle volume with a grain of salt as that is typically the extreme volume so it doesn't make this indicator as useful when it comes to those candles.
Disguised Candles by The School of Dalal StreetDisguised Candles corrects one of the subtle visual distortions present in normal candlestick charts — the mismatch between the close of one candle and the open of the next.
On many instruments (especially at day/session breaks), the next candle’s open often jumps due to price gaps or data feed behavior. This can make reading the flow of price action harder than necessary.
Disguised Candles fixes this by plotting synthetic candles where the open of each candle is forced to match the close of the previous one — creating a visually continuous flow of price.
Real candles are made fully transparent, so only the "corrected" candles are visible.
This allows traders to:
Visualize price flow as a smooth path
Better spot true directional shifts and trends
Avoid distractions caused by technical gaps that are not meaningful to their strategy
🚀 Pure visual clarity. No noise from false opens.
How it works:
The open of each synthetic candle = close of previous real candle
High, Low, Close remain unchanged
Colors are based on Close vs Corrected Open
Real chart candles are hidden under a transparent overlay
Use this as a clean canvas for trend analysis or as a foundation for building new visual systems.


