HMA Crossover + ATR + Curvature (Long & Short)📏 Hull Moving Averages (Trend Filters)
- fastHMA = ta.hma(close, fastLength)
- slowHMA = ta.hma(close, slowLength)
These two HMAs act as dynamic trend indicators:
- A bullish crossover of fast over slow HMA signals a potential long setup.
- A bearish crossunder triggers short interest.
⚡️ Curvature (Acceleration Filter)
- curv = ta.change(ta.change(fastHMA))
This calculates the second-order change (akin to the second derivative) of the fast HMA — effectively the acceleration of the trend. It serves as a filter:
- For long entries: curv > curvThresh (positive acceleration)
- For short entries: curv < -curvThresh (negative acceleration)
It helps eliminate weak or stagnating moves by requiring momentum behind the crossover.
📈 Volatility-Based Risk Management (ATR)
- atr = ta.atr(atrLength)
- stopLoss = atr * atrMult
- trailStop = atr * trailMult
These define your:
- Initial stop loss: scaled to recent volatility using ATR and atrMult.
- Trailing stop: also ATR-scaled, to lock in gains dynamically as price moves favorably.
💰 Position Sizing via Risk Percent
- capital = strategy.equity
- riskCapital = capital * (riskPercent / 100)
- qty = riskCapital / stopLoss
This dynamically calculates the position size (qty) such that if the stop loss is hit, the loss does not exceed the predefined percentage of account equity. It’s a volatility-adjusted position sizing method, keeping your risk consistent regardless of market conditions.
📌 Execution Logic
- Long Entry: on bullish HMA crossover with rising curvature.
- Short Entry: on bearish crossover with falling curvature.
- Exits: use ATR-based trailing stops.
- Position is closed when trend conditions reverse (e.g., bearish crossover exits the long).
This framework gives you:
- Trend-following logic (via HMAs)
- Momentum confirmation (via curvature)
- Volatility-aware execution and exits (via ATR)
- Risk-controlled dynamic sizing
Want to get surgical and test what happens if we use curvature on the difference between HMAs instead? That might give some cool insights into trend strength transitions.
Tìm kiếm tập lệnh với "crossover债券是什么"

MTF Trend + Crossover AlertsMulti-Timeframe Trend Dashboard + Crossover Signals
This indicator provides a clean, real-time visual dashboard of trend directions across multiple timeframes (1m, 5m, 15m, 30m, 1H, 4H, 1D), based on moving average crossovers.
🔹 Trend Detection Logic:
When the fast MA is above the slow MA → Bullish trend 🚀
When the fast MA is below the slow MA → Bearish trend 🐻
When both are equal or ranging → Neutral
📊 Dashboard Features:
Displays trend status for each selected timeframe
Color-coded cells (green = bullish, red = bearish, gray = neutral)
Includes emojis for visual clarity
🔔 Buy/Sell Alerts:
On the active chart timeframe, buy and sell signals are plotted when the fast MA crosses above or below the slow MA. You can also enable TradingView alerts based on these events.
🧩 Customizable Inputs:
Fast MA period
Slow MA period
MA type (EMA or SMA)
🔧 Ideal for traders who want a quick snapshot of market structure across multiple timeframes and receive real-time crossover signals on their current chart.

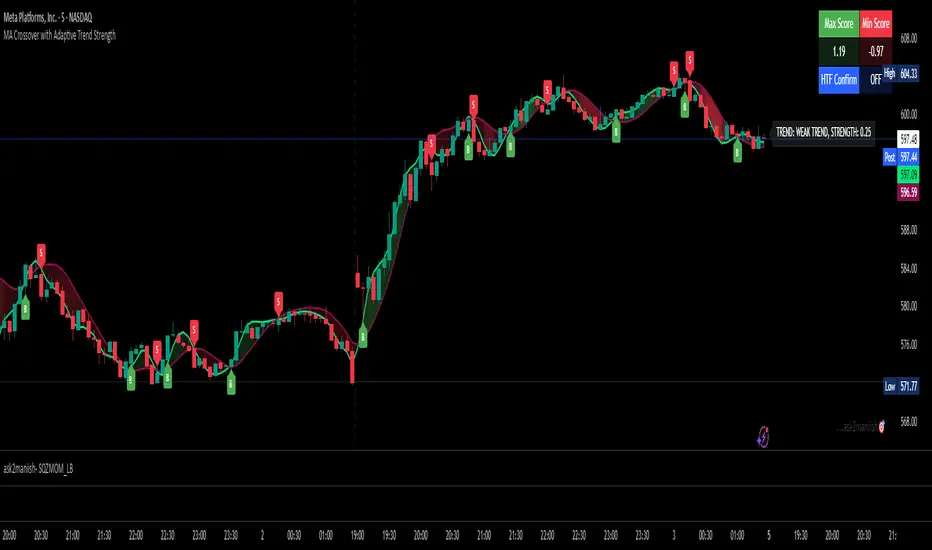
MA Crossover with Adaptive Trend Strength📘 MA Crossover with Adaptive Trend Strength —
📌 Overview
This TradingView indicator plots two moving averages (Fast & Slow) with user-selected types (T3, EMA, SMA, HMA), visual crossovers, and dynamically calculates an adaptive trend strength score using Z-scores of multiple features. Optional higher timeframe (HTF) confirmation is supported. A color-filled region between the MAs visually indicates momentum direction.
⚙️ Inputs & Controls
📈 Moving Average Settings
Fast MA Length: Length of the fast-moving average (default: 9).
Slow MA Length: Length of the slow-moving average (default: 21).
MA Type: Type of moving average used (T3, EMA, SMA, HMA).
Source: Input data source (default: close).
T3 Volume Factor: Only used when T3 is selected, controls smoothing (range: 0–1).
🎨 Visual Controls
Bullish Fill Color: Fill color when Fast MA is above Slow MA.
Bearish Fill Color: Fill color when Fast MA is below Slow MA.
Show Gradient Fill: Enable or disable the colored area between Fast & Slow MAs.
Trend Label Position: Choose where the trend strength label appears (top or bottom).
Label Update Interval: Number of bars between label updates (reduces clutter).
⏱ Multi-Timeframe Support
Higher Timeframe: Timeframe used for confirmation (default: 60 min).
Use HTF Confirmation: Enables filtering of trend score by higher timeframe trend direction.
📊 Lookback Configuration
Auto Lookback Based on Timeframe: Dynamically adapts scoring lookback period per chart timeframe.
Manual Lookback: Manual fallback lookback length when auto is off.
🧮 MA Calculation Options
T3 MA: Custom T3 function with exponential moving averages and volume factor.
EMA/SMA: Built-in Pine functions (ta.ema, ta.sma).
HMA: Hull Moving Average using WMA calculations.
📉 Trend Strength Calculation
🧠 Z-Score Inputs
Distance between MAs (zDist)
Slope of the Fast MA (zSlope)
Volume (zVol)
ATR (zATR)
📏 Choppiness & Adaptive Weighting
A Choppiness Index (based on ATR & price range) reduces score impact in sideways markets.
Dynamically adjusts Z-score weights:
W1: Distance
W2: Slope
W3: Volume
W4: ATR
🔁 HTF Confirmation
Optionally multiplies the trend score by the direction of the higher timeframe trend to filter noise.
🟩 Plot & Visual Elements
📊 MA Lines
Plots Fast and Slow MA lines in colors based on selected MA type.
🌈 Gradient Fill
Fills the area between Fast and Slow MAs with opacity proportional to their difference.
Colors based on bullish/bearish condition.
🏷️ Trend Strength Label
Updates every n bars (Label Update Interval).
Shows:
Trend Classification: Weak, Moderate, Strong
Numerical Score
Label position (top or bottom) is configurable.
🔔 Crossover Signals
Bullish Crossover ("B"): Fast MA crosses above Slow MA.
Bearish Crossover ("S"): Fast MA crosses below Slow MA.
Labels are plotted at crossover points.
Old labels are removed after a threshold (100) to reduce chart clutter.
📋 Score Summary Table
A table showing:
Max Score within the lookback period
Min Score
HTF Confirmation Status (ON / OFF)
Updates on the same user-defined interval as the trend label.
🚨 Alerts
Condition Description
Bullish MA Cross Fast MA crosses above Slow MA
Bearish MA Cross Fast MA crosses below Slow MA
These are provided via alertcondition() for use in alert creation.
📌 Customization Tips
Turn off the gradient fill for a cleaner chart.
Use HTF confirmation to reduce false positives in ranging markets.
Adjust label update frequency to prevent visual clutter on faster timeframes.
Use T3 MA with volume factor for smoother signals in volatile markets.
Phase Cross Strategy with Zone### Introduction to the Strategy
Welcome to the **Phase Cross Strategy with Zone and EMA Analysis**. This strategy is designed to help traders identify potential buy and sell opportunities based on the crossover of smoothed oscillators (referred to as "phases") and exponential moving averages (EMAs). By combining these two methods, the strategy offers a versatile tool for both trend-following and short-term trading setups.
### Key Features
1. **Phase Cross Signals**:
- The strategy uses two smoothed oscillators:
- **Leading Phase**: A simple moving average (SMA) with an upward offset.
- **Lagging Phase**: An exponential moving average (EMA) with a downward offset.
- Buy and sell signals are generated when these phases cross over or under each other, visually represented on the chart with green (buy) and red (sell) labels.
2. **Phase Zone Visualization**:
- The area between the two phases is filled with a green or red zone, indicating bullish or bearish conditions:
- Green zone: Leading phase is above the lagging phase (potential uptrend).
- Red zone: Leading phase is below the lagging phase (potential downtrend).
3. **EMA Analysis**:
- Includes five commonly used EMAs (13, 26, 50, 100, and 200) for additional trend analysis.
- Crossovers of the EMA 13 and EMA 26 act as secondary buy/sell signals to confirm or enhance the phase-based signals.
4. **Customizable Parameters**:
- You can adjust the smoothing length, source (price data), and offset to fine-tune the strategy for your preferred trading style.
### What to Pay Attention To
1. **Phases and Zones**:
- Use the green/red phase zone as an overall trend guide.
- Avoid taking trades when the phases are too close or choppy, as it may indicate a ranging market.
2. **EMA Trends**:
- Align your trades with the longer-term trend shown by the EMAs. For example:
- In an uptrend (price above EMA 50 or EMA 200), prioritize buy signals.
- In a downtrend (price below EMA 50 or EMA 200), prioritize sell signals.
3. **Signal Confirmation**:
- Consider combining phase cross signals with EMA crossovers for higher-confidence trades.
- Look for confluence between the phase signals and EMA trends.
4. **Risk Management**:
- Always set stop-loss and take-profit levels to manage risk.
- Use the phase and EMA zones to estimate potential support/resistance areas for exits.
5. **Whipsaws and False Signals**:
- Be cautious in low-volatility or sideways markets, as the strategy may generate false signals.
- Use additional indicators or filters to avoid entering trades during unclear market conditions.
### How to Use
1. Add the strategy to your chart in TradingView.
2. Adjust the input settings (e.g., smoothing length, offsets) to suit your trading preferences.
3. Enable the strategy tester to evaluate its performance on historical data.
4. Combine the signals with your own analysis and risk management plan for best results.
This strategy is a versatile tool, but like any trading method, it requires proper understanding and discretion. Always backtest thoroughly and trade with discipline. Let me know if you need further assistance or adjustments to the strategy!

RVI Crossover Strategy[Kopottaja]Overview of the RVI Crossover Strategy
Strategy Name: RVI Crossover Strategy
Purpose: The RVI Crossover Strategy is based on the crossover signals between the Relative Vigor Index (RVI) and its moving average signal line. This strategy aims to identify potential buy and sell signals by evaluating the market’s directional trend.
Key Indicator Features
Relative Vigor Index (RVI): This indicator measures the momentum of price changes over a specified period and helps identify the market’s current trend. The RVI is based on the idea that prices generally close higher than they open in an uptrend (and lower in a downtrend). The RVI helps provide an indication of the strength and direction of a trend.
Signal Line: A moving average (e.g., SMA) is applied to the RVI values, creating a "signal line." When the RVI crosses above or below this line, it signals a potential trading opportunity.
Calculations and Settings
Calculating the RVI: The RVI is calculated by comparing the difference between the close and open prices to the difference between high and low prices. This provides information about the direction and momentum of price movement:
RVI= Sum(SWMA(high−low))Sum(SWMA(close−open))
where SWMA is a smoothed weighted moving average over a specified period.
Signal Line Calculation: The RVI value is smoothed by applying a simple moving average (SMA) to create the signal line. This signal line helps filter crossover signals for improved accuracy.
Buy and Sell Conditions: Buy and sell conditions are identified based on crossovers between the RVI and its signal line.
Buy Signal: A buy condition is triggered when the RVI crosses above the signal line, provided that the "Bearish" condition (trend confirmation) is met.
Sell Signal: A sell condition occurs when the RVI crosses below the signal line, alongside the "Bullish" trend confirmation.
Volume-Weighted Moving Averages (VWMA): VWMA indicators are used to assess price-volume relationships over different timeframes:
Fast VWMA: A short-period volume-weighted moving average.
Slow VWMA: A longer-period volume-weighted moving average. These values are used to strengthen the buy and sell conditions by confirming trend directions (Bullish or Bearish).
Disclaimer: This is an educational and informational tool. Past performance is not indicative of future results. Always backtest before using in live markets
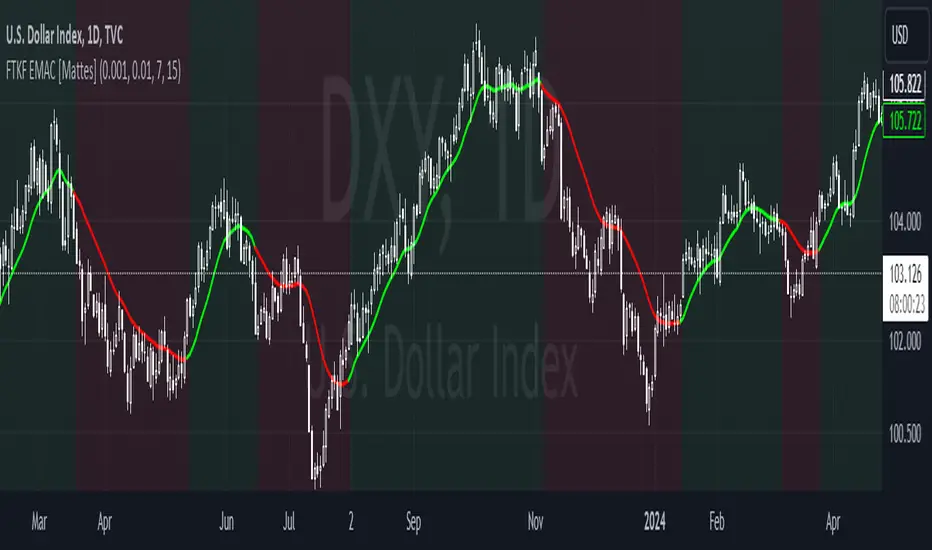
Fourier Transformed & Kalman Filtered EMA Crossover [Mattes]The Fourier Transformed & Kalman Filtered EMA Crossover (FTKF EMAC) is a trend-following indicator that leverages Fourier Transform approximation, Kalman Filtration, and two Exponential Moving Averages (EMAs) of different lengths to provide accurate and smooth market trend signals. By combining these three components, it captures the underlying market cycles, reduces noise, and produces actionable insights, making it suitable for detecting both emerging trends and confirming existing ones.
TECHNICALITIES:
>>> The Fourier Transform approximation is designed to identify dominant cyclical patterns in price action by focusing on key frequencies, while filtering out noise and less significant movements. It emphasizes the most meaningful price cycles, enabling the indicator to isolate important trends while ignoring minor fluctuations. This cyclical awareness adds an extra layer of depth to trend detection, allowing the EMAs to work with a cleaner and more reliable data set.
>>> The Kalman Filter adds dynamic noise reduction, adjusting its predictions of future price trends based on past and current data. As new price data comes in, the filter recalibrates itself to ensure that the price action remains smooth and devoid of erratic movements. This real-time adjustment is key to minimizing lag while avoiding false signals, which ensures that the EMAs react to more accurate and stable market data. The Kalman Filter’s ability to smooth price data without losing sensitivity to trend changes complements the Fourier approximation, ensuring a high level of precision in volatile and stable market environments.
>>> The EMA Crossover involves using two EMAs: a shorter EMA that reacts quickly to price movements and a longer EMA that responds more slowly. The shorter EMA is responsible for capturing immediate market shifts, detecting potential bullish or bearish trends. The longer EMA smooths out price fluctuations and provides trend confirmation, working with the shorter EMA to ensure the signals are reliable. When the shorter EMA crosses above the longer EMA, it indicates a bullish trend, likewise when it goes below the longer EMA, it signals a bearish trend. This setup provides a clear way to track market direction, with color-coded signals (green for bullish, red for bearish) for visual clarity. The flexibility of adjusting the EMA periods allows traders to fine-tune the indicator to their preferred timeframe and strategy, making it adaptable to different market conditions.
|-> A key technical aspect is that the first EMA should always be shorter than the second one. If the first EMA is longer than the second, the tool’s effectiveness is compromised because the faster EMA is designed to signal long conditions, while the longer one is made for signaling a bearish trend. Reversing their roles would lead to delayed or confused signals, reducing the indicator’s ability to detect trend shifts early and making it less efficient in volatile markets. This is the only key weakness of the indicator, failure to submit to this rule will result in confusion.
>>> These components work together like a clock to create a comprehensive and effective trend-following system. The Fourier approximation highlights key cyclical movements, the Kalman Filter refines these movements by removing noise, and the EMAs interpret the filtered data to generate actionable trend signals. Each component enhances the next, ensuring that the final output is both responsive and reliable, with minimal false signals or lag. creating an indicator using widespread concepts which haven't been combined before.
Summary
This indicator combines Fourier Transform approximation, Kalman Filtration, and two EMAs of different lengths to deliver accurate and timely trend-following signals. The Fourier approximation identifies dominant market cycles, while the Kalman Filter dynamically removes noise and refines the price data in real time. The two EMAs then use this filtered data to generate buy and sell signals based on their crossovers. The shorter EMA reacts quickly to price changes, while the longer EMA provides smoother trend confirmation. The components work in synergy to capture trends with minimal false signals or lag, ensuring traders can act promptly on market shifts. Customizable EMA periods make the tool adaptable to different market conditions, enhancing its versatility for various trading strategies.
To use the indicator, traders should adjust the EMA lengths based on their timeframe and strategy, ensuring that the shorter EMA remains shorter than the longer EMA to preserve the tool’s responsiveness. The color-coded signals offer visual clarity, making it easy to identify potential entry and exit points. This confluence of Fourier, Kalman, and EMA methodologies provides a smooth, highly effective trend-following tool that excels in both trending and ranging markets.
Classic Long Term Trend Following SystemThis is a classic long term trend following system.
The breakout period is 50 days instead of 20 and the moving average crossover are 40 and 120.
The moving averages are also exponential instead of simple.
The stoploss is 4 ATRs away from the price.
Recommendations:
Donchian Channels settings > 50 days
Moving Averages > 40 and 120, 80 and 140
Important to note:
My first strategy, DC Breakout System | This is simplicity at its finest, is best used on the crypto market and this one for stocks, commodities, currencies, etc. Those markets tend to trend a lot longer than crypto do.

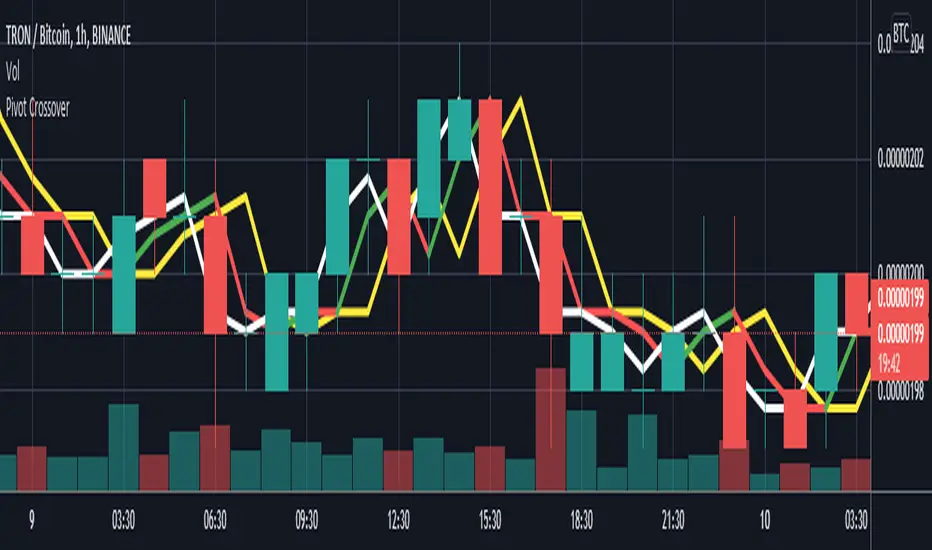
Pivot CrossoverThis indicator work on pivot point crossover. In this indicator use three pivot point
White color line is Pivot point for current bar.
Green/Red color line is Pivot point for last bar.
Yellow color line is Pivot point for 2nd last bar.
For long
if last pivot crossover above 2nd last pivot then go long
if current pivot crossover below last pivot then exit long
For short
if last pivot crossover below 2nd last pivot then go short
if last pivot crossover above last pivot then exit short
Colored MA with crossovers The indicator is used to identify trends in different MA and mark crossovers/crossunders with triangles on chart. Each MA line has different linewidth to easier identify it's value. Lines are transparent not draw to much attention, crossovers marked to draw attention to pivotal moments.
Choose SMA or EMA type.
Enable/disable crossover/crossunder.
Each MA line is adjustable in the input tab.
Each MA line has different linewidth to easier identify it's value (higher value bigger linewidth).
Each MA line changes color depending on it's gradient, green if positive, red if negative, gray if flat.
Edit which crossovers/crossunders to be visible in the style tab . In the same tab colors is adjustable.

Scripting Tutorial 9 - TManyMA Strategy - Long Market Order OnlyThis script is for a triple moving average strategy where the user can select from different types of moving averages, price sources, lookback periods and resolutions.
Features:
- 3 Moving Averages with variable MA types, periods, price sources, resolutions and the ability to disable each individually
- Crossovers are plotted on the chart with detailed information regarding the crossover (Ex: 50 SMA crossed over 200 SMA )
- Forecasting available for all three MAs. MA values are forecasted 5 values out and plotted as if a continuation to the MA.
- Forecast bias also applies to all forecasting. Bias means we can forecast based on an anticipated bullish, bearish or neutral direction in the market.
- To understand bias, please read the source code, or if you can't read the code just send me a message on here or Twitter. Twitter should be linked to my profile.
- Ribbons added and on by default. Optional setting to disable the ribbons. 5 ribbons between MA1 and MA2 and another 5 between MA2 and MA3.
- Ribbons are alpha-color coded based on their relation to their default MAs.
- Ribbons are only visible between MAs if the MAs being compared share the same Type, Resolution, and Source because there is no way to consolidate those three in a simple manner.
- Ribbon values are calculated based on calculated MA Periods between the MAs.
- Converted the existing study into a strategy
- Strategy only enters long positions with a market order when MA crossovers occur
- Strategy exits positions when crossunders occur
- Trades 100% of the equity with one order/position by default
- Ability to disable trading certain crosses with input checks
This script is meant as an educational script with well-formatted styling, and references for specific functions.
*** PLEASE NOTE - THIS STRATEGY IS MEANT FOR LEARNING PURPOSES. DEPENDING ON IT'S CONFIGURATION IT MAY OR MAY NOT BE USEFUL FOR ACTUAL TRADING. THE STRATEGY IS NOT FINANCIAL ADVICE ***

1H Candlestick vs EMA Crossover# Description — 1H Candlestick vs EMA Crossover (Pine Script)
This indicator is built in **TradingView Pine Script v5** and is designed to track the relationship between the **1‑hour candlestick close** and the **1‑hour Exponential Moving Average (EMA)**. It works on any chart timeframe but always pulls in **1H data** using `request. security`.
### Core Features
* **Customizable EMA length** (default = 200)
* **Plots the 1H EMA** as an orange line on your chart
* Optionally shows the **1H close** as a faint gray line for reference
* Detects and highlights when the **1H candle close crosses above or below the 1H EMA**
* **Arrows**: Green triangles appear below the bar when a bullish crossover happens (1H close > EMA); red triangles appear above the bar when a bearish crossover happens (1H close < EMA)
* **Alerts**: Built‑in `alert condition` statements let you create TradingView alerts whenever a crossover occurs
### How to Use
1. Adjust the EMA length if you want a faster or slower moving average.
2. Enable alerts: Right‑click the chart → Add Alert → choose this indicator and select either “crossed ABOVE EMA” or “crossed BELOW EMA.”
### Trading Applications
* **Trend Confirmation**: Use the 1H EMA as a higher‑timeframe filter while trading on lower timeframes.
* **Entry/Exit Signals**: Crossovers can mark potential entry points for trend continuation or reversals.
* **Scalping/Intraday**: Even on a 5m or 15m chart, you can overlay the 1H EMA to align your trades with the bigger trend.
This makes the indicator a simple yet powerful tool for aligning trades with higher‑timeframe momentum and avoiding false signals from lower‑timeframe noise.

(DAFE) DEVMA - Crossover (Deviation Moving Average) (DAFE) DEVMA - Crossover (Deviation Moving Average)
Let’s keep pushing the edge. After the breakthrough of Deviation over Deviation (DoD)—which gave traders a true lens into volatility’s hidden regime shifts—many asked: “What’s next?” The answer is DEVMA: a crossover engine built not on price, but on the heartbeat of the market itself.
Why is this different?
DEVMA isn’t just a moving average crossover. It’s a regime detector that tracks the expansion and contraction of deviation—giving you a real-time readout of when the market’s energy is about to shift. This is the next step for anyone who wants to anticipate volatility, not just react to it.
What sets DEVMA apart:
Volatility-First Logic:Both fast and slow lines are moving averages of deviation, not price. You’re tracking the market’s “energy,” not just its direction. This is the quant edge that most scripts miss.
Regime-Colored Lines:
The fast and slow DEVMA lines change color in real time—green/aqua for expansion, maroon/orange for contraction—so you can see regime shifts at a glance.
Quant-Pro Visuals:
Subtle glow, clean cross markers, and a minimalist dashboard keep your focus on what matters: the regime, not the noise.
Static Regime Thresholds:
Reference lines at 1.5 and 0.5 (custom colors) give you instant context for “normal” vs. “extreme” volatility states.
No Price Chasing:
This isn’t about following price. It’s about anticipating the next volatility regime—before the crowd even knows what’s coming.
How this builds on DoD:
DoD showed you when volatility itself was about to change. DEVMA takes that insight and turns it into a crossover engine—so you can see, filter, and act on regime shifts in real time. If DoD was the radar, DEVMA is the navigation system.
Inputs/Signals—explained for clarity:
Deviation Lookback:
Controls the sensitivity of the regime detector. Shorter = more signals, longer = only the rarest events.
Fast/Slow DEVMA Lengths:
Fine-tune how quickly the regime lines react. Fast for scalping, slow for swing trading.
Source Selection:
Choose from price, volume, volatility, or VoVix. Each source gives you a different lens on market stress. VoVix is for those who want to see the “regime quake” before the aftershocks.
VoVix Parameters:
Fine-tune the volatility-of-volatility engine for your market. Lower ATR Fast = more responsive; higher ATR Slow = more selective.
Bottom line:
DEVMA is for those who want to see the market’s heartbeat, not just its shadow. Use it to filter your trades, time your entries, or simply understand the market’s true rhythm. Every input is there for a reason. Every plot is a direct readout of the quant logic. Use with discipline, and make it your own.
Disclaimer:
Trading is risky. This script is for research and informational purposes only, not financial advice. Backtest, paper trade, and know your risk before going live. Past performance is not a guarantee of future results.
*Updated the Dashboard/Metrics Display for better visibility
Use with discipline. Trade your edge.
— Dskyz, for DAFE Trading Systems

ScalpyScalpy is made up of a 2 main parts.
- The cloud comprising of a 10 period SMA and a 30 period SMA.
- When the cloud is green you should be looking for long entries.
- When the cloud is red you should be looking for short entries.
- Price is most bullish above a green cloud and most bearish below a red cloud.
- Being within the cloud indicates indecision.
The blue and white lines on the indicator show the relationship between price and momentum.
They can be used to spot reversals in two ways:
- The first is a divergence between price (blue line) and RSI (white line)
- If the price makes a lower low but the RSI makes a higher low this shows the trend is weakening and may be reversing soon (as can be seen by the two yellow lines on the chart).
The second is a simple crossover:
- When the white line crosses the blue line to the upside this signals a long entry.
- When the white line crosses the blue line to the downside this signals a short entry.

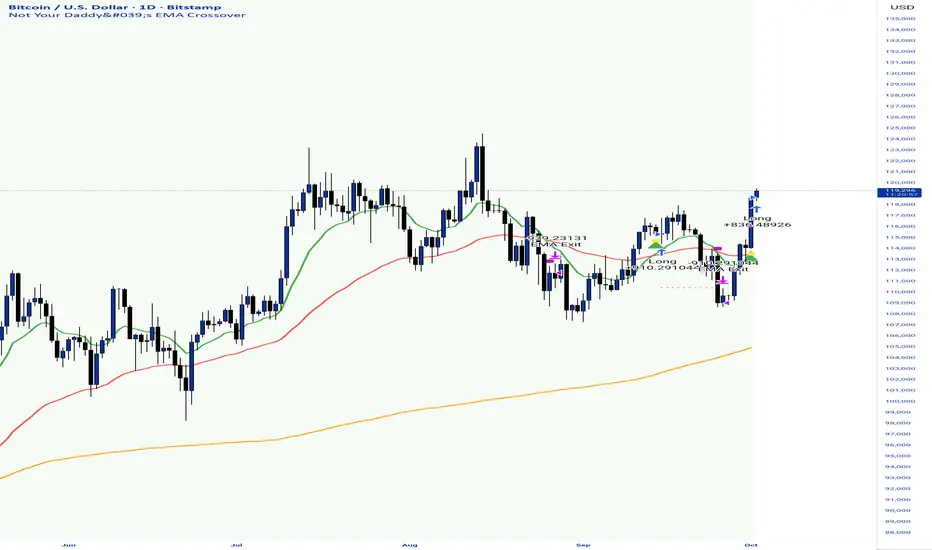
Not Your Daddy's EMA CrossoverNot Your Daddy's EMA Crossover - Quick Guide
What It Does
This isn't your typical 50/200 EMA crossover. It uses academically-proven, optimized EMA periods specifically backtested for crypto markets. Instead of generic settings, it adapts to different trading styles with research-backed parameter combinations that have demonstrated real returns.
Core Logic
Enters when fast EMA crosses slow EMA in the trend direction (confirmed by 200 SMA filter)
Exits either on opposite EMA cross (trend-following) or at fixed profit targets (scalping)
Uses a 200 SMA to filter trades - only longs above it, only shorts below it
Key Settings & Toggles
1. Trading Style (Auto-adjusts EMA periods):
"15 Min Scalping": 9/21 EMA - Fast-paced, frequent signals
"1 Hour Swing": 13/48 EMA - For swing trading
"Daily Trend": 15/150 MA - Captured +97.87% in bull runs
2. Entry Method:
"Crossover Entry": Enters immediately on EMA cross
"Pullback to EMA Entry": Waits for first pullback to slow EMA (better risk/reward)
3. Exit Method:
"EMA Cross Exit": Trend-following, lets winners run until EMAs reverse
"Fixed % Target (Scalping)": Quick 0.5-1% profits with tight stops
4. Optional Features:
MACD Confirmation: Adds 6-15-1 MACD filter for higher-probability setups
Periodic Compounding: Compounds every 30 hours (research shows 1-30 hour compounding is optimal)
Recommended Timeframes
📊 Match your chart to your selection:
Select "15 Min Scalping" → Use 15-minute chart
Select "1 Hour Swing" → Use 1-hour chart
Select "Daily Trend" → Use daily chart
I personally like this on the daily, which coincidentally is printing a long signal today on Bitcoin.
Enjoy!
RSI-EMA-Crossing with Donchian-Stop-LossThe Donchian RSI Indicator is a visual tool that combines momentum and trend analysis to identify high-quality long opportunities based on RSI crossovers, price action, and Donchian channel dynamics.
How It Works
Momentum Signal: A bullish RSI crossover is detected when the RSI crosses above its moving average.
Trend Filter: A signal is only valid if the crossover occurs while the price is above its moving average – filtering out entries against the prevailing trend.
Signal Candle: The high of the crossover candle is stored.
Entry Trigger: A valid signal occurs when a later candle closes above that signal high.
Stop-Loss (Visual Only)
The lower band of the Donchian Channel acts as a visual reference for a dynamic stop-loss level.
Features
Customizable RSI, Donchian Channel, and moving average lengths
Selectable MA types: SMA, EMA, WMA, VWMA, HMA
Signal candle highlighted (yellow background)
Entry points labeled on the chart
Price MA and Donchian Channel plotted
Trend filter improves signal quality by confirming upward bias
Use Case
Designed for swing and position traders
Optimized for use on daily or 4H charts

TradZoo - EMA Crossover IndicatorDescription:
This EMA Crossover Trading Strategy is designed to provide precise Buy and Sell signals with confirmation, defined targets, and stop-loss levels, ensuring strong risk management. Additionally, a 30-candle gap rule is implemented to avoid frequent signals and enhance trade accuracy.
📌 Strategy Logic
✅ Exponential Moving Averages (EMAs):
Uses EMA 50 & EMA 200 for trend direction.
Buy signals occur when price action confirms EMA crossovers.
✅ Entry Confirmation:
Buy Signal: Occurs when either the current or previous candle touches the 200 EMA, and the next candle closes above the previous candle’s close.
Sell Signal: Occurs when either the current or previous candle touches the 200 EMA, and the next candle closes below the previous candle’s close.
✅ 30-Candle Gap Rule:
Prevents frequent entries by ensuring at least 30 candles pass before the next trade.
Improves signal quality and prevents excessive trading.
🎯 Target & Stop-Loss Calculation
✅ Buy Position:
Target: 2X the difference between the last candle’s close and the lowest low of the last 2 candles.
Stop Loss: The lowest low of the last 2 candles.
✅ Sell Position:
Target: 2X the difference between the last candle’s close and the highest high of the last 2 candles.
Stop Loss: The highest high of the last 2 candles.
📊 Visual Features
✅ Buy & Sell Signals:
Green Upward Arrow → Buy Signal
Red Downward Arrow → Sell Signal
✅ Target Levels:
Green Dotted Line: Buy Target
Red Dotted Line: Sell Target
✅ Stop Loss Levels:
Dark Red Solid Line: Stop Loss for Buy/Sell
💡 How to Use
🔹 Ideal for trend-following traders using EMAs.
🔹 Works best in volatile & trending markets (avoid sideways ranges).
🔹 Can be combined with RSI, MACD, or price action levels for added confluence.
🔹 Recommended timeframes: 1M, 5M, 15m, 1H, 4H, Daily (for best results).
🚀 Try this strategy and enhance your trading decisions with structured risk management!

Dysmen signalsDysmen Signals Indicator
The "Dysmen Signals" indicator is designed to provide clear buy and sell signals based on the crossover of various Exponential Moving Averages (EMAs). This indicator employs a combination of short-term and long-term EMA crossovers to identify potential trading opportunities, while also highlighting significant market movements through specific signals such as the Golden Cross and Death Cross.
Indicator Components
1. Exponential Moving Averages (EMAs)
- EMA 14: A short-term EMA calculated over 14 periods.
- EMA 20: Another short-term EMA calculated over 20 periods.
- EMA 50: A mid-term EMA used as a trend filter.
- EMA 200: A long-term EMA representing the overall trend.
2. Buy and Sell Signals
- Buy Signal: This is triggered when the EMA 14 crosses above the EMA 20 and the closing price is above the EMA 50. This suggests a bullish trend in the market.
- Sell Signal: This is triggered when the EMA 14 crosses below the EMA 20 and the closing price is below the EMA 50. This indicates a bearish trend in the market.
3. Golden Cross and Death Cross
- Golden Cross (GC): Occurs when the EMA 50 crosses above the EMA 200. This is a strong bullish signal indicating a potential long-term upward trend.
- Death Cross (DC): Occurs when the EMA 50 crosses below the EMA 200. This is a strong bearish signal suggesting a potential long-term downward trend.
4. Signal Visualization
- Buy and Sell signals are marked on the chart with green and red triangles respectively. These signals help traders identify potential entry and exit points.
- Golden Cross and Death Cross signals are indicated with yellow and purple diamonds respectively, providing insight into major market trend shifts.
5. Candle Coloring
- Candles are colored green if a buy signal is active and red if a sell signal is active. This visual aid helps in quickly identifying the prevailing market sentiment.
6. EMA 200 Plotting
- The EMA 200 is plotted as a white, semi-thick line on the chart. This line serves as a reference for the overall long-term trend.
Detailed Code Explanation
- EMA Calculations: The script calculates the EMA for 14, 20, 50, and 200 periods using the ta.ema function.
- Crossover Conditions: It uses the ta.crossover and ta.crossunder functions to detect when the EMAs cross each other, triggering buy and sell signals.
- Plotting Signals: The plotshape function is utilized to display BUY and SELL signals as well as Golden Cross and Death Cross signals on the chart.
- Candle Coloring Logic: A variable direction is used to store the current market direction based on the latest signal, which then determines the candle colors using the barcolor function.
- EMA 200 Display: The plot function is used to draw the EMA 200 line on the chart with the specified color and thickness.
By employing this indicator, traders can gain valuable insights into potential market trends and make more informed trading decisions based on the crossover of key EMAs.

VWAP Bollinger Band Crossover Breakout with ResistanceCredit to © Jesus_Salvatierra for VWAP script
This script help you find a trend in momentum stock that is about to breakout and shows resistance point. This script utilizes Bollinger bands VWAP and is good for intra day charts.
VWAP, or Volume Weighted Average Price, is a technical analysis tool used to measure the average price a security trades at during a given time period, weighted by the trading volume for each price level. It is commonly used by traders and investors to identify the true average price of a security and to assess whether they are buying or selling at a fair price.
A Bollinger Band is a technical analysis tool that uses standard deviation to measure the volatility of a security. The Bollinger Band is typically composed of three lines: the upper band, the lower band, and the middle band. The middle band is a simple moving average of the security's price, while the upper and lower bands are calculated based on the standard deviation of the security's price.
A Bollinger Band crossover occurs when the price of a security crosses above or below one of the bands. When the price crosses above the upper band, it is considered overbought, while when it crosses below the lower band, it is considered oversold. Traders often use Bollinger Band crossovers as a signal to enter or exit a position, depending on their trading strategy.
The VWAP and Bollinger Band crossover are two separate technical analysis tools that can be used in conjunction with each other. When a security's price crosses above or below the Bollinger Band, traders may look to the VWAP to confirm whether the security is trading at a fair price. If the security is trading above the VWAP, it may be overvalued, while if it is trading below the VWAP, it may be undervalued. Similarly, traders may use the Bollinger Band crossover as a signal to enter or exit a position, while also taking into account the VWAP to assess whether the price is fair.

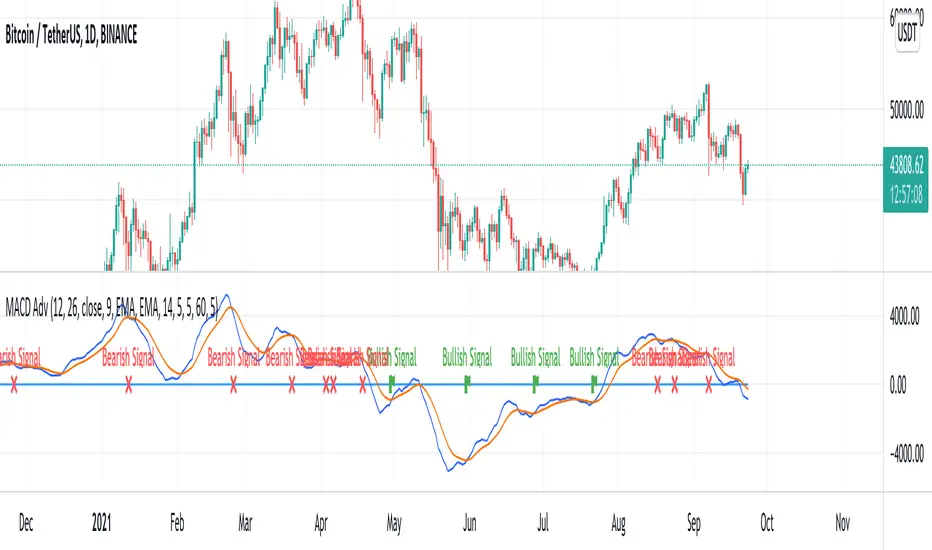
MACD AdvancedHello traders!
As you know, MACD is one of the oldest and the most popular indicators for trading. It seems to be a «Hello world indicator» of most technical analysis beginners. It’s easy to interpret and rather useful for many styles of trading. There are many arguments about its accuracy but in my opinion, this indicator can show very good results. However, you should squeeze every drop of its opportunities and we'll help you with it. We invented this script to make the lives of both professionals and freshmen easier.
Our new indicator uses all the opportunities that MACD gives. It takes into consideration divergencies, crossovers, the MACD, and signal line location. It seems to be rather difficult to take into consideration all MACD signals when you don’t use algorithmic trading, but it’ll be trivial using our script. We have integrated some innovations that’ll make traders’ staff easier. As you know, the crossover is considered to be a false signal in conjunction with hidden divergence which predicts another movement. Thus, we catch all types of divergencies and if it’s hidden of another «value» we skip it. However, if there's a crossover with bullish divergence or cross under with bearish, the signal seems to be strong and accurate. In this case, divergence is playing for us and makes the point of entrance more trustable. Our script takes into consideration this case and the innovative divergence chaser doesn’t give any mistakes. Moreover, if crossover takes place above zero line and crosses under bellow it, these signals are considered to be false too. It’s a trivial task comparing with the previous, thus it’s extremely simple for our script. We called it MACD Advanced cause it uses all the power of MACD with the power of invasive divergence chasers. The usage of it is trivial. Just add it to the chart, tune the parameters like MACD and tune the divergence chaser and get very accurate signals. We decided not to draw the bars to make signals more visible. It seems to be very nice!
I hope guys you'll enjoy it and it'll become a part of your trading staff.
ALP AT + KAMA Crossover This indicator is a powerful combination of two adaptive trend-following concepts: the AlphaTrend by Kivanc Ozbilgic and the Kaufman's Adaptive Moving Average (KAMA), often credited to Perry Kaufman (with the specific implementation based on HPotter's interpretation of KAMA).
The primary goal of this indicator is to provide a robust trend detection and dynamic support/resistance system, adapting to market volatility.
How it Works:
AlphaTrend Component: The green/red line is the AlphaTrend. It dynamically adjusts to market volatility (using ATR) and momentum (using MFI or RSI, configurable). It provides faster signals for trend changes.
KAMA Component: The black line is the Kaufman's Adaptive Moving Average. KAMA is designed to filter out market noise during choppy periods and follow the price closely during trending periods, making it a smoother and more reliable long-term trend indicator.
Color-Coded Trend Zones: The AlphaTrend line is color-coded to visually represent the current market condition based on the price's position relative to both AlphaTrend and KAMA:
Strong Uptrend (Lime Green): Price is above both AlphaTrend and KAMA.
Strong Downtrend (Red): Price is below both AlphaTrend and KAMA.
Uptrend Uncertainty (Orange): Price is above KAMA but below AlphaTrend (suggests consolidation or weakening uptrend).
Downtrend Uncertainty (Blue): Price is below KAMA but above AlphaTrend (suggests consolidation or strengthening downtrend within a downtrend).
Gray: Default/unclassified state.
The underlying logic is based on:
Bullish Crossover (Potential Buy Signal): When the AlphaTrend line crosses above the KAMA line.
Bearish Crossover (Potential Sell Signal): When the AlphaTrend line crosses below the KAMA line.
These crossovers indicate a shift in the adaptive trend momentum.
Customization:
Users can customize various parameters in the indicator's settings, including:
AlphaTrend Multiplier and Common Period.
KAMA Lengths and Alpha values.
All the color codes for different trend zones and lines, allowing for full personalization of the visual output.
Disclaimer:
This indicator is for informational and educational purposes only and should not be considered as financial advice. Trading involves substantial risk, and past performance is not indicative of future results. Always conduct your own thorough research and analysis before making any trading or investment decisions. This indicator is NOT a buy/sell/hold recommendation. Use it as a tool to aid your analysis, not as a sole basis for your trades.

MACD Crossover + AlertMACD Proximity & Crossover Alert Script
This script is designed to help traders stay ahead of MACD crossovers by providing:
Early alerts when the MACD and Signal lines are getting close (within a customizable threshold)
Instant alerts when a bullish or bearish crossover occurs
Whether you're swing trading or scalping, this tool gives you advanced notice to prepare — and a confirmation signal to act on. It works on any timeframe and helps avoid late entries by alerting you when momentum is shifting.
Features:
Customizable MACD settings (fast, slow, signal length)
Adjustable "proximity" threshold
Visual background highlight when lines are close
Built-in alert conditions for:
MACD crossing above Signal (bullish)
MACD crossing below Signal (bearish)
MACD and Signal getting close (early warning)
Perfect for traders who want a heads-up before momentum shifts — not just a reaction afterward.
Multiple MAsHere's a well-written description in English for your "Multiple MAs" indicator that you can use when publishing on TradingView. It’s concise, professional, and highlights the key features of the indicator while explaining its purpose for traders.
---
### Multiple MAs Indicator
#### Overview
The **Multiple MAs** indicator is a versatile and straightforward tool designed to help traders visualize price trends using multiple Simple Moving Averages (SMAs) on a single chart. By plotting six SMAs with customizable lengths (MA5, MA10, MA20, MA50, MA100, and MA200), this indicator provides a clear view of short-term, medium-term, and long-term trends, making it ideal for trend-following strategies, crossover analysis, and identifying potential support/resistance levels.
#### Features
- **Customizable MA Lengths**: Adjust the periods of all six moving averages (MA5, MA10, MA20, MA50, MA100, MA200) to suit your trading style and timeframe.
- **Distinct Visuals**: Each MA is plotted with a unique color and line width for easy identification:
- MA5 (Dodger Blue, 1px)
- MA10 (Green, 1px)
- MA20 (Red, 2px)
- MA50 (Purple, 3px)
- MA100 (Gray, 3px)
- MA200 (White, 3px)
- **Overlay on Price Chart**: The indicator overlays directly on the price chart, allowing for seamless integration with other technical analysis tools.
- **High Precision**: Displays values with 8-decimal precision, ensuring accuracy for assets with small price movements (e.g., forex pairs or cryptocurrencies).
#### How to Use
1. **Trend Identification**: Use the longer MAs (e.g., MA100, MA200) to determine the overall trend direction. If the price is above these MAs, the trend is likely bullish; if below, it’s likely bearish.
2. **Crossover Signals**: Look for crossovers between shorter MAs (e.g., MA5 crossing MA20) for potential entry or exit signals. For example:
- A bullish signal occurs when a shorter MA crosses above a longer MA.
- A bearish signal occurs when a shorter MA crosses below a longer MA.
3. **Support and Resistance**: MAs often act as dynamic support or resistance levels. Watch for price reactions around these lines, especially the MA50, MA100, and MA200.
4. **Divergence Analysis**: Compare the slope of different MAs to identify potential trend reversals or weakening momentum.
#### Settings
- **MA5 Length**: Default is 5 bars.
- **MA10 Length**: Default is 10 bars.
- **MA20 Length**: Default is 20 bars.
- **MA50 Length**: Default is 50 bars.
- **MA100 Length**: Default is 100 bars.
- **MA200 Length**: Default is 200 bars.
#### Best Practices
- **Timeframe**: This indicator works on any timeframe but is particularly effective on daily, 4-hour, and 1-hour charts for swing trading or trend-following strategies.
- **Combine with Other Tools**: Pair the Multiple MAs with other indicators like RSI, MACD, or volume analysis to confirm signals and avoid false breakouts.
- **Adjust for Volatility**: For highly volatile assets, consider increasing the MA lengths to reduce noise and focus on broader trends.
#### Notes
- The indicator is lightweight and optimized for performance, ensuring it runs smoothly even on lower timeframes.
- Colors and line widths are pre-set for clarity but can be customized in the indicator settings if needed.
#### Credits
Created by kosar_v. Feedback and suggestions are welcome to improve this tool for the TradingView community!

EMA Crossover Backtest [BarScripts]This indicator lets you backtest an EMA crossover strategy with built-in risk management and trade tracking. It simulates long and short trades based on EMA crossovers, allowing you to fine-tune entry conditions, stop-loss placement, and reward/risk settings.
🔹 How It Works:
Long Entry: Fast EMA crosses above Slow EMA, and price closes above Fast EMA.
Short Entry: Fast EMA crosses below Slow EMA, and price closes below Fast EMA.
Stop Loss: Set based on previous bars or a fixed amount.
Take Profit: Adjustable reward/risk ratio.
Higher Timeframe Confluence: Confirms trades based on a larger timeframe.
Trade Hours Filter: Limits trades to specific time windows.
🔹 Key Features:
✅ Shows Entry & Exit Points with visual trade lines.
✅ Customizable EMA Lengths to fit any strategy.
✅ P&L Tracking & Statistics to measure performance.
✅ Position Sizing Options: Fixed position, fixed risk, or percentage of balance.
✅ Commissions Tracking (based on total trades, not contracts).
Use this tool to fine-tune your EMA crossover strategy and see how it performs over time! 🚀
💬 Let me know your feedback—suggest improvements, report issues, or request new features!
