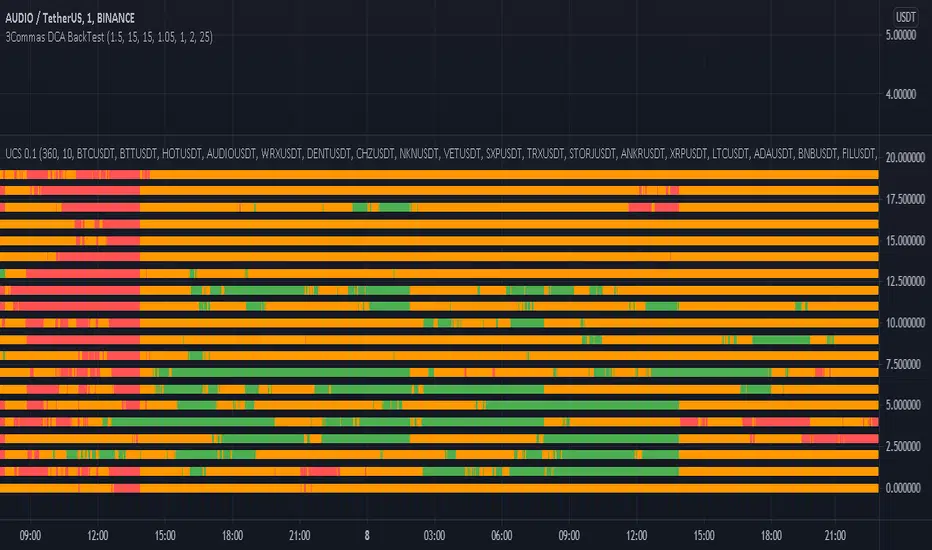
Crypto Market VolatilityCross market look at different Crypto markets ans their growth from the lowest value in 6 hours.
Green = +10% growth
Orange = 0 001- 9.99% growth
red = lowest price in last 6 hours
Use 1 minutes candles.Orange lines signify less volatility for bots.
Tìm kiếm tập lệnh với "crypto"
Crypto Cross MarketCross market look at Crypto currencies under and arround 1USDT and their percentage increase in a 6 hour period.
Crypto Bot Buy Signal 01 - Optimized RSI MomentumWelcome to our first Tradingview buy signal indicator.
We develop signals which have been specially developed for crypto trading bots. We publish new indicators at regular intervals.
This strategy is based on our "Crypto Bot Signal 01 - Optimized RSI Momentum" indicator, so that you can apply and test this strategy to your charts/pairs.
The basic idea of this script is to compare a low sensitive RSI with a low sensitive smoothed RSI to find the sweet spot to buy. This strategy is relatively robust against false breakouts, even if these can of course never be avoided. These signals occur relatively rare, but you can set an alarm up on different pairs simultaneously. The strategy works best in 5 min chart and in crypto pairs. It wasnt tested in Forex etc. but feel free to test it.
We recommend to base your sell strategy on trailing stop-loss and not indicator based. A traling stop-loss arming at 1% and trailing stop-loss percentage at 0.3% works well. Our goal was it to reduce the average coin holding time to a minimum. We recommend this procedure cause we believe in the power of long term uptrending crypto, compounding and dont want to sell at a loss in a false breakout. But you can handel it like you prefere.
Feel free to adjust the parameters to your preferences:
- A lower value of the RSI and EMA length makes this indicator more sensitive
- A lower threshold value results in better trades but it reduces the amout of possible trades per day
- A higher threshold value results in more trades but the risk of false breakouts gets higher
We sell this indicator so it is invite only. But of cause you can test it before buying. Also you can freely test the strategy before. Simply check out our profil and look for "Crypto Bot Signal 01 Strategy - Optimized RSI Momentum".
If there are questions, write them into the comments or contact us directly over the direct message. Happy Trading!

Crypto Bot Signal 01 Strategy - Optimized RSI MomentumWelcome to our first Tradingview strategy.
We develop signals which have been specially developed for crypto trading bots. We publish new indicators at regular intervals.
This strategy is based on our "Crypto Bot Signal 01 - Optimized RSI Momentum" indicator, so that you can apply and test this strategy to your charts/pairs.
The basic idea of this script is to compare a low sensitive RSI with a low sensitive smoothed RSI to find the sweet spot to buy. This strategy is relatively robust against false breakouts, even if these can of course never be avoided. These signals occur relatively rare, but you can set an alarm up on different pairs simultaneously. The strategy works best in 5 min chart and in crypto pairs. It wasnt tested in Forex etc. but feel free to test it.
The sell strategy is based on trailing sell and not indicator based cause we believe in the power of long term uptrending crypto, compounding and dont want to sell at a loss in a false breakout. You can set the trailing sell limit to your own preferences or leave it at default value. Our goal is to reduce the average coin holding time to a minimum.
Feel free to adjust the parameters to your preferences:
- A lower value of the RSI and EMA length makes this indicator more sensitive
- A lower threshold value results in better trades but it reduces the amout of possible trades per day
- A higher threshold value results in more trades but the risk of false breakouts gets higher
- Adjusting the trailing sell parameters influences the coin holding time and the results
If there are questions, write them into the comments or contact us directly over the direct message. Happy Trading!

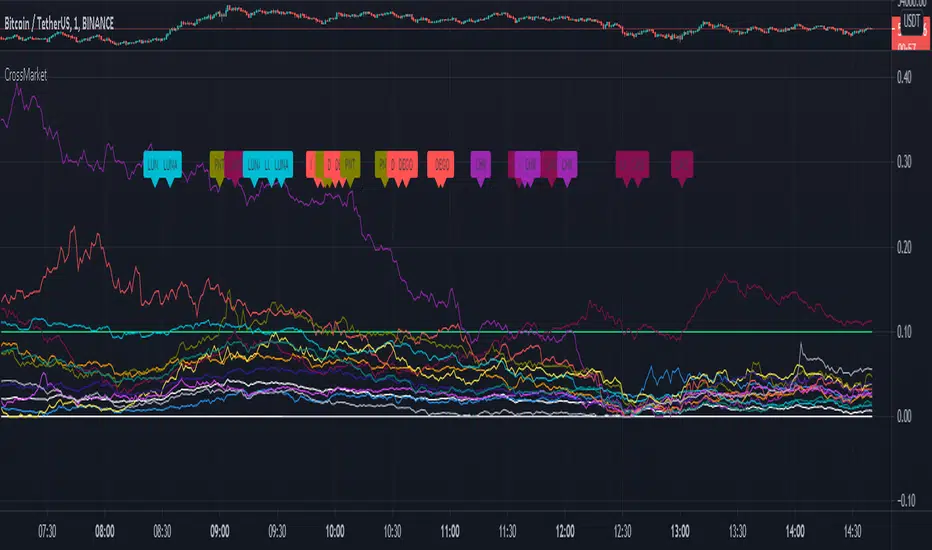
Crypto _Market_Compare - XRAY vision Showing data from all corners of the crypto market. Each data input has is own color and label for better visuals. Left click the scale on the indicator and turn on "indicator labels" as well as "indicator value" and make sure there is "no overlapping labels".
This awesome visual is a quick glance tool to help you to grasp the health and current state of an asset vs the market and USD. Often traders overlook the importance of this and I always try to study this data to show what is possible for my profit goals and timeframe.
Things to look for and how these :
PATTERNS!
Crossings (up/down)
Levels
Status or Grade of each plot (which is lowest, low, high, higher, highest etc)
Send inquiries via message for paid access.

CRYPTO HA Strategy money maker long termToday I bring you another amazing strategy.
Its made of 2 EMA in this case 50 and 100.
At the same time, internaly for candles we calculate the candles using the HA system ( while still using in live the normal candles). This way we can assure that even if we use HA candles, we avoid repainting, and its legit.
We first calculate the HA candles based on the EMA 50 values, and after that , we use that candle properties to apply to EMA 100.
Once we have that, for entries we have the next conditions :
sell = o2 > c2 and o2 < c2 and time_cond
buy = o2 < c2 and o2 > c2 and time_cond
For sell : Our open from HA 100 is bigger than Close from ha 100, and the previous open is smaller than previous close
For long : Our open from ha 100 is smaller than close from ha 100 and the previous open is bigger than previous close.
Then we have 2 options :
If we wnat to go only long , which is my prefered version ,or the original one where we go both long and short.
I found that the best results are in general around bigger timeframes, 1h+ , 3h works the best so far on my tests.
For exit we have 2 versions :
1 lets say we had a long signal, as soon as we have a short signal we close the trade. Viceversa for short.
2. Is based on price % movement. In this case I use 7.5% price movement of asset.
We have no TP in use for this system.
For the purpose of this test I use 10.000 $ account. For test I use 100% of it, without any leverage.
I use the SL based on price movement , which is a very risky tool, since it can fluctuate even at 20-30% of our capital.
For comission I used 0.1% for each deal, and a slippage of 5 points.
Be cautious with this system !
If you have any questions , message me.

Crypto Smart VortexThe indicator is designed to work in conjunction with the Crypto Smart Scalper, it can identify potential retracement zones which will help you make a decision on whether to enter a trade or wait for a retest of the entry zone, it will also allow you to determine the best take profit points.
This is NOT a trading system and should be used with supporting information and data. It is not identifying or is meant to represent a standalone trading system.
If you would like to enquire about access to this invite only script please send me a private message on trading view and I will be happy to assist. Thank you.

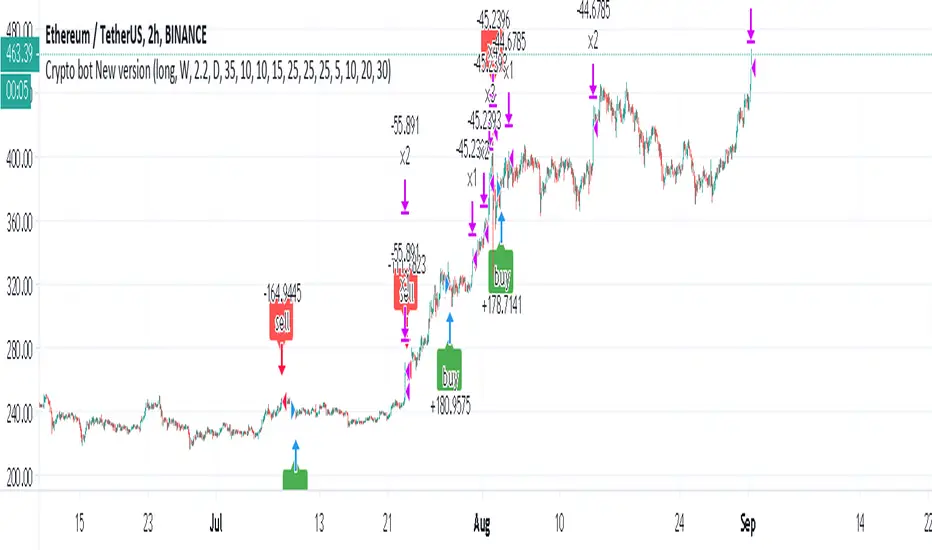
Crypto bot New versionOk this strategy is for those who want to take risks but to do it smartly
based on a modified version of as buy entry
the exit is mix of highest of pivot and fib level (similar to pivot bot that i put early but with my improve setup)
this bot is non repaint one as no security attach to it
set to 10% of lot and 10X levrage
it very good for longs (quite shity for shorts:)
the exit control by high time frame and the factor (set to 2.2)
the buy is control bu HTF
this is my setting for Ethereum
the take profit is set to take at each point 25% and then to move forward with it (5,10,20,30%)
in a bullish market as we are now this is logical setting. in bearish one you need to set your target lower
there is no repaint here
as you see the strategy start from 2018 when ether was around 1300 and despite what happen in the market it was making very decent profit
Risk management is key for winning so if you use my strategy be aware that this strategy is a very slow one but in long term seems to be very good
try to find the settings that suite you
use the factor to see if it make the exit better or worse
the strategy can work on other assets not just crypto but you need to find the best settings for it
Crypto Monitor / DashboardI created a Crypto Monitoring Dashboard!
Here is the idea behind it:
Monitor up to 4x Symbols on one chart
Monitor 2x Time Frames at once
Monitor 3x indicators
So to get into the details a bit more and how to use it. There are 4 separate rows for each symbol
Row 1: Shows the status of the MACD indicator on the higher and lower time frame and color codes them accordingly.
Row 2: Shows the higher time frame RSI value compared to pre-determined values for bullish , oversold, and overbought.
Row 3: Shows the lower time frame RSI value compared to pre-determined values for bullish , oversold, and overbought.
Row 4: Shows the status of the price compared to the moving average. Price greater then the MA is considered bullish ; below is bearish
Since things get rather cramped with the multiple symbols on all at once, the intention is that you enlarge this and look at just ( aka not with the bar chart) this for your favorite 4 coins and then when you see the conditions you want, you close it and open the chart of your coin.
Please feel free to leave a comment if you have questions or suggestions on how to improve it! Appreciate the feedback

Crypto Trading Hours UTC based on Berlin time (UTC +2)Although crypto markets trade 24/7, there are spikes in volume according to the general hours at which different parts of the world do the majority of their trading.
This Script highlights the US, European and Asian markets when they are most active. The normal market hours are always from 08:00 to 16:30 local time.
US market opens at 8:00 Silicon Valley local time, and closes at 16:30 New York local time.
European market opens at 8:00 London local time, and closes at 16:30 Frankfurt local time.
Asian market opens at 8:00 Hong Kong local time, and closes at 16:30 Sydney local time.

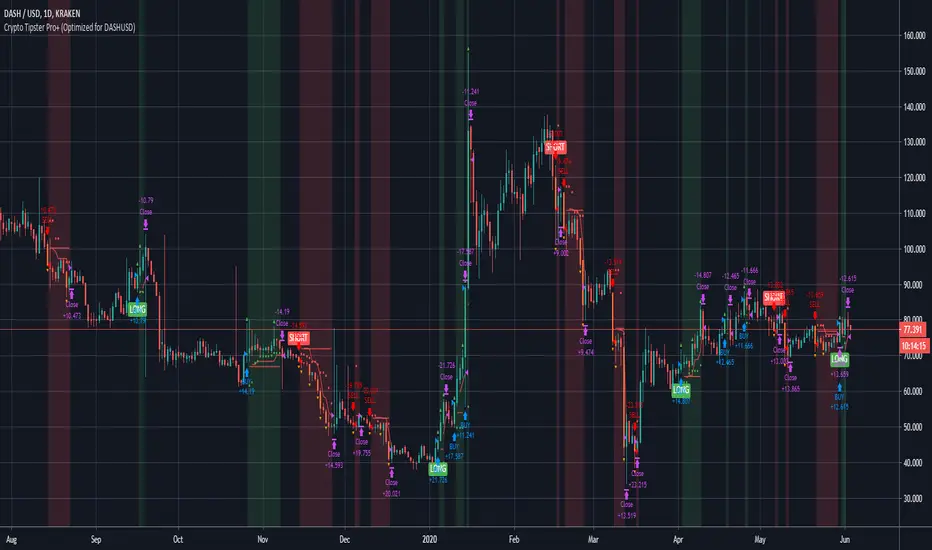
Crypto Tipster Pro+ (Optimized for DASHUSD)===========
Crypto Tipster Pro+ Optimized for DASHUSD
===========
This script is a carbon-copy of our Crypto Tipster Pro Strategy , but also includes our Custom & Fully Optimized Settings for turbo-charging your DASH (DASHUSD) trading.
-----------
We keep all our Crypto Tipster Pro+ (Optimized) strategies regularly updated and maintained. The purpose of these Add-On's to our Crypto Tipster Pro Strategy is to keep each trading plan relevant, up-to-date and most of all profitable within ever-changing markets.
We will always keep our main Crypto Tipster Strategy active, as we find the default settings are the best "all-rounder" set-up and work with many crypto pairs over many different time frames, try it for yourself! This Set-Up for DASH enables you to hone in on one certain trading pair on the 'D' chart and maximize your overall trading experience.
-----------
Visit the link below for Full & Immediate Access!
Good Luck and Happy Trading!
Crypto Tipster Pro+ (Optimized for ETCUSD)===========
Crypto Tipster Pro+ Optimized for ETCUSD
===========
This script is a carbon-copy of our Crypto Tipster Pro Strategy , but also includes our Custom & Fully Optimized Settings for turbo-charging your Ethereum Classic (ETCUSD) trading.
-----------
We keep all our Crypto Tipster Pro+ (Optimized) strategies regularly updated and maintained. The purpose of these Add-On's to our Crypto Tipster Pro Strategy is to keep each trading plan relevant, up-to-date and most of all profitable within ever-changing markets.
We will always keep our main Crypto Tipster Strategy active, as we find the default settings are the best "all-rounder" set-up and work with many crypto pairs over many different time frames, try it for yourself! This Set-Up for Ethereum Classic enables you to hone in on one certain trading pair on the 'D' chart and maximize your overall trading experience.
-----------
Visit the link below for Full & Immediate Access!
Good Luck and Happy Trading!


Crypto Ingenius Breakout w AlertsThis is the study version with working alerts of the Crypto Ingenius Breakout Strategy since alerts only work in studies

Crypto Ingenius Breakout w AlertsThis is a breakout strategy designed for crypto currency markets with alerts for buy and sell entries as well as buy and sell exits. It is designed primarily to work on 1 hour and 4 hour charts. Message me for a free 7-day trial and for pricing
CryptoJJ - SSL indicatorThe SSL indicator with colour change. Tool for spotting trends and finding good entry points. I recommend using it for higher timeframes, from 4h to 1D.
Play with the settings, you can change the moving avarage type, its length, if you prefer having the default
bar colours in your chart, disable the colouring function in the script.
Good luck crypto traders!
CryptoJJ

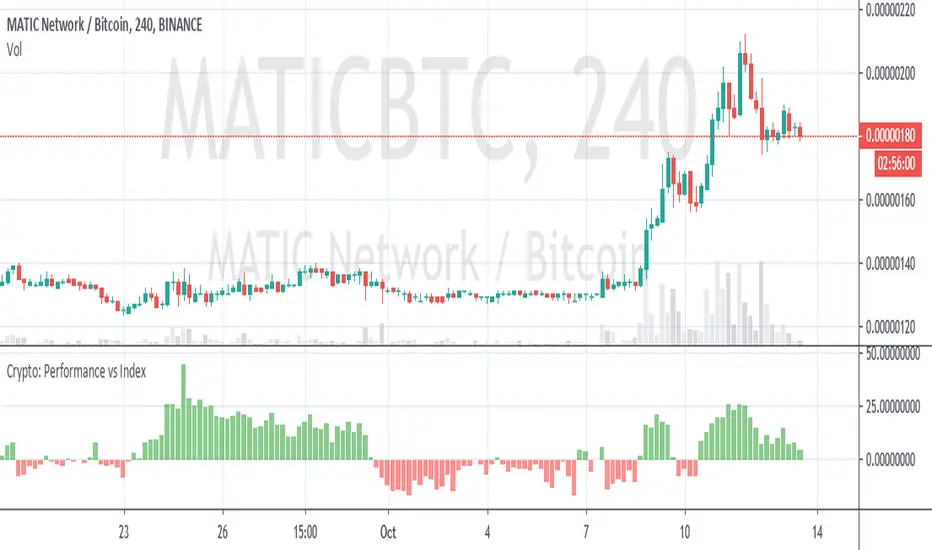
Crypto Performance vs IndexQuickly shows you if an altcoin is outperforming or underperforming it's peers. You can compare again indexes of high cap, mid cap and low cap indexes, which are provided by FTX.com. I intend to add some more features but am currently a bit busy so wanted to get it published as I've been finding it useful
Crypto - Candle Price Info PanelInfo Panel that displays difference in percentages between current candle open value and highest/lowest wick values in past "X" number of candles
Quickly glance at a simple and recent price action range. Due to displayed difference in percentages more useful on Crypto, stocks etc. than Forex
Put together as a learning project with help, code and advice from @jhanson107, @Zekis.

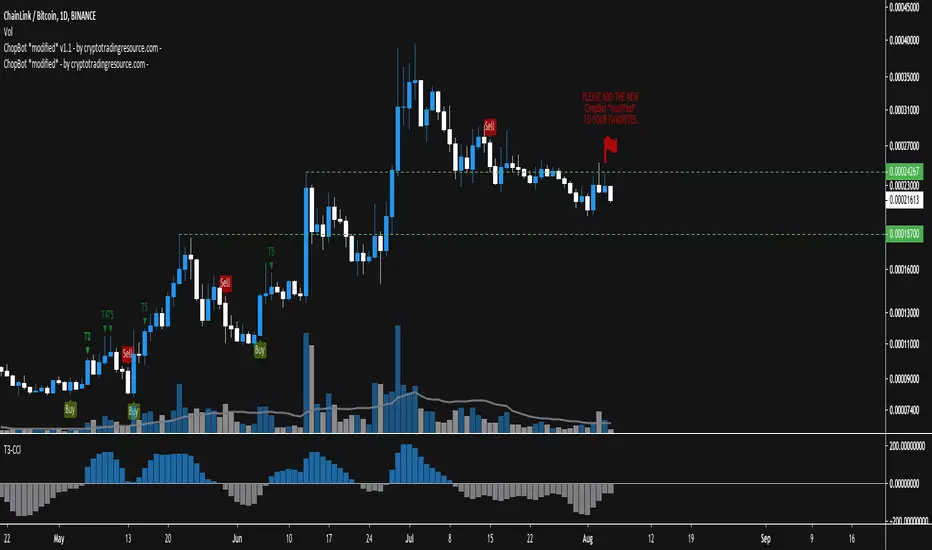
ChopBot *modified* v1.0 - by cryptotradingresource.com -This is my modified version of the original strategy by @yerb
It has just a little tweak in it, but this already works out that you'll receive less signals. There is for sure more room to perfection but it looks accurate.
Try it out on different timeframes, find the best on for your asset and enjoy trading!
For now included
Buy and Sell plots
Alerts for plots
Some examples:
BTCUSD 1D
BNBBTC 1H
THETABTC 6H
RVNBTC 2D
Happy trading
+++ use this tool on your own risk. i'm not responsible for your loses +++
____________________________________________________________________________
BTC: 1GVRDK3HHr9CKM5SF2CGpCNXFuavB3L4j9
ETH: 0x7b825fa752b9926D3E8397cDb1d9E5473D074646
XMR: 41zL2SQS7zyZmwXKng2TeUWsMi5vMmkgSdDCjULUTvM6ichwm1E2ZDEYGt56zk9ghoM9bekhjycSwa8amtTcB2JiUet5jtg
NEO: AXja5xPDhczfm2ujHyBfpkQAAnMsXsazmb
ZEC: zcZzFkRx95cp7MtuW8wLhC5zz5RYF9QkT2uPPmhZZHc6ppXepHGgCSeAS1rtD6WFdqsM5p1gZm2gfirnrnviucsdP4aCpqU
XLM: GAXUQJSW55C7MAC4GI26NZUGIKSHFDVFRFKZCXPLMPY4HCADSDT55XK6
WAVES: 3PCMkNpMHxSraTCkwV1ENcBKa9sXbVCGjQX
BCH: qz57n04ud6mn42u00aymqkku8tfh0lk4jv9c28mjvv
____________________________________________________________________________
++++ cryptotradingresource.com ++++
____________________________________________________________________________
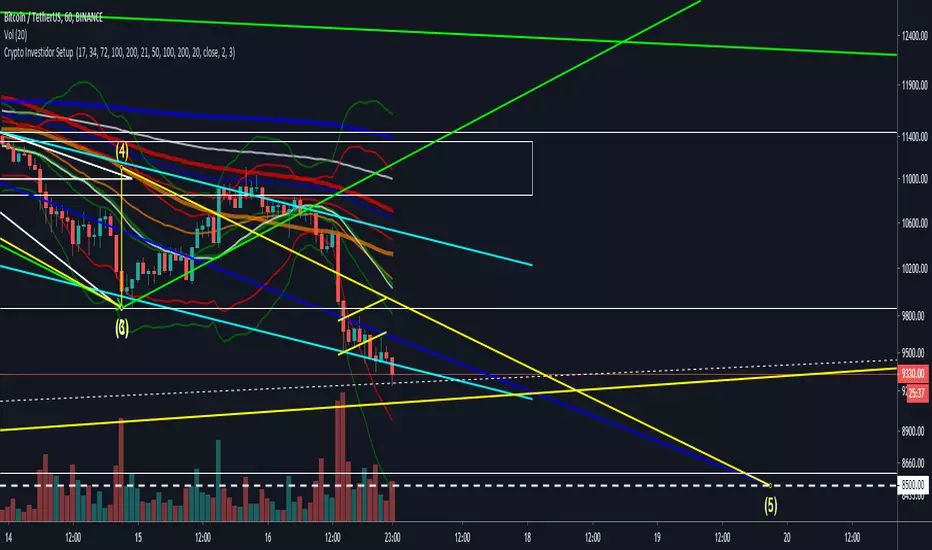
Crypto Investidor Setup Indicador Consiste em
EMAs Crypto Investidor - 17 / 34 / 72 / 100 / 200
MAs - 21 / 50 / 100 / 200
Bollinger Bands 2
Bollinger Bands 3
Crypto Noodles ema S/R bands + supertrendSpecial combination of bands/lines for support and resistance in bear and bull market, also for catch spike , when price go out of them. Also integrated a supertrend indicator with green and red smoothed heikin ashi candles.

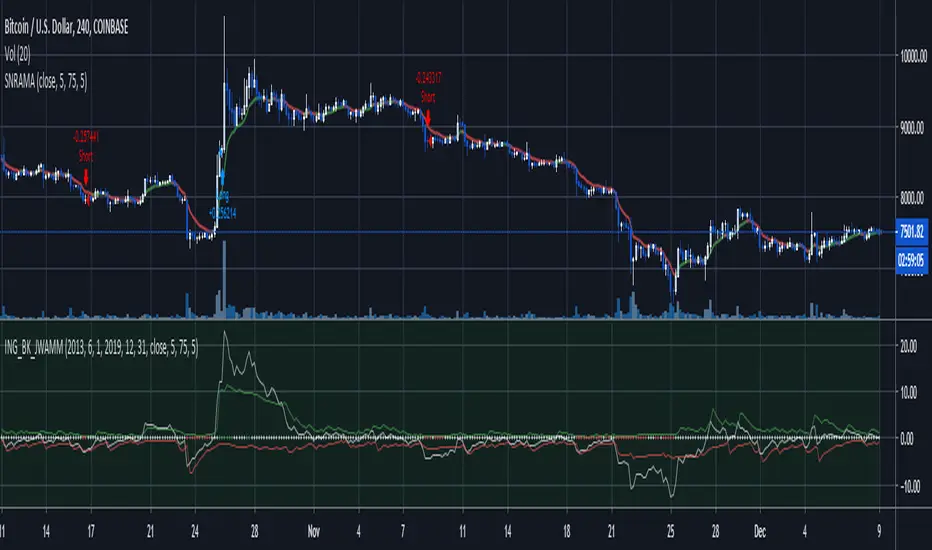
Anas crypto auto regrission channel weekly crypto auto regression channel for weekly period , recommend to be used on 4 hours time frame , this will not work on any thing else , only crypto or any 24 hours/7(days) charts , other charts 24/5 , 8/5 , 16/5 will not work .
enjoy and don't forget to like :)
