CryptoMettle - Crypto Market Support BandAs the name suggests, the Crypto Market Support Band has historically acted as a support band in bull runs. It refers to the band between the 20W Simple Moving Average (SMA) and 21W Exponential Moving Average (EMA).
Tìm kiếm tập lệnh với "crypto"

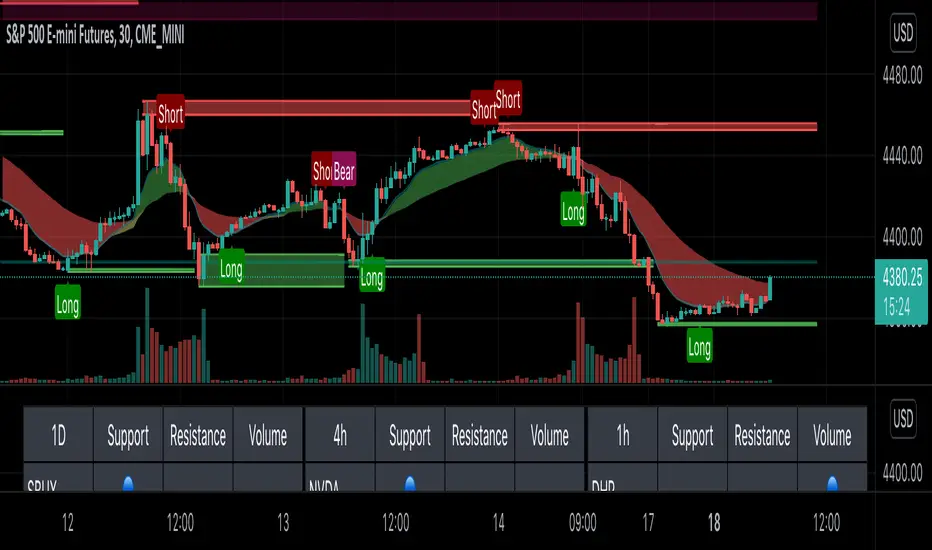
Clutch AlgoThe Clutch Algo provides reversal signals and trend signals. The indicator can be used for stocks, crypto and forex. It can also be used for day trading and swing trading.
Reversal signals were done by modifying the Bollinger Bands and MACD and combining them in a unique way to find explosive price actions. These have been modified to provide signals at the bottom or top of a trend to catch price reversals and to improve margin of safety on trades. These signals are labeled as “Long” and “Short”.
We also added automatic support and resistance zones to increase the accuracy of the “Long” and “Short” signals. This was done by using historical price action of highs and lows and periods of consolidation where price reversed.
The trend signals, which are labeled as “Bull” and “Bear” signals use a combination of exponential moving averages. These signals can be used as trend continuations.
We also added an exponential moving average cloud to help traders easily visualize trend. This can be used as a guide to help you stay in a trade to maximize profits. It can also be used as a guide to get out of a trade if price breaks out of the cloud. The third use of the cloud can be used as support resistance in between high/low support and resistance zones.
Tips:
- Only take long/short signals when there is a support or resistance zone formed at or near the long/short signal, preferably within 1-3 bars of the support or resistance zone. Signals too far from "Long" or "Short" signals reduces your margin of safety.
- When in a Long or Short position, use support or resistance zones as a stop loss level as price is likely to go against the position.
- When taking a Long/Short or Bull/Bear signal, wait for candles to be completed to get best entry possible.
- Previous support zones can be used as resistance zones and previous resistance zones can be used as support zones.
- The support and resistance (SR) period can be adjusted. Numbers in the SR settings are bars looking back. For example, a setting of 10, looks back 10 bars.
Follow the Crypto ShortsThis script allows to test the impact of variations in the number of BTCUSD Shorts Positions on its price. In particular, it compares the number of short positions with its moving average to decide if shorts are being liquidated. In case the number of short positions crosses below its moving average, it will generate a Long Position, which will be closed if shorts crosses above its moving average.

Modified DCA Strategy - Crypto Fear/Greed IndexThis indicator uses historical crypto fear and greed index (0-100) data and labels the low points (extreme fear) and the high points (extreme greed).
The strategy is to DCA at the points of extreme fear, and to sell at points of extreme greed.
When backtested, profit margins are significantly higher than regular DCA strategy.
Not financial advice. Use at your own risk.

Market Hedge RatioRatio of crypto (total, Bitcoin, or Ethereum market cap) to major stable coins.
A low ratio suggests a lot of people are sitting in cash (sidelined if crypto rallies).
A high ratio suggests possible demand saturation.

TrendsThe Trends indicator is created for trend trading and (Bitsgap) crypto bots of crypto assets over longer time periods.
Works best for 4h, Daily and Weekly candles (even Monthly), but unsuitable for hourly candles and day trading.
This indicator shows you if a crypto pair is in a Bear, Bull or Sideways market.
The idea is to simplify decision making when to sell or buy, or what pairs to use with trading bots.
Stick to the rule of not having bots in a Bear trend!
- Blue = Bull trend
- Red = Bear trend
- Green = Sideways trend - which can be profitable with trading bots

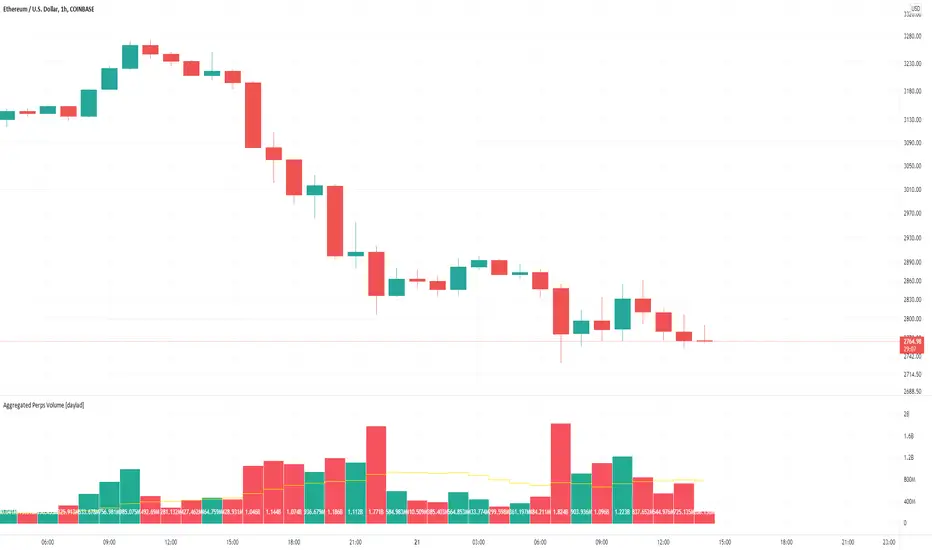
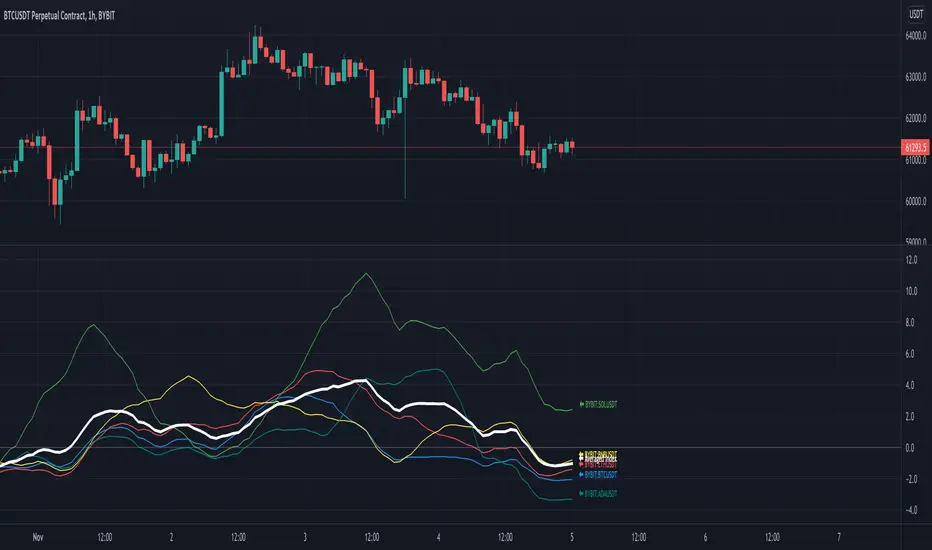
Aggregated Perps Volume [daylad]Same thing as my aggregated spot volume indicator, but for crypto perpetual futures contracts ().
Works with any crypto chart! No need to manually update symbols, this indicator will detect if there is a matching symbol and add it automatically!
The price labels display the total volume per bar in USD.
Pulls data for the following pairs (when available):
BINANCE: + base_symbol + PERP
BINANCE: + base_symbol + BUSDPERP
BINANCE: + base_symbol + USDTPERP
OKEX: + base_symbol + USDTPERP
OKEX: + base_symbol + PERP
FTX: + base_symbol + PERP
PHEMEX: + base_symbol + USD
BYBIT: + base_symbol + USD
BYBIT: + base_symbol + USDT
DERIBIT: + base_symbol + PERP
HUOBI: + base_symbol + PERP
BTSE: + base_symbol + PFC
EXAMPLE -- If you're looking at the COINBASE:SOLUSD chart the indicator will automatically aggregate the volume from BINANCE:SOLPERP, FTX:SOLPERP...etc... BYBIT:SOLUSDT...etc... BTSE:SOLPFC. If an exchange does not have a corresponding pair, then that pair returns 0 and does not add to the total.
If you have any questions feel free to ask. Happy trading!
Spread CRYPTO USDT VS PERPSimple spread script.
Calculate the difference between USDT and USDTPERP for major exchanges.
For use only with USDT charts
Works with all crypto if a future contract exists.
Upcoming updates

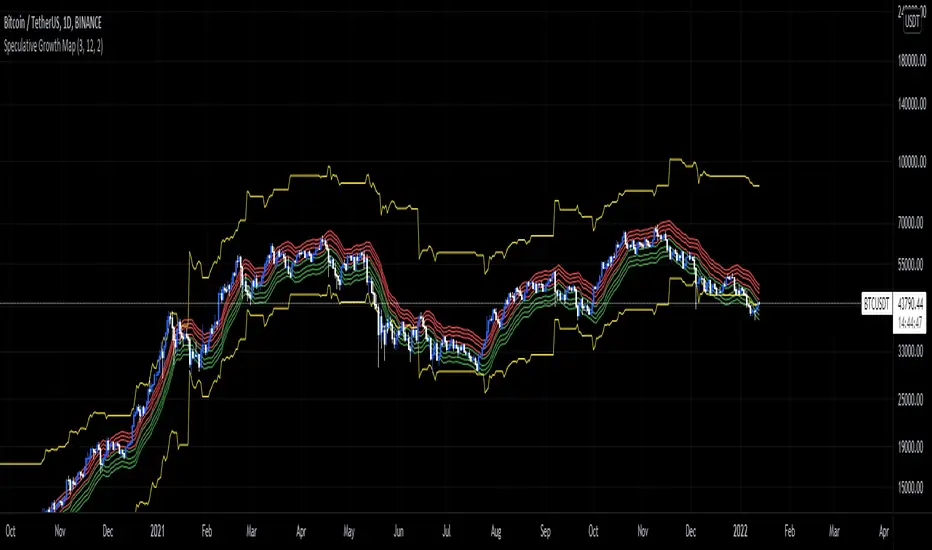
Speculative Growth Map (FOR BITCOIN)With the ever-increasing volatility flooding the cryptocurrency markets how do you ever know which side of the coin do you lie on in your investments?
The Speculative Growth Map, SGM, aims to show investors whether they are buying into the hype or actually getting a good deal on their purchase. This indicator works by working out the growth of the asset divided into eight major sections and two extreme scenarios. The first four lines, indicated by red. show that if the market enters into that area you should not be purchasing any more assets for that market as the market has entered into optimized growth. The next four lines, in green, indicate that you should be looking into purchasing the asset as it has entered a dip or a pullback. Next up, the yellow lines, indicate an extreme growth or extreme pullbacks. If the market comes close to either of these, it indicates major price action is about to occur.
How does it actually work?
It's pretty simple.
The SGM indicator works by creating EMAs of the close multiplied by 1%, 5%, 7.5%, and 10% growths for the hodl region in red. Vice Versa, EMAs of -1%, -5%, -7.5%, and -10% growth to indicate it's time to buy the asset. The yellow lines essentially mark out the bottom and the tops whenever the price goes below and above the buy and hodl region and then separates them into two but similar lines for the top and the bottom.
TFO + ATR Strategy with Trailing Stop LossThis strategy is an experiment to learn what happens when The Trend Flex Oscillator (by Dr. John Ehlers) is used in conjunction with a volatility indicator like ATR. It was designed with cryptocurrency trading in mind.
The way I coded this experiment makes it unsuitable for bear market conditions.
When applied to a bull market, this trend-following strategy will open long positions when oversold price action appear to be reversing. It will typically close a position within a few days unless it gets caught in a bear market, in which case it holds on for dear life. I have tried to make back-testing very simple, but you should never trust it. It's merely and interesting tool for adjusting the many parameters that I've made editable in the configuration window. Those values include the ATR and TFO parameters, as well as setting a trailing stop loss. When closing a position, the strategy can optionally be told to ignore the trend analysis and only obey the trailing stop loss value. I've made an attempt to allow the user to define the minimum profit necessary to allow the strategy to close all all positions. In my observations, the 2H candlestick charts seem to produce the best results, although the parameters of the strategy could theoretically be adjusted to suit other time periods.
In summary...
This strategy has a bias for HODL (Holds on to Losses) meaning that it provides NO STOP LOSS protection!
Also note that the default behavior is designed for up to 15 open long orders, and executes one order to close them all at once.
Opening a long position is predicated on The Trend Flex Oscillator (TFO) rising after being oversold, and ATR above a certain volatility threshold.
Closing a long is handled either by TFO showing overbought while above a certain ATR level, or the Trailing Stop Loss. Pick one or both.
If the strategy is allowed to sell before a Trailing Stop Loss is triggered, you can set a "must exceed %". Do not mistake this for a stop loss.
Short positions are not supported in this version. Back-testing should NEVER be considered an accurate representation of actual trading results.
// portions © allanster (date window code)
// portions © Dr. John Ehlers (Trend Flex Oscillator)
This code is provided for educational purposes only. The results of this strategy should not be considered investment advice.
The user of this script acknowledges that it can result in serious financial loss when used as a trading tool

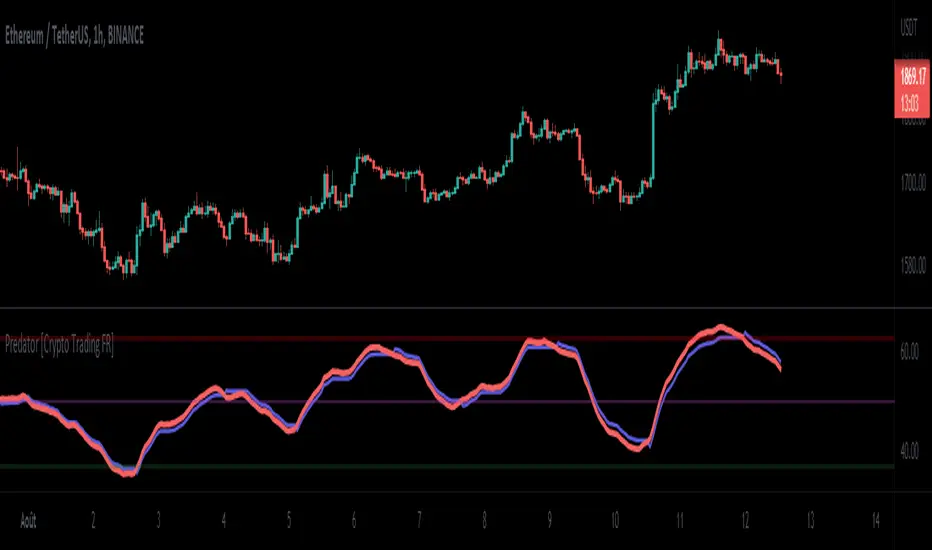
Predator [Crypto Trading FR]The Predator indicator is an oscillation indicator based on a complex mathematical equation that draws two lines, a fast and a slow one. Having two oscillating lines allows for crossovers between fast and slow lines, which can be used as confirmation of a slight trend bias.
Another advantage of the Predator indicator is the 50% Line. This could be added as another filter for trading rules. Having the lines above the 50% Predator line indicates that the price is on an uptrend while the lines below the 50% line indicates that the price is on a downtrend.
In this way, the algorithm can serve as a trend filter. For example, long trades can only be taken when values are above 50, while short trades require values below 50.
When the Predator line (orange) crosses above the slow trailing line, it indicates short-term momentum is to the upside, and long trades may be taken. Conversely, when the smoothed RSI crosses below the slow trailing line, short-term momentum is to the downside, and shorts may be more appropriate.
The indicator rarely generates false alarms and has virtually no lag, which makes it invulnerable both during periods of increased volatility and during flats with wide amplitude. Larger timeframes deserve special attention, as you can catch a very strong movement.
Summarizing, we should note that the Predator indicator does not raise any problems, it can be useful for both the beginners who just set foot on the way to learn trading and experienced traders as an additional method or as a signal module.
Trendalix EntriesThis script is made to simplify the analysis of trends. It changes the mas based on whether you're looking at stocks or crypto. As these 2 markets currently move differently, they need a slightly different approach.
Crypto trends:
Can move much faster than stocks. Ideally the price should be bouncing above the williams alligators (about the 20-30 MAs).
Stocks:
These swing more than crypto so you need to get deep into these swing to be buying at the bottom of a move. The MAs are much larger, between the 50ma and 400ma. It's much more important here that the slower MAs are strong, i.e 200ma is above the 400ma, than it is that the faster MAs are okay.
For stocks an entry and stop line is drawn. These are only visible when the market is sufficiently in a pullback.

Position size FX and CryptoThis indicator I am using to calculate the position size to order for Forex and Crypto Future

Swing Multi Moving Averages Crypto and Stocks StrategySimple and efficient multi moving average strategy combined with risk management and time condition.
Indicators/ Tools used
Multi selection moving average type like SMA , EMA , SMMA , VWMA , VIDYA , FRAMA , T3 and much more
Limit 1 entry max per week, entry on monday exit on sunday or risk management tp/sl.
Rules for entry:
LONG:Close of the candle cross above the moving average while the previous close was below. All of this is happening during monday session.
SHORT:Close of the candle cross below the moving average while the previous close was above. All of this is happening during monday session.
Rules for exit:
We exit either on sunday or if we reach tp/sl levels.
Observations:
I recommend use the strategy 2 types, one for long and another for short, using different parameters since long and short movements behave differently.
For example for long we can use a shorter moving average longth and a higher tp/sl while for short we can use a bigger moving average length and a smaller tp/sl
If you have any questions let me know !

WaveTecs StrategyWelcome to the Backtesting version of "WaveTecs Strategy", the indicator itself is an invite-only script called "WaveTecs Indicator" on TradingView.
WaveTecs Strategy
WaveTecs is a Strategy that combines Wave Trend Oscillator and verifies wave momentum by using RSI and Stochastic Oscillator Values.
What is Wave Trend?
One of the most effective indicators in identifying swings is the Wave Trend indicator. Wave Trend plots waves using highs and lows between an upper band and a lower band. It looks for the opening and closing of a new wave trend movement as well as overbought and oversold areas.
How does this modified strategy work?
By using RSI and Stochastic values we are able to verify Wave inflection points to determine if there is a suitable amount of momentum to ride the swing and make profitable trades. Positions are taken or closed based on the rising or falling momentum.
Each value input can be adjusted to best suit the type of market you are trading in. By using the strategy we can optimize these value inputs to yield greater net profits. I have found the RSI and Stochastic values hugely impact entries and exits regarding trades.
For Long conditions:
- RSI & Stochastic needs to be increasing and moving out of oversold conditions to show positive momentum.
- Falling momentum results in a sell signal. I have found RSI less than 65 to be sufficient in most markets however this can be adjusted at any time to yield different results depending on your comfort level.
For Short conditions:
- RSI & Stochastic needs to be decreasing and moving out of overbought conditions to show negative momentum.
Generally, Wave Trend Strategies only take trades that are outside of the bands. This strategy allows trades inside and outside of the bands, which can be selected under the input section title "Aggressive Trading". Trading in this mode is more frequent as signals are often. Due to volatility in crypto markets, I have defaulted the source for Wave Trend waves to be Open/High/Low/Close Average which yielded great results. High/Low/Close average works very well for all other securities, and can easily be adjusted through the drop-down menu inside the inputs.
Works for all types of markets. Parameters can be adjusted but not required as indicator values are standard in the industry.
The default parameters are set to those typically used in the markets currently. However, I have found that if you adjust you to adjust the parameters based on your asset and time frame desired you will yield different results.
----------------
For example:
----------------
ETHUSDT - 4 HR, results are shown below
Wave Trend Parameters:
Aggressive Trading: Yes
Channel Length: 12
Average Length: 24
Overbought Top: 90
Overbought Bottom: 75
Oversold Bottom: -90
Oversold Top: -55
Source: hlc3
Strategy Type:
Trade Direction: Long Only
Stochastic Inputs:
Stoch Length: 18
Smoother %K: 5
Moving Average %K: 4
%K Lower Limit: 21
%K Upper Limit: 80
%K Crossunder Sell: 80
Relative Strength Index Inputs:
RSI Lower Limit: 30
RSI Upper Limit: 70
RSI Sell Value: 68
==================
WaveTecs Features
==================
Profitable Trading Strategy;
Aggressive Trading feature for more trades, with earlier entries and exits;
Customizable inputs to fine-tune your trades;
Buy & Sell Alerts (Indicator Only);
Overlay indicator only to show alerts, WaveTecs Strategy needed to see Wave Trend;
Bot Integration through webhooks;
Two different strategy modes: Long Trades Only or Long & Short Trades
Adding new features & updates whenever possible.
Add both WaveTecs Indicator and WaveTecs Strategy to your chart. WaveTecs Indicator only plots Buy & Sell Alerts, whereas WaveTecs Strategy lets you see what the strategy is doing.

Scalping Trading System ALERT Crypto and StocksThis is the alert version of the strategy with the same name.
Indicators
SImple Moving Average
Exponential Moving Average
Keltner Channels
MACD Histogram
Stochastics
Rules for entry
long= Close of the candle bigger than both moving averages and close of the candle is between the top and bot levels from Keltner . At the same time the macd histogram is negative and stochastic is below 50.
short= Close of the candle smaller than both moving averages and close of the candle is between the top and bot levels from Keltner . At the same time the macd histogram is positive and stochastic is above 50.
Rules for exit
We exit when we meet an opposite reverse order.
This strategy has no risk management inside, so use it with caution !

The Oracle v3 [Redbeard]Welcome,
as the name already says, this indicator will help you to find very early long and short signals for cryptocurrencies and stocks (Didnt test Forex yet).
In the comment section below, i will post some chart examples, in which you will see, how successful the indicator works, when you follow some rules.
1. What does the indicator contain:
This one indicator contains 5 different indicators, which 4 of them are being used as "confirmation signals".
Main Line: The green/red line is a modified RSI , so trendlines are easier to draw.
Stochastic: A regular stochastic indicator.
Multi Divergences: The red/orange and green/olive colored tags with numbers in it, display divergences.
MFI: The vertical blue/purple lines, are being displayed using a MFI calculation. They simply display potential tops/bottoms.
Long/Short Tags: The yellow and blue colored tags with the text "Long/Short" in it, are being displayed by another "secret" indicator.
White vertical line: This is only a offset, so everyone who uses this indicator, knows in which area he should look for trendlines .
2. How to use the indicator:
Its very simple: Trendlines
The only thing you have to do by yourself, is to look for trendline on the "green/red" Main line and to draw them.
If the Main Line closes above a resistance trendline or closes below a support trendline AND has 1-2 additional confirmation signals, then you might have a good early entry.
The most important thing are the stop losses, because like any other indicator, it wont work to 100%. But this i will explain in the discord
3. On which timeframes does it work?
It works on any timeframe.
4. Who should use it?
People who are willing to learn, how to use the indicator.
People with some basic expirience (what is a divergence, what is a trendline)
5. Do i need more indicators?
In best case yes.
Im using 2 additional indicators, which you can use too.
6. Is there any backtest or are there any "proofs" of how good the indicators worked in the past?
Yes.
I will share some examples from the past in the comment section.

SSR - Stablecoin Supply Ratio - Bitcoin - CryptocurrencyThe Stablecoin Supply Ratio (SSR) is the ratio between Bitcoin supply and the supply of stablecoins, denominated in BTC.
When the SSR is low, the current stablecoin supply has more "buying power" to purchase BTC. It serves as a proxy for the supply/demand mechanics between BTC and USD.

SROC Crypto Index [upslidedown]The idea for this indicator is simple: Without a crypto index we want to somehow understand ROC across many assets. This will average out data across the top 5 (current) cryptos and provide a benchmark index.
I've recently been looking into momentum strategies more and how to utilize ROC as part of crypto trading. This indicator was born to fill a void as there is no great index like SPY for the crypto world.
Why would you do this? This gives a picture of overall market sentiment and allows you to move stock strategies that use an index to do things like tighten SL, take positions, move to cash, etc. into the cryptocurrency market.
The plotted line is super fat so you can plot individual lines and tell the index from the individual ticker apart. My suggestion is to pair this with a ROC or SROC for individual assets and to develop strategies from there.
WhaleCrew Crypto ArbitrageVisualizes the price difference (deviation) off BTC/ETH across multiple exchanges (Spot and/or Perpetuals)
Spot prices are represented by circles, while perpetual prices are shown as crosses.
Spot:
Binance
FTX
Bitfinex
Coinbase
Perpetuals:
Binance
FTX
Bybit
BitMEX

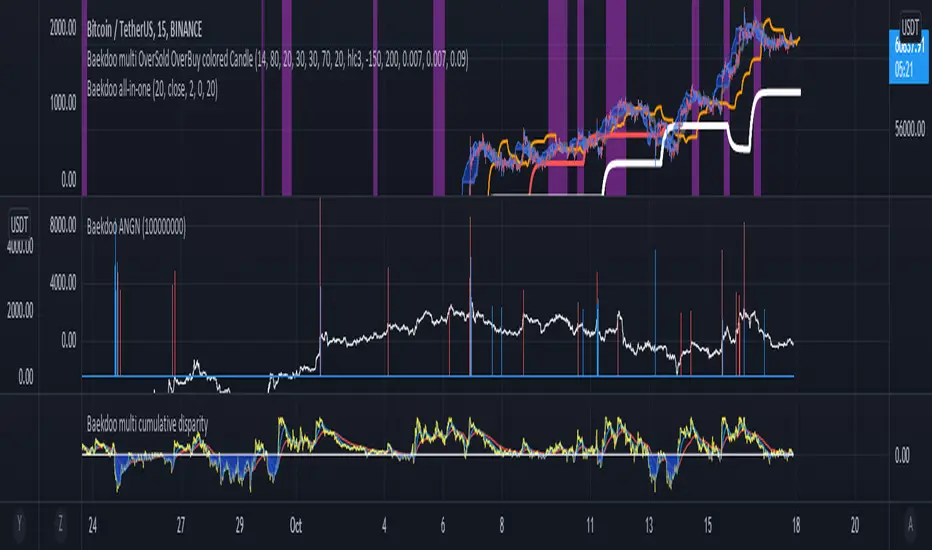
Baekdoo ANGN for cryptocurrencyHi forks,
I'm trader Baekdoosan who trading Equity from South Korea. This Baekdoo ANGN indicator plot volume when large volume trading happened.
I made this indicator for Korea stock trading. I put bars for large amount of trading happened. Let's say 1% of their market cap, then we can regarded this as very big amount of trading is going on.
But those function that drag into the chart of market cap works only on stock. so I put them into hardcoded value.
you can freely change value (since I put the variable into input, you can modify based on your needs).
And adding ANGN (An-Na-Gan-Ni?, means "are you still there? in Korean")
line for upgrade version of On Balance Volume (OBV).
OBV is very good indicator but when it has long tail and short body, it can have wrong indication of buying or selling from big whales. So ANGN with large volume indicator combination would gives you better idea for the big brothers buying or selling tracker.
hope this will help your trading on equity as well as crypto. I didn't try it on futures . Best of luck all of you. Gazua~!
BitMEX BTC Volatility IndexThis indicator displays the BitMEX BTC Volatility Index ( BVOL24H ) as an indicator and it can be compared to the VIX of the cryptocurrencies.
more information about how BVOL24H is calculated can be found here: www.bitmex.com
Symbol can be changed in the parameters

MACD Alert [All MA in one] [Smart Crypto Trade (SCT)]This code is a gift from "Smart Crypto Trade (SCT)" group
MACD indicator contains 3 EMA, I think one of the best usage of MACD is trend detection and divergences.
In our indicator, you can select the type of Moving averages that used in macd.
You can using "MACD" based on several types of moving averages including:
Exponential Moving Average ( EMA )
Volume-Weighted Moving Average ( VWMA )
Simple Moving Average ( SMA )
Weighted Moving Average ( WMA )
Exponentially Weighted Moving Average (RMA) that used in RSI
Smoothed Moving Average ( SMMA )
Arnaud Legoux Moving Average ( ALMA )
Double EMA ( DEMA )
Double SMA (DSMA)
Double WMA (DWMA)
Double RMA (DRMA)
Triple EMA ( TEMA )
Triple SMA (TSMA)
Triple WMA (TWMA)
Triple RMA (TRMA)
Linear regression curve Moving Average ( LSMA )
Variable Index Dynamic Average ( VIDYA )
Fractal Adaptive Moving Average ( FRAMA )
In other words we tried to collect all the most popular MAs in our MACD indicator.
In addition, you can use four types of alert or alarm conditions for detection LONG or SHORT positions and trends. For this, you must set an alert in alert tab and set the condition based on four defaults conditions.
Enjoy
