Boom Trading: EMA Channel StrategyVersion 1
Add EMA 50 high, low, and 200 close
Filter trend by EMA 200
Crossing by EMA 50 channel with EMA 20 fast
Tìm kiếm tập lệnh với "ema"

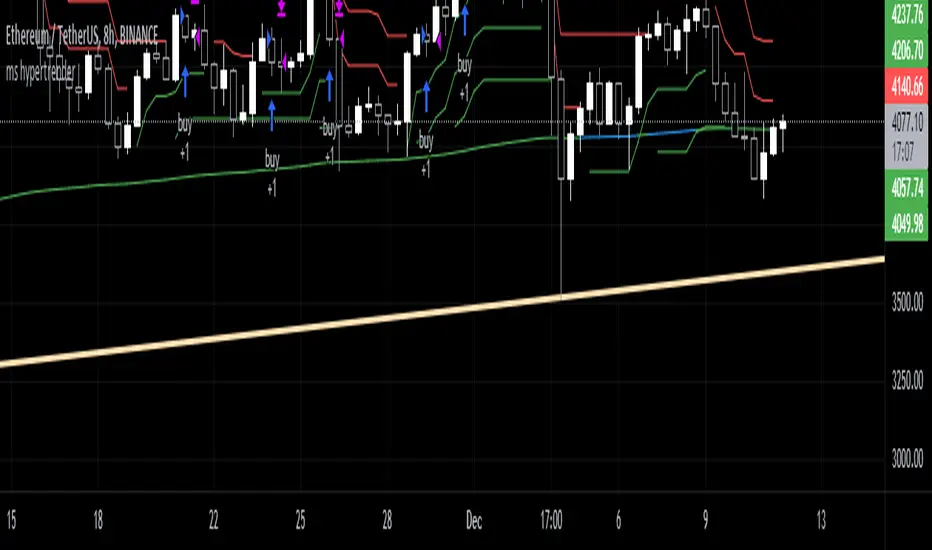
moonshot hypertrender (supertrend strategy)
This is a well-known strategy by using 3 different Supertrends and a trend-defining EMA,
feel free to play around with the settings, a backtest on 8h ETHUSDT pair brought some good results using
the 233EMA and investing 75% of a 10k start capital.
The idea is to have at least 2 Supertrends going green above the trend-EMA to go into a long position. The exit
will be triggered if 2 Supertrends change to red (idea: 1 super trend in red could initialize a take profit).
Taking shorts works vice versa.
The EMA shows in green for uptrends and in red for downtrends, if it is blue (ranging market) no Signal will be taken because
the 3 Supertrends are not all above or below the trendline(EMA).
I heard about this strategy on youtube but I can't get the promised 60% win-rate ;)
any suggestions to improve it are welcome
Hope you find it useful and it would be nice to get your feedback
-theasgard-
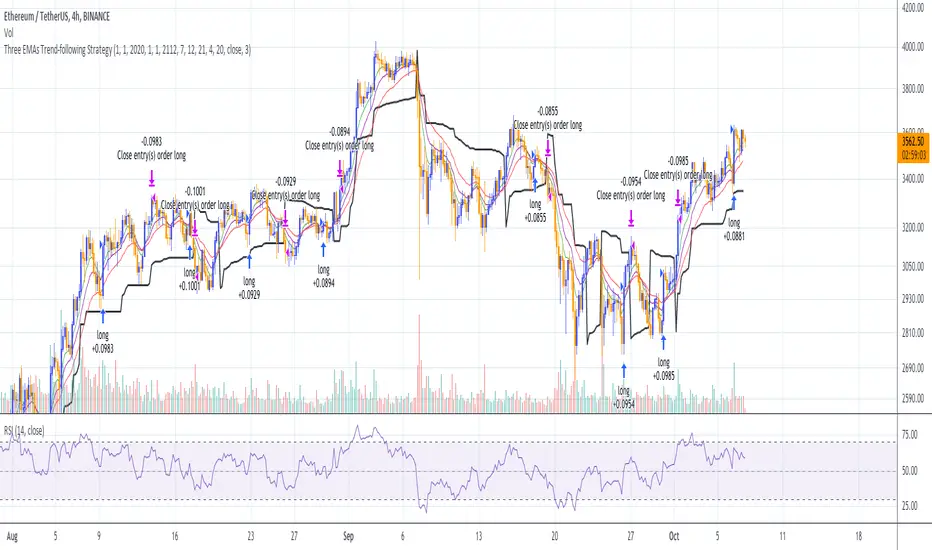
Three EMAs Trend-following Strategy (by Coinrule)Trend-following strategies are great because they give you the peace of mind that you're trading in line with the market.
However, by definition, you're always following . That means you're always a bit later than your want to be. The main challenges such strategies face are:
Confirming that there is a trend
Following the trend, hopefully, early enough to catch the majority of the move
Hopping off the trade when it seems to have run its course
This EMA Trend-following strategy attempts to address such challenges while allowing for a dynamic stop loss.
ENTRY
The trading system requires three crossovers on the same candle to confirm that a new trend is beginning:
Price crossing over EMA 7
Price crossing over EMA 14
Price crossing over EMA 21
The first benefit of using all three crossovers is to reduce false signals. The second benefit is that you know that a strong trend is likely to develop relatively soon, with the help of the fast setup of the three EMAs.
EXIT
The strategy comes with a fixed take profit and a volatility stop, which acts as a trailing stop to adapt to the trend's strength. That helps you get out of the way as soon as market conditions change. Depending on your long term confidence in the asset, you can edit the fixed take profit to be more conservative or aggressive.
The position is closed when:
The price increases by 4%
The price crosses below the volatility stop.
The best time frame for this strategy based on our backtest is the 4-hr. Shorter timeframes can also work well, although they exhibit larger volatility in their returns. In general, this approach suits medium timeframes. A trading fee of 0.1% is taken into account. The fee is aligned to the base fee applied on Binance, which is the largest cryptocurrency exchange.
You can execute this strategy on your favourite exchange at coinrule.com
PSAR + MACD + EMA StrategyIndicators used:
MACD
EMA (default value 200)
PSAR
Entry Conditions for Long
- Price must be above the EMA 200
- PSAR dot below price
- Crossover on the MACD
Entry Conditions for Short
- Price must be below the EMA 200
- PSAR dot above price
- Cross under on the MACD
Stop Loss & Take Proft
Stop loss is set to go on the first formed PSAR dot from the entry
The take profit by default is set to 1.1 of the risk, this is changeable in the settings
Settings
- There is an option to change the backtest range,
- Options to customise MACD entry conditions
- Options to change the MACD, PSAR and EMA inputs
- Options to Plot Take profit/Stop loss as well as the other indicators

Know Sure Thing + EMA by @DaviddTechFor this strategy I used 2 indicators
* Know Sure Thing
* EMA for Trend Direction.
Long :
* EMA is below Price
* When the Know Sure Thing line crosses above the signal line
* Both KST and signal lines are below 0
Short :
* EMA is above Price
* When the Know Sure Thing line crosses below the signal line
* Both KST and signal lines are above 0
WARNING:
- For purpose educate only - My mission is to debunk fake strategies with code to find THE ONE.
- Plots EMAs and other values on chart.
- This script to change bars colors.

PSAR + MACD + 200 EMA by @DaviddTechIndicators used for this
200 EMA
MACD
PSAR
To take a Long Entry
* Price above the 200 EMA
* PSAR long entry signal
* Both MACD and signal line below 0
* MACD crossover
To take a Short Entry
* Price below the 200 EMA
* PSAR short entry signal
* Both MACD and signal line above 0
* MACD crossunder
WARNING:
- For purpose educate only - My mission is to debunk fake strategies with code to find THE ONE.
- Plots EMAs and other values on chart.
- This script to change bars colors.

3EMA 5/13/26 StrategyBuy signal generated when following conditions are met
1. EMA 5 crossess EMA 13 and 26 from bellow
2. RSI is crossing 60 from below
stoploss- last 2 candle below
Sell signal generated when following conditions are met
1. EMA 5 crossess EMA 13 and 26 from above
2. RSI is crossing 40 from above
stoploss- last 2 candle above

MACD Crossover trend strategy, Long and ShortHey everybody,
This is my first strategy and script I wrote mostly myself. There's tons of content out there to learn how to code in Pinescript and it's exactly what I wanted and needed in this time of my life.
In any case, I made a rather simple MACD crossover strategy that only takes trades in the direction of both EMA and SMA (there are inputs to change the length of the moving averages and lots of other stuff too).
If the MACD line crosses upwards on the signal line, while above the zero point of the histogram and the price is above EMA + SMA , it's a long signal.
If the MACD line cosses downards on the signal line, while below zero on the histogram and the price is below EMA + SMA , it's a short signal.
There are a lot of default variables that make no sense, for basically any symbol you're going to be looking at. You're going to have to adjust the EMA , SMA , backtest date, take profit, stop loss and all that good stuff yourself to find decently profitable parameters.
I made this myself because I couldn't really find a strategy out there that allowed for so much customizing and it's an easy way to get started in Pinescript.
If you have any suggestions, tips or you see a flatout mistake in my code, please let me know. I'm still learning, everyday and I'm enjoying every second of it.

Crypto BOT lower timeframesThis is a crypto bot designed for lower time frames.
Its made of 2 EMA, one fast and one slower . They are combined together with Stochastic, MACD and price action patterns.
For entries we have multiple conditions :
First we check if one of our last 4 closed candles crossed above or below the faster EMA. After that for long, we check that last close is above the fast EMA, that the fast ema is above the slower EMA, at the same time that the histogram from MACD is positive and that we have crossover with the oversold line on stochastic. For the short , the opposite of long.
For exit we have TP/SL mechanic based on price % movement, in this example if the price moved 10% from the initial position it will exit.

Ichimoku Kinko Hyo Strategy+ EMA + 3ATRThis trading strategy uses combination of the Ichimoku Kinko Hyo system with Fibonacci numbers based 13/21/55 exponential moving average ( EMA ) crossover, giving good results in various trending assets !
Also has the Trend-following indicator combining SuperTrend with Chiku breakout from Ichimoku is added in order to confirm trend pattern.
The Ichimoku Kinko Hyo system includes five kinds of signal, of which this strategy uses the most recent of ones i.e. Tenkan Sen / Kijun Sen Cross and price crosses the Kijun Sen. As the Chikou Span, Senkou Span A and Senkou Span B are shifted into the past/future.
The Tenkan Sen, also known as the Turning or Conversion line, is a moving average of the highest high and lowest low over the last 9 periods in this strategy.
The Kijun Sen, also known as the Standard or Base line, is a moving average of the highest high and lowest low over the last 26 periods in this strategy.
The Chikou Span, also known as the Lagging line, is the closing price plotted 26 periods behind in this strategy.
The Senkou Span A, also known as the 1st leading line, is a moving average of the Tenkan Sen and Kijun Sen and is plotted 26 periods ahead in this strategy.
The Senkou Span B, also known as the 2nd leading line, is a moving average of the highest high and lowest low over the last 52 trading days is plotted 26 periods ahead in this strategy.
EMA is quicker to react to the current market price is because EMA gives more importance to the most recent data points. This helps the trader to take quicker trading decisions. Just used the laws of nature for EMA numbers: taken from Fibonacci sequence numbers 13/21/55
A SuperTrend employs ATR values to calculate the indicator values. The SuperTrend indicator combined with Chiku breakout from Ichimoku and plotted. The indicator line changes its color between green and red based on the price momentum in the underlying.
Daytrade strategy RSI CCI EMA 4/8This strategy is designed for daytrade charts.
Its made from
EMA 4 / EMA 8 to check for crosses
RSI levels for overbough/oversold
CCI levels
For entry, we check first if the ema 4 crossed ema 8
Secondly we confirm by checking the level of RSI level
Finally we confirm with CCI level
If all of them are on the same page we enter.
For exit we have a fixed pip points system for TP/SL
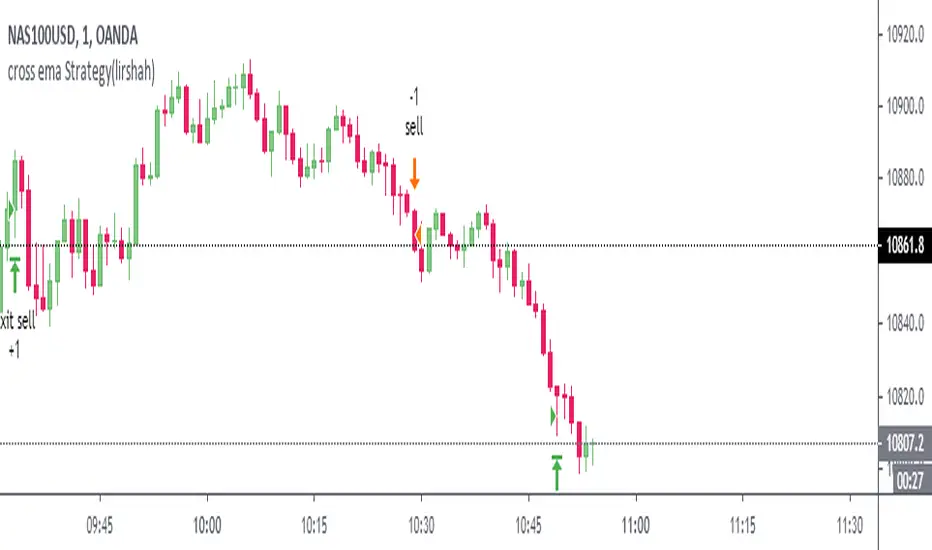
cross ema Strategy(lirshah)cross ema strategy has been written based on ema crossovers,
this strategy trigger buy signal when a fast ema signal crosses the slow ema.
the advantage of this strategy is that, the order will be pending untill it hit one of the emas and then we will have a trade open.
the next goodness of this strategy is that, it has a none- repainting stop loss.
so the strategy defined intrabar stop loss enstead of fixed stoploss.
the strategy have the capacity to work with 10 pip loss,
so it means more profits and lower draw down.
the below overview is results of US30 wall street index on 5 min chart.
in order to access scripts contact me directly.
VEST [mcristianrios] StrategyVEST is the intelectual part of two indicators to enter and exit Long or Short trades with ease.
The core functionality will not be fully explained but why VEST?
Volume: There are three configurations base on Volume in order to operate in favor of the market.
Ema vs Ema: There are three configurations base on two EMAs crossing each other.
Super Trend: If trend goes Long why not? Volume and EMA alone are not enough and it works as a filter to avoid not favorable trades. Factor and ATR Length are configurable.
What else do you I to offer? Oh yeah!
Going with the idea of managing risk VEST can enable up to 7 TP signals. So, if profit pips is 100 at 1:1 and take profit 2.5:1 is enabled we'll have: TP: 250pips and SL: 100pips
What markets can this indicator be used on?
Only Forex.
What time-frames can this indicator be used on?
This indicator can be used from 5 minutes up to 37 minutes.
Does Study Indicator repaint?
No
-- It should be configured to send alerts Once Per Bar Close
* Besides that the only functionality of the Study Indicator is to send Alerts *
Does the study indicator fill SL Price and TP Price on alerts?
Yes, it certainly does having one alert per Take Profit.
So can I automate this?
Of course yes! And alert messages are set by default to work with TradingConnector.
As a preview suggested configuration for a Long 2.5:1 operation looks like: long tradesymbol={{ticker}} slprice={{plot("SLLong")}} tpprice={{plot("TPLong25")}}
-----------------------------------------------------------------------------------------
This is not a free to use indicator. Get in touch with me if you would like access to both indicators for a free trial before deciding on a paid access for a period of your choice.
-----------------------------------------------------------------------------------------

High Low Cloud Strategy BacktestingHigh Low Cloud Strategy Backtesting: this is a breakout and reversal previous trend strategy
A. Indicator: row 6 to row 17
1. Fast Cloud
Upper line = ema of High with 60 periods
Lower line = ema of Low with 60 periods
1. Slow Cloud
Upper line = ema of High with 240 periods
Lower line = ema of Low with 240 periods
B. Strategy Backtesting
1. Chart IDC, Time frame: M30
2. Long condition: row 20 to row 34
a. Entry =
* Upper line of Fast Cloud below Lower line of Slow Cloud
* Price crossover Upper line of Slow Cloud
b. Stoploss =
* Price crossunder bottom of 240 periods (~ bottom of 5 days)
c. Takeprofit =
* Lower line of Fast Cloud above Upper line of Slow Cloud
* Price crossunder Lower line of Fast Cloud
3. Short condition: row 37 to row 49
a. Entry =
* Lower line of Fast Cloud above Upper line of Slow Cloud
* Price crossunder Lower line of Slow Cloud
b. Stoploss =
* Price crossover peak of 240 periods (~ bottom of 5 days)
c. Takeprofit =
* Upper line of Fast Cloud below Lower line of Slow Cloud
* Price crossover Upper line of Fast Cloud

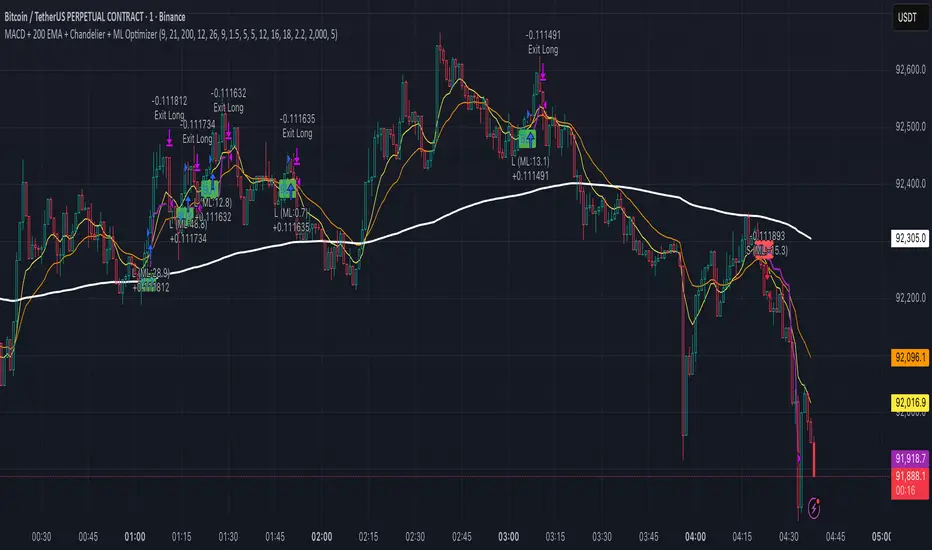
MACD + 200 EMA + Chandelier + ML OptimizerNeural MACD Trend Strategy
This script modernizes a classic high-probability trend strategy by integrating Machine Learning and dynamic risk management. It is built on the foundation of the 9, 21, and 200 EMAs with MACD execution, designed to automate the workflow of trend traders.
Key Features:
1. Core Logic: Trades are executed on MACD crosses, but only when aligned with the long-term trend (200 EMA). An optional setting enforces a simultaneous 9/21 EMA cross for high-momentum confirmation.
2. Machine Learning Optimizer: A K-Nearest Neighbors (KNN) algorithm runs in the background, analyzing RSI, CCI, and ROC. It compares the current setup to the last 1,000 bars of history; if the historical probability is negative, the ML blocks the trade to save capital.
3. Range Filter: Uses ADX to detect choppy markets. If the market is ranging (ADX < 20), the background turns gray and trading is paused.
4. Advanced Exits: Automatically calculates Stop Losses based on recent Swing Highs/Lows. Includes a Chandelier Exit (ATR Trailing Stop) to lock in profits dynamically. You can choose between fixed Reward-to-Risk targets (e.g., 1.5x) or disable targets to ride the trend until the trailing stop is hit.
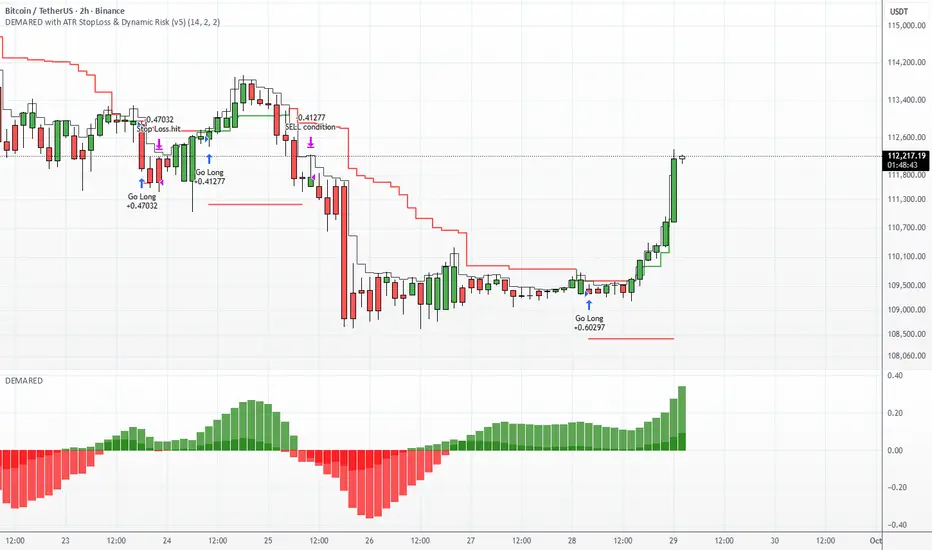
DEMARED with ATR StopLoss & Dynamic Risk (v5)DEMARED with ATR StopLoss & Dynamic Risk
This strategy combines Double Exponential Moving Averages (DEMA) with EMA and Donchian midline filters to capture trend-following signals. A long entry is triggered when both DEMA pairs are aligned bullishly, price is above EMA, and above the Donchian midpoint. Exits occur on opposite signals or when the ATR-based stop loss is hit.
Key features:
ATR Stop Loss: dynamic stop based on ATR with user-defined multiplier.
Dynamic Risk Management: position size is automatically calculated based on account equity and risk percentage.
Visualization: plots stop loss, EMA, Donchian midline, and optional bar coloring.
Flexible Display: toggle all indicator visuals on/off with a single input.
The goal is to provide a trend-following system with controlled risk and adaptability across different markets and timeframes.
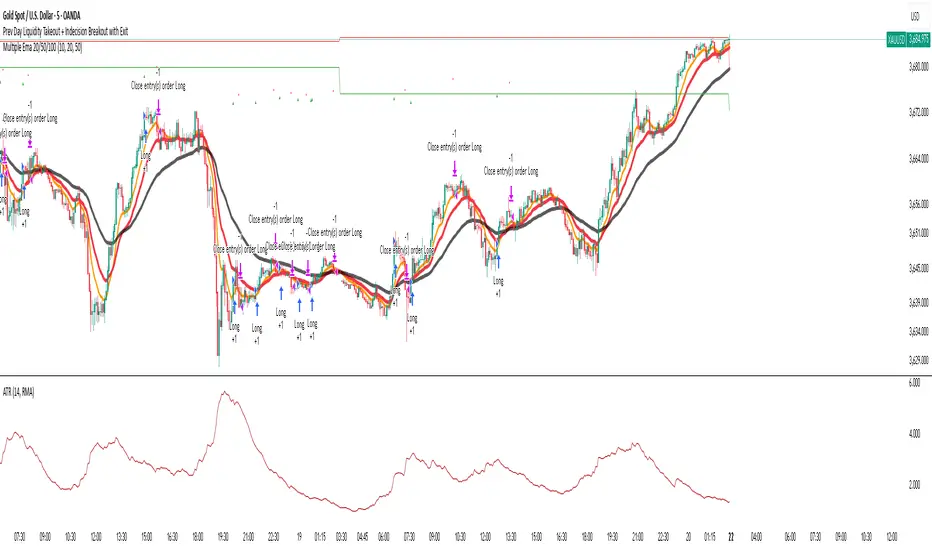
Indecision Candle with 2 Candle Confirmation + 500 EMA - parthibIndecision Candle with 2 Candle Confirmation + 500 EMA
Indecision Candle with 2 Candle Confirmation + 500 EMA
Indecision Candle with 2 Candle Confirmation + 500 EMAIndecision Candle with 2 Candle Confirmation + 500 EMAIndecision Candle with 2 Candle Confirmation + 500 EMA
QZ Trend (Crypto Edition) v1.1a: Donchian, EMA, ATR, Liquidity/FThe "QZ Trend (Crypto Edition)" is a rules-based trend-following breakout strategy for crypto spot or perpetual contracts, focusing on following trends, prioritizing risk control, seeking small losses and big wins, and trading only when advantageous.
Key mechanisms include:
- Market filters: Screen favorable conditions via ADX (trend strength), dollar volume (liquidity), funding fee windows, session/weekend restrictions, and spot-long-only settings.
- Signals & entries: Based on price position relative to EMA and EMA trends, combined with breaking Donchian channel extremes (with ATR ratio confirmation), plus single-position rules and post-exit cooldowns.
- Position sizing: Calculate positions by fixed risk percentage; initial stop-loss is ATR-based, complying with exchange min/max lot requirements.
- Exits & risk management: Include initial stop-loss, trailing stop (tightens only), break-even rule (stop moves to entry when target floating profit is hit), time-based exit, and post-exit cooldowns.
- Pyramiding: Add positions only when profitable with favorable momentum, requiring ATR-based spacing; add size is a fraction of the base position, with layers sharing stop logic but having unique order IDs.
Charts display EMA, Donchian channels, current stop lines, and highlight low ADX, avoidable funding windows, and low-liquidity periods.
Recommend starting with 4H or 1D timeframes, with typical parameters varying by cycle. Liquidity settings differ by token; perpetuals should enable funding window filters, while spot requires "long-only" and matching fees. The strategy performs well in trends with quick stop-losses but faces whipsaws in ranges (filters mitigate but don’t eliminate noise). Share your symbol and timeframe for tailored parameters.

RSI Momentum Trend MM with Risk Per Trade [MTF]This is a comprehensive and highly customizable trend-following strategy based on RSI momentum. The core logic identifies strong directional moves when the RSI crosses user-defined thresholds, combined with an EMA trend confirmation. It is designed for traders who want granular control over their strategy's parameters, from signal generation to risk management and exit logic.
This script evolves a simple concept into a powerful backtesting tool, allowing you to test various money management and trade management theories across different timeframes.
Key Features
- RSI Momentum Signals: Uses RSI crosses above a "Positive" level or below a "Negative" level to generate trend signals. An EMA filter ensures entries align with the immediate trend.
- Multi-Timeframe (MTF) Analysis: The core RSI and EMA signals can be calculated on a higher timeframe (e.g., using 4H signals to trade on a 1H chart) to align trades with the larger trend. This feature helps to reduce noise and improve signal quality.
Advanced Money Management
- Risk per Trade %: Calculate position size based on a fixed percentage of equity you want to risk per trade.
- Full Equity: A more aggressive option to open each position with 100% of the available strategy equity.
Flexible Exit Logic: Choose from three distinct exit strategies to match your trading style
- Percentage (%) Based: Set a fixed Stop Loss and Take Profit as a percentage of the entry price.
- ATR Multiplier: Base your Stop Loss and Take Profit on the Average True Range (ATR), making your exits adaptive to market volatility.
- Trend Reversal: A true trend-following mode. A long position is held until an opposite "Negative" signal appears, and a short position is held until a "Positive" signal appears. This allows you to "let your winners run."
Backtest Date Range Filter: Easily configure a start and end date to backtest the strategy's performance during specific market periods (e.g., bull markets, bear markets, or high-volatility periods).
How to Use
RSI Settings
- Higher Timeframe: Set the timeframe for signal calculation. This must be higher than your chart's timeframe.
- RSI Length, Positive above, Negative below: Configure the core parameters for the RSI signals.
Money Management
Position Sizing Mode
- Choose "Risk per Trade" to use the Risk per Trade (%) input for precise risk control.
- Choose "Full Equity" to use 100% of your capital for each trade.
- Risk per Trade (%): Define the percentage of your equity to risk on a single trade (only works with the corresponding sizing mode).
SL/TP Calculation Mode
Select your preferred exit method from the dropdown. The strategy will automatically use the relevant inputs (e.g., % values, ATR Multiplier values, or the trend reversal logic).
Backtest Period Settings
Use the Start Date and End Date inputs to isolate a specific period for your backtest analysis.
License & Disclaimer
© waranyu.trkm — MIT License.
This script is for educational purposes only and should not be considered financial advice. Trading involves significant risk, and past performance is not indicative of future results. Always conduct your own research and risk assessment before making any trading decisions.

LANZ Strategy 5.0 [Backtest]🔷 LANZ Strategy 5.0 — Rule-Based BUY Logic with Time Filter, Session Limits and Auto SL/TP Execution
This is the backtest version of LANZ Strategy 5.0, built as a strategy script to evaluate real performance under fixed intraday conditions. It automatically places BUY and SELL trades based on structured candle confirmation, EMA trend alignment, and session-based filters. The system simulates real-time execution with precise Stop Loss and Take Profit levels.
📌 Built for traders seeking to simulate clean intraday logic with fully automated entries and performance metrics.
🧠 Core Logic & Strategy Conditions
✅ BUY Signal Conditions:
Price is above the EMA200
The last 3 candles are bullish (close > open)
The signal occurs within the defined session window (NY time)
Daily trade limit has not been exceeded
If all are true, a BUY order is executed at market, with SL and TP set immediately.
🔻 SELL Signal Conditions (Optional):
Exactly inverse to BUY (below EMA + 3 bearish candles). Disabled by default.
🕐 Operational Time Filter (New York Time)
You can fully customize your intraday window:
Start Time: e.g., 01:15 NY
End Time: e.g., 16:00 NY
The system evaluates signals only within this range, even across midnight if configured.
🔁 Trade Management System
One trade at a time per signal
Trades include a Stop Loss (SL) and Take Profit (TP) based on pip distance
Trade result is calculated automatically
Each signal is shown with a triangle marker (BUY only, by default)
🧪 Backtest Accuracy
This version uses:
strategy.order() for entries
strategy.exit() for SL and TP
strategy.close_all() at the configured manual closing time
This ensures realistic behavior in the TradingView strategy tester.
⚙️ Flow Summary (Step-by-Step)
On every bar, check:
Is the time within the operational session?
Is the price above the EMA?
Are the last 3 candles bullish?
If conditions met → A BUY trade is opened:
SL = entry – X pips
TP = entry + Y pips
Trade closes:
If SL or TP is hit
Or at the configured manual close time (e.g., 16:00 NY)
📊 Settings Overview
Timeframe: 1-hour (ideal)
SL/TP: Configurable in pips
Max trades/day: User-defined (default = 99 = unlimited)
Manual close: Adjustable by time
Entry type: Market (not limit)
Visuals: Plotshape triangle for BUY entry
👨💻 Credits:
💡 Developed by: LANZ
🧠 Strategy logic & execution: LANZ
✅ Designed for: Clean backtesting, clarity in execution, and intraday logic simulation

AutoFib Breakout Strategy for Uptrend AssetsThis trading strategy is designed to help you catch powerful upward moves on assets that are in a long-term uptrend, such as Gold (XAUUSD). It uses a popular technical tool called the Fibonacci Extension, combined with a trend filter and a risk-managed exit system.
✅ When to Use This Strategy
• Works best on higher timeframes: Daily (1D), 3-Day (3D), or Weekly (W).
• Best used on uptrending assets like Gold.
• Designed for swing trading – holding trades from a few days to weeks.
📊 How It Works
1. Find the Trend
We only want to trade in the direction of the trend.
• The strategy uses the 200-period EMA (Exponential Moving Average) to identify if the market is in an uptrend.
• If the price is above the 200 EMA, we consider it an uptrend and allow long trades.
2. Identify Breakout Levels
• The strategy detects recent high and low pivot points to draw Fibonacci extension levels.
• It focuses on the 1.618 Fibonacci level, which is often a target in strong trends.
• When the price breaks above this level in an uptrend, it signals a potential momentum breakout – a good time to buy.
3. Enter a Trade
• The strategy enters a long (buy) position when the price closes above the 1.618 Fibonacci level and the market is in an uptrend (above the 200 EMA).
4. Manage Risk Automatically
• The trade includes a stop-loss set to 1x the ATR (Average True Range) below the entry price – this protects against sudden drops.
• It sets a take-profit at 3x the ATR above the entry – aiming for higher rewards than risks.
⚠️ Important Notes
• 📈 Higher Timeframes Preferred: This strategy works best on Daily (D), 3-Day (3D), and Weekly (W) charts, especially on Gold (XAUUSD).
• 🧪 Not for Deep Backtesting: Due to the nature of how pivot points and Fib levels are calculated, this strategy may not perform well in backtesting simulations (because the historical calculations can shift). It is better used for live analysis and forward testing.

MACD + RSI + EMA + BB + ATR Day Trading StrategyEntry Conditions and Signals
The strategy implements a multi-layered filtering approach to entry conditions, requiring alignment across technical indicators, timeframes, and market conditions .
Long Entry Requirements
Trend Filter: Fast EMA (9) must be above Slow EMA (21), price must be above Fast EMA, and higher timeframe must confirm uptrend
MACD Signal: MACD line crosses above signal line, indicating increasing bullish momentum
RSI Condition: RSI below 70 (not overbought) but above 40 (showing momentum)
Volume & Volatility: Current volume exceeds 1.2x 20-period average and ATR shows sufficient market movement
Time Filter: Trading occurs during optimal hours (9:30-11:30 AM ET) when market volatility is typically highest
Exit Strategies
The strategy employs multiple exit mechanisms to adapt to changing market conditions and protect profits :
Stop Loss Management
Initial Stop: Placed at 2.0x ATR from entry price, adapting to current market volatility
Trailing Stop: 1.5x ATR trailing stop that moves up (for longs) or down (for shorts) as price moves favorably
Time-Based Exits: All positions closed by end of trading day (4:00 PM ET) to avoid overnight risk
Best Practices for Implementation
Settings
Chart Setup: 5-minute timeframe for execution with 15-minute chart for trend confirmation
Session Times: Focus on 9:30-11:30 AM ET trading for highest volatility and opportunity

HMA 200 + EMA 20 Crossover StrategyThis strategy combines a long-term trend filter using the Hull Moving Average (HMA 200) with a short-term entry trigger using the Exponential Moving Average (EMA 20).
📈 Entry Logic:
Buy Entry: When price is above the HMA 200 and crosses above the EMA 20.
Sell Entry: When price is below the HMA 200 and crosses below the EMA 20.
The strategy closes the current position and reverses on the opposite signal.
⚙️ Strategy Settings (Backtest Configuration):
Position size: 10% of equity per trade
Commission: 0.1% per trade (to simulate broker fees)
Slippage: 2 ticks (to reflect realistic fill conditions)
✅ Purpose:
This script is designed to identify high-probability trades in the direction of the overall trend, avoiding whipsaw conditions. It is useful for traders looking for a dynamic crossover-based system that filters trades based on longer-term momentum.
🔎 Make sure to test across multiple assets and timeframes. For best results, apply this strategy to liquid trending markets like major FX pairs, indices, or high-cap stocks.
