Price LevelsAuto plots significant Gann and Fib price levels using the all time range. Useful to quickly identify significant levels of support and resistance. Chỉ báo Pine Script®của tomorme88110
Auto Fibonacci with .88Edited a script to simply change the second level to .88Chỉ báo Pine Script®của BeastBoy730911227
Auto Fibonacci Levels + Auto Trend Line generatorAnother indicator for you guys!!! This indicator consists of the 5 key Fibonacci retracement levels, plotted automatically to user input settings. I also have included an auto support/resistance trend line generator. What is a Fibonacci retracement? 'Fibonacci retracement is a method of technical analysis for determining support and resistance levels. It is named after the Fibonacci sequence of numbers, whose ratios provide price levels to which markets tend to retrace a portion of a move before a trend continues in the original direction.' - Wikipedia How to use the Fibonacci retracement? - The Fibonacci levels are default. These percentiles from price to the average of the high in a sample and low in a sample give you a guideline of where a bottom may be, where a top may be, and where a range is being created. - Look for the price to reject from 61.8% and 76.4%, and also look for price to bounce from 38.2% and 23.6%. If a lower low/higher high is made, the fib levels will follow and the percentiles within will be recalculated after a 5 candle offset period. - If you see price trending towards the lower percentiles (38&23) and using the 50% as resistance, look for a break downwards and vice versa. -This Fibonacci set as all others is subject to fake-out, always use this with another series indicator, or don't use it as a signal for entry at all (unless you have a backdated strategy) How to use the trend line generator? -The trend line generator will only plot when a lower low/higher high has taken place within the input amount of candles. It is also offset by a user amount. -The check box will give the option to have the trend line's plot or not. - If you see a green/red dot it means that that will be your first coordinate for the trend line, and until the computations are complete it will give you an idea of which direction it will be in (resistance or support) -When opening this indicator zoom out all the way to connect any trend lines that do not load automatically. Let me know if you have any questions, suggestions or issues! Thank you everyone! -Cheatcode1 :) SP:SPX TVC:DXY BMFBOVESPA:EUR1! CME:BTC1! BINANCE:BTCUSDTChỉ báo Pine Script®của CheatCode1Cập nhật 1414 2.2 K
Previous Days RangesPrevious Days Ranges Simply plots out market ranges of previous days price action, of which are the following: Previous Day High Previous Day Low Previous Day Extended High Previous Day Extended Low Supports adjustments of timeframes, for different time zones, and style.Chỉ báo Pine Script®của TradeSeekersCập nhật 44187
Commodity Channel Relative StrengthNew concept(I think atleast) I've joined the Standard RSI and CCI at the hip with another plotcandle, which gives a picture of a larger candle With more interesting movement imo. Includes Fib Retracement Levels, High/Low and a couple of coppock curves for more confirmation. Broadening candles seem to indicate a weakening of trend strength (from what i've seen atleast) although exceptions do occur. Vice versa for tapering to a lesser degree I imagine. RSI has been shifted down to 0 to align the center point with the CCI , so the usual 30/70 RSI Levels are now -20/20 (although I have 30/-30 instead for the hlines). Chỉ báo Pine Script®của EsIstTurnt117
God Number Channel v2(GNC v2)GNC got a little update: 1) Logic changed a bit. I tried to calculate MAs based on the power(high - low of previous bars).You can see it the M-variables, as new statements were added in calculation section of MAs. I don't really know if I did right, because I didn't go too much in Pine Script. I just wanted to make a Bollinger-bands-like bands, which could predict the levels at which might reverse, using legendary fibonacci and Tesla's harmonic number 432. It's might sound as a joke, but as you can see, it works pretty good. 2) Customization : No need to change Fibonacci ratios in code. Now you can do it in the GNC settings. Also MAs' names were made obvious, just check it out. Time of million similar "MA n1" has passed :) 3) Trade-entry advices : I didn't tell you exactly the trade-entry advices, as I haven't explored this script fully yet :) But you probably understood something intuitively, when added GNC on the chart. Now I made things way more obvious: 1. Zones between Fib ratios show you how aware you should be of price movements. Basically, here are the rules, but you probably understand them already: 1.1 Red zone(RZ) : high awareness, very likly for price to be reversed, but if there is a clear trend and you know, than it might be a time for price to shoot up/down. 1.2 Orange zone(OZ) : medium awareness, not so obvious, as price might go between boundaries of OZ and continue the trend movement if such followed before entering the OZ. If price go below lower boundary of OZ and the next bar opens below this boundary, it might be a signal for SHORY, BUT(!) please consider confirmation of any sort to be more sure. Think of going beyond the upper boundary by analogy. 1.3 Green Zone(GZ) : if the price hits any boundary of green zone, it is usually a good oppurtunity to open a position against the movement(hit lower boundary -> open LONG, hit upper boundary -> open SHORT). 1.4 Middle Zone(Harmonic Zone)(MZ) : same rules from Green Zone. IMPORTANT RECCOMENDATION : Use trend indicator to trend all signals from zones to follow the trend, 'cause counter-trending with this thing without stop loss might very quickly wipe you out , might if you will counter-trend strategy with GNC, I will be glad if you share it with the community :) Reccomendation for better entries : 1) if the price hits the lower(or high) boundaries(LB or HB) zone after zone(hit LB or HB of RZ, then of OZ, then of GZ), it is a very good signal to either LONG, if price was hitting LBs , or SHORT, if hitting HBs . 2) Consider NOT to place trades when in MZ, as price in this zone gets tricky often enough. By the way, if you dont the see the harmonic MAs(which go with plot(ma1+(0.432*avg1)) ), then set the transparency of zone to 20% or a bit more and then it will be ok. I will continue to develop the GNC and any help or feedback from you, guys, will be very helpful for me, so you welcome for any of those, but please be precise in your critics. Thank you for using my stuff, hope you found it usefull. Good luck :) Chỉ báo Pine Script®của tarasenko_Cập nhật 1212149
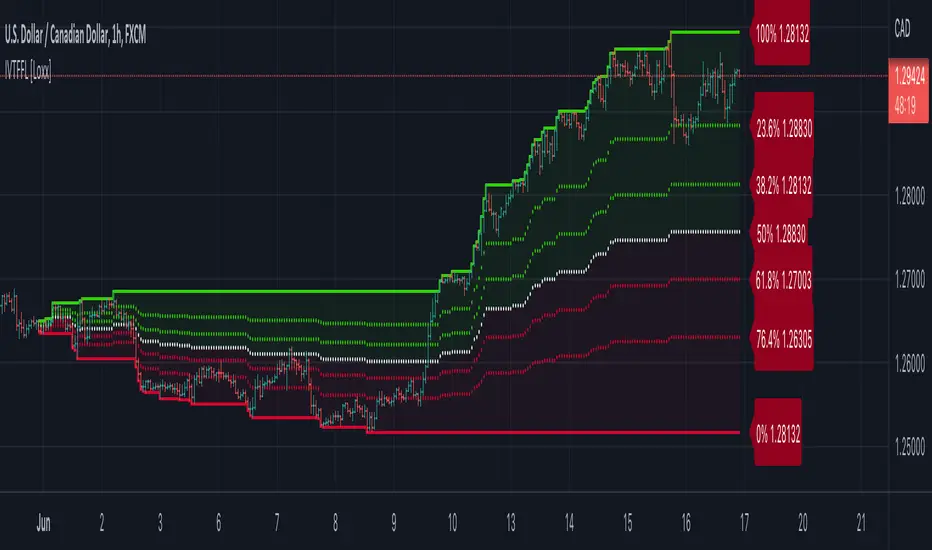
Intra-variety Timeframe Floating Fibonacci Levels [Loxx]Intra-variety Timeframe Floating Fibonacci Levels is an intraday, intraweek, and intramonth indicator to be used for scalping on lower timeframes. The indicator paints the developing fibonacci retracement levels as they change overtime over the selected intra-variety timeframe chosen. This indicator acts as another way to gauge support and resistance levels. What Are Fibonacci Retracement Levels? Fibonacci retracement levels—stemming from the Fibonacci sequence—are horizontal lines that indicate where support and resistance are likely to occur. Each level is associated with a percentage. The percentage is how much of a prior move the price has retraced. The Fibonacci retracement levels are 23.6%, 38.2%, 61.8%, and 78.6%. While not officially a Fibonacci ratio, 50% is also used. The indicator is useful because it can be drawn between any two significant price points, such as a high and a low. The indicator will then create the levels between those two points. Suppose the price of a stock rises $10 and then drops $2.36. In that case, it has retraced 23.6%, which is a Fibonacci number. Fibonacci numbers are found throughout nature. Therefore, many traders believe that these numbers also have relevance in financial markets. Fibonacci retracement levels were named after Italian mathemetician Leonardo Pisano Bigollo, who was famously known as Leonardo Fibonacci. However, Fibonacci did not create the Fibonacci sequence. Fibonacci, instead, introduced these numbers to western Europe after learning about them from Indian merchants. Fibonacci retracement levels were formulated in Ancient India between 450 and 200 BCE. Details -Change Fibonacci levels -Select day, week, or month timeframeChỉ báo Pine Script®của loxxCập nhật 66458
1-gg702gg fib + 3ema 50+100+200=+10 heikin ashi trand set with hem ind... wolfpack and draw trend line or auto trend line green = bay red = sell and set the bar heikin ashi from the sting goooood lockChỉ báo Pine Script®của wshm3k87
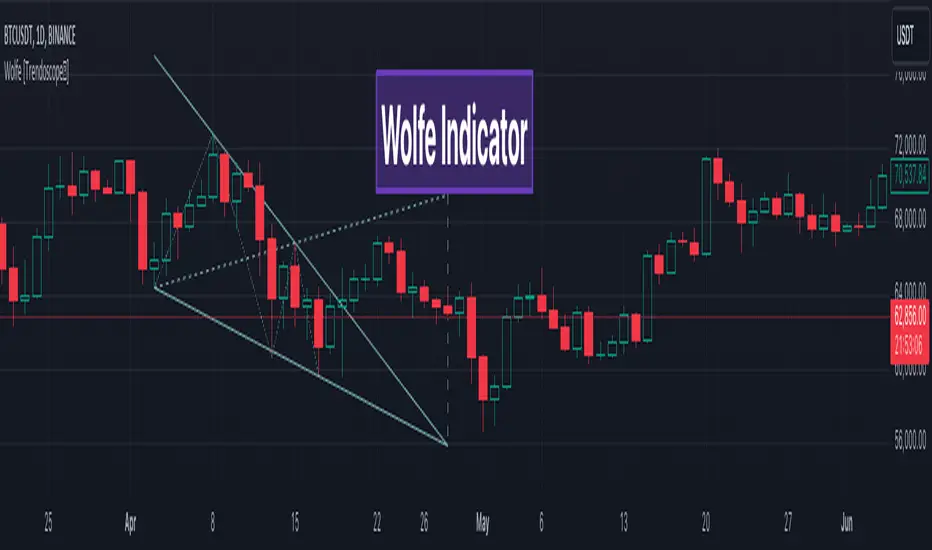
Wolfe Scanner (Multi - zigzag) [HeWhoMustNotBeNamed]Before getting into the script, I would like to explain bit of history around this project. Wolfe was in the back of my mind for some time and I had several attempts so far. 🎯Initial Attempt When I first developed harmonic patterns, I got many requests from users to develop script to automatically detect Wolfe formation. I thought it would be easy and started boasting everywhere that I am going to attempt this next. However I miserably failed that time and started realising it is not as simple as I thought it would be. I started with Wolfe in mind. But, ran into issues with loops. Soon figured out that finding and drawing wedge is more trickier. I decided will explore trendline first so that it can help find wedge better. Soon, the project turned into something else and resulted in Auto-TrendLines-HeWhoMustNotBeNamed and Wolfe left forgotten. 🎯Using predefined ratios Wolfe also has predefined fib ratios which we can use to calculate the formation. But, upon initial development, it did not convince me that it matches visual inspection of Wolfe all the time. Hence, I decided to fall back on finding wedge first. 🎯 Further exploration in finding wedge This attempt was not too bad. I did not try to jump into Wolfe and nor I bragged anywhere about attempting anything of this sort. My target this time was to find how to derive wedge. I knew then that if I manage to calculate wedge in efficient way, it can help further in finding Wolfe. While doing that, ended up deriving Wedge-and-Flag-Finder-Multi-zigzag - which is not a bad outcome. I got few reminders on Wolfe after this both in comments and in PM. 🎯You never fail until you stop trying!! After 2 back to back hectic 50hr work weeks + other commitments, I thought I will spend some time on this. Took less than half weekend and here we are. I was surprised how much little time it took in this attempt. But, the plan was running in my subconscious for several weeks or even months. Last two days were just putting these plans into an action. Now, let's discuss about the script. 🎲 Wolfe Concept Wolfe concept is simple. Whenever a wedge is formed, draw a line joining pivot 1 and 4 as shown in the chart below: Converging trendline forms the stop loss whereas line joining pivots 1 and 4 form the profit taking points. 🎲 Settings Settings are pretty straightforward. Explained in the chart below. Chỉ báo Pine Script®của TrendoscopeCập nhật 111111 5.4 K
Pivot Points (Channel | Fib | Support/Resistances)auto pivot point channel, channel fibonacci and support/resistance linesChỉ báo Pine Script®của asdfbasdfCập nhật 3333 1.4 K
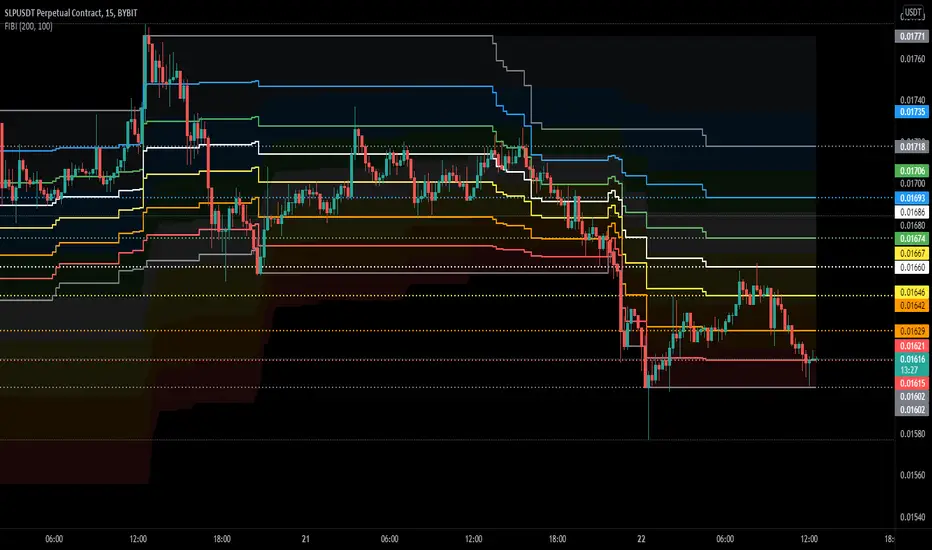
FIBIShows Fibonacci waves for a long range and Fibonacci lines for a short range. For me it helps to identify key levels or confluence on the macro and micro range. In the example above you can clearly see that the macro waves are in a down-trend while the micro lines are in a up-trend.. Also the price has been rejected at the 78.6 fib mirco line but found support on the 78.6 macro wave. these situations are hard to find with the default retracement toolsChỉ báo Pine Script®của rareSnow99686Cập nhật 2292
RSI Swing Trading Setup (2-Period)A simple script that adjusts the RSI visibly in order to better accommodate swing trading and certain swing trading setups/strategies. -------------------------------------------------------------------------------------------------------------------------------------------------------- Best used in conjunction with "Linear Regression Channel by LonesomeTheBlue" with 2.2σ (std.dev) and Show Fib Levels. ^Click image for a redirect to that script. -------------------------------------------------------------------------------------------------------------------------------------------------------- In certain price action patterns: A bearish reversal from a previously bullish move can indicate tops of a rally if the RSI moves from 0-40 to 60 (1) A bullish reversal from a previously bearish move can indicate bottoms of a pullback if the RSI moves from 60-100 to 40 (2) (USE THE LINEAR REGRESSION CHANNEL TO VALIDIFY THE RETRACEMENTS) -------------------------------------------------------------------------------------------------------------------------------------------------------- (1) -------------------------------------------------------------------------------------------------------------------------------------------------------- (2) --------------------------------------------------------------------------------------------------------------------------------------------------------Chỉ báo Pine Script®của D_dot_ZK1174
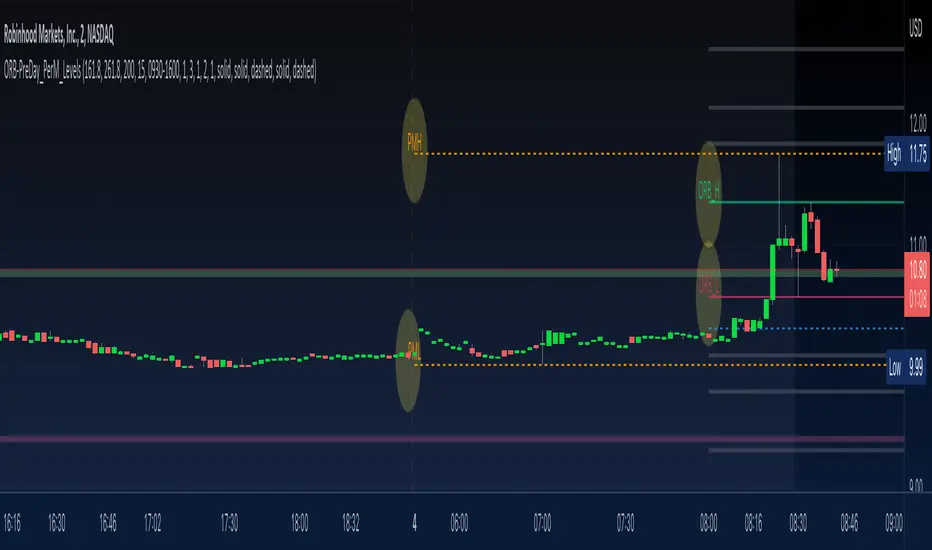
ORB-PreDay_PerM_LevelsThis script provides following levels: 1. ORB Level - You can adjust the timeframe of Opening Range (plots from 9am to 4pm) 2. ORB Fib Extension - 1.618 and 2.618 Fibonacci Extension of ORB High and Low (plots from 9am to 4pm) 3. Previous Day High/Low/Close - You can adjust color/thickness of the lines (plots from two days ago so that you can clearly see the levels) 4. Previous Two Days High/Low (plots from two days ago so that you can clearly see the levels) 5. Pre-Market High/Low (plots from 6:30am to 11am) All in one indicator gives much better clarity of where current instrument is trading in relation to ORB, Previous Day Levels and Previous Two Days Levels along with Pre Market Levels. You could combine these levels with your favorite EMA or EMA Cloud to create a trading system. You could combine these levels with MA Cloud and ATR vs DTR script to gauge the move. Look at the TWTR Chart today and see how these levels are respected. Chỉ báo Pine Script®của sskchartsCập nhật 2020595
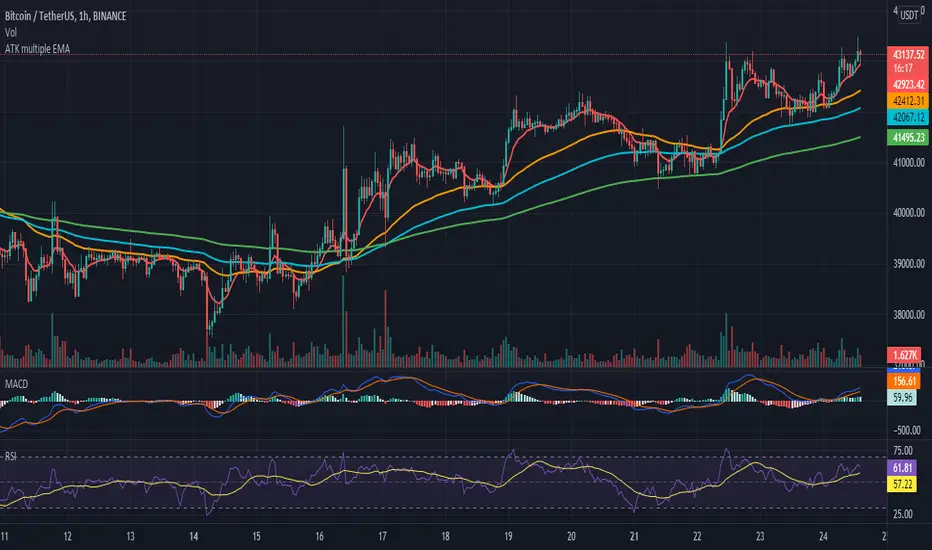
ATK multiple EMA This indicator Have EMA 9/50/99/200 . You can edit number and I add parabolic SAR And Auto Fib Retracement. if don't want to use you can closeChỉ báo Pine Script®của Barewatch6
FuzzyInxAuto Fib Extension is a tool that calculates target price levels following a retracement. Extension levels also indicate potential price reversal areas and show possible price levels after a retracement is completed. These levels are based on the key Fibonacci coefficients and the price movement of the symbol on the chart.Chỉ báo Pine Script®của R26amCập nhật 1116
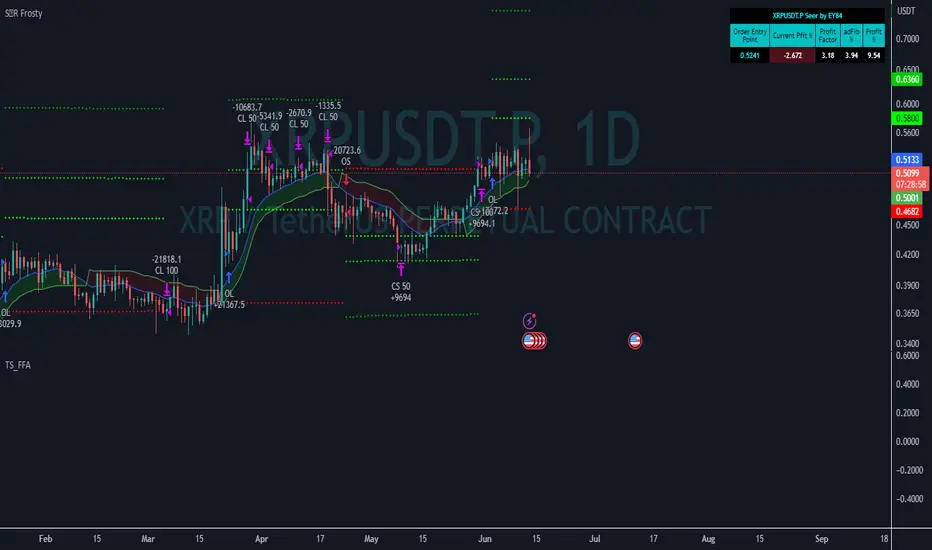
TS_FFALibrary "TS_FFA" Splits the ticker and generates best configs for FP and PP splitter(x) Splits the ticker and found the configuration regarding to name. Parameters: _x: ticker Returns: Fib and Profit percent values - Splitter had been added. - USDTPERP coins on Binance had been added - timeFrameMultiplier() timeframe multiplier had been added to the library - timeframe period value fixed - Changed timezone multiplier - Changed VWMA Percent valuesThư viện Pine Script®của emreyavuz84Cập nhật 8
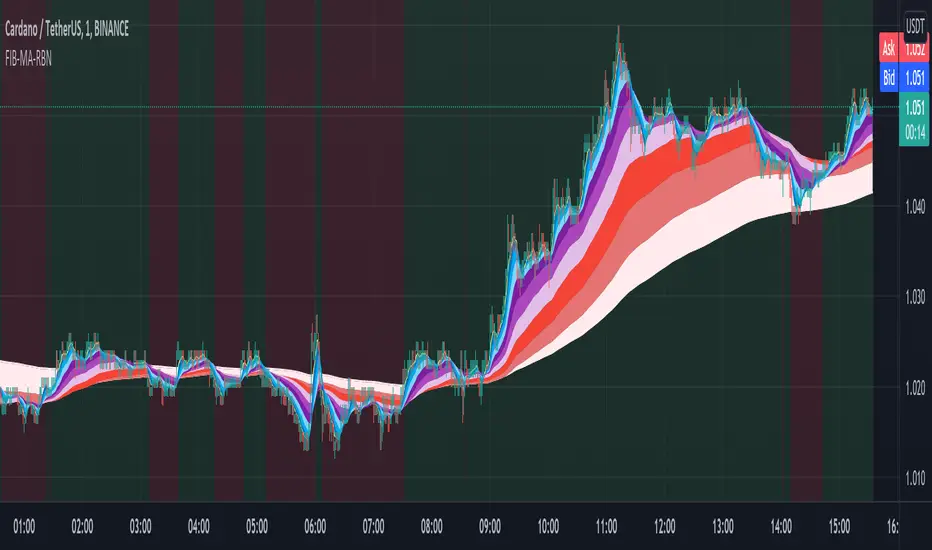
Fibonacci Muti-MA RibbonWelcome some, welcome small.... This is CryptoFilio, your dark knight in the crypto light - shining down my infinite wisdom upon this wasteland we call the "markets". It's me and you against the machine... so rage, rage, rage against the dying of the night! DESCRIPTION This indicator exemplifies the beauty of the sacred Fibonacci sequence.... used by flowers and seashells and the intrepid day trader. Each color in the ribbon represents an MA of a specific FIB lookback period. This naturally makes the ribbon front weighted, giving recent price action greater importance than older price action. The undulating curls of the ribbon allow a trader to see key convergences and divergences. The ribbon often narrows before a major price movement. The background is lightly colored to indicate when one average of MA's crosses the other average (1+2+3+4+5) crosses (6+7+8+9+10). Like a standard MA cross, but a little more sophisticated. The most visually pleasing is SMMA-RMA, but the more effective in anticipating the market is EMA and HMA. USAGE Visualizing convergence and divergence as the ribbon widens with sudden price movement and narrows during consolidation Visualizing general trends as the flipping over of the ribbon represents a general trend change Setting possible entry and exit points through the width and direction of the ribbon VARIATIONS You can select many types of MA's, such as SMA,EMA,HMA,VWMA... and a couple of others. The most effective seem to be EMA,HMA, and VWMA SUGGESTIONS Let me know if you'd like some other features added to this indicator, such as additional MA's or something else. I can also customize it for a specific application. Chỉ báo Pine Script®của cryptofilio1158
Volume Adaptive Bollinger Bands (MZ VABB)This indicator is a functional enhancement to John Bollinger's Bollinger Bands. I've used Volume to adapt dynamic length which is used in basis (middle line) of Bollinger Bands and Simple Moving Average is replaced with Adaptive Ehlers Deviation Scaled Moving Average ( AEDSMA ). BOLLINGER BANDS BASIC USAGE AND LIMITATIONS Bollinger bands are popular among traders because of their simple way to detect volatility in market and redefine support and resistance accordingly. These are some basic usages of original Bollinger Bands: Most commonly Bollinger Band works on 20 period Simple Moving Average as Basis / Middle Line and standard deviation of 2 for volatility detection. Upper and lower bands can act as support and resistance which accordingly update with standard deviation of same period as of Simple Moving Average. As upper and lower bands act as volatility measure which benefits in Squeeze detection and breakout trading. Among all the usages there are some limitations as follows: Original Bollinger Bands use 20 period Simple Moving Average as Basis which itself restricted to some number of data pints and if market moves in one direction or simply goes sideways for long time; candles can stay on either bands for long time. This gives benefit for staying in directional trade but will completely nullify the use of both bands as support and resistance. Above point simply be explained as markets can stay overbought / oversold for long time and one way to make Bollinger Bands more useful is to simply use higher periods in SMA but as we know with higher periods SMA becomes more laggy and less adaptive. Most traders use BBs alongside some other Volume Oscillator for example "On Balance Volume" but that does solve BBs limitations issue that it should be more adaptive to detect volatility in market. VOLUME ADAPTIVE BOLLINGER BAND WORKING PRINCIPLE Best way to make original Bollinger band more adaptive was to just use dynamic length instead on constant 20 period. This dynamic length had to be based on some other powerful parameter which can't be volatility as BB itself is a volatility indicator and adapting its length based volatility would have been superimposing volatility on Bollinger bands giving unrealistic results. For adaptive length, I tried using Volume and for this purpose I used my Relative Volume Strength Index " RVSI " indicator. RVSI is the best way to detect if Volume is going for a breakout or not and based on that indication length of Bollinger Band Basis Moving Average changes. RVSI breaking above provided value would indicate Volume breakout and hence dynamic length would accordingly make Bollinger band basis moving average more over fitted and similarly standard deviation of achieved dynamic length would give better bands for support and resistance. Similar case would happen if Volume goes down and dynamic length becomes more underfit. According to my back testing studies I found that Simple Moving Average wasn't the best choice for dynamic length usage in Bollinger Band Basis. So, I used Adaptive Ehlers Deviation Scaled Moving Average ( AEDSMA ) which is more adaptive and already modified to adapt with RVSI. SLOPE USAGE FOR TREND STRENGTH DETCTION Volume Adaptive Bollinger Bands are more reactive to market trends so, I used slope for trend strength detection. If slope of Volume Adaptive Bollinger Band Basis (i.e. AEDSMA ), Upper and Lower Bands is supporting a trend at same time then script will provide signal in that direction. That signal can also use Volume as confirmation if Bollinger Bands trend direction is supported by Volume or not. DYNAMIC COLORS AND TREND CORRELATION I’ve used dynamic coloring in Basis ( AEDSMA ) to identify trends with more detail which are as follows: Lime Color: Slope supported Strong Uptrend also supported by Volume and Volatility or whatever you’ve chosen from both of them. Fuchsia Color: Weak uptrend only supported by Slope or whatever you’ve selected. Red Color: Slope supported Strong Downtrend also supported by Volume and Volatility or whatever you’ve chosen from both of them. Grey Color: Weak Downtrend only supported by Slope or whatever you’ve selected. Yellow Color: Possible reversal indication by Slope if enabled. Market is either sideways, consolidating or showing choppiness during that period. SIGNALS Green Circle: Market good for long with support of Volume and Volatility or whatever you’ve chosen from both of them. Red Circle: Market good to short with support from Volume and Volatility or whatever you’ve chosen from both of them. Flag: Market either touched upper or lower band and can act as good TP and warning for reversal. FIBONACCI BANDS I’ve included Fibonacci multiple bands which would act as good support/resistance zones. For example, 0.618 Fib level act as good local support and resistance in both upper and lower zones. Fibonacci values can be modified but should be lower than 1. DEFAULT SETTINGS I’ve set default Minimum length to 50 and Maximum length to 100 which I’ve found works best for almost all timeframes but you can change this delta to adapt your timeframe accordingly with more precision. Dynamic length adoption is enabled based on Volume only but volatility can be selected which is already explained above. Trend signals are enabled based on Slope and Volume but Volatility can be enabled for more precise confirmations. In “ RVSI ” settings "Klinger Volume Oscillator" is set to default but others work good too especially Volume Zone Oscillator. For more details about Volume Breakout you can check “MZ RVSI Indicator". ATR breakout is set to be positive if period 14 exceeds period 46 but can be changed if more adaption with volatility is required. EDSMA super smoother filter length is set to 20 which can be increased to 50 or more for better smoothing but this will also change slope results accordingly. EDSMA super smoother filter poles are set to 2 because found better results with 2 instead of 3. FURTHER ENHANCEMENTS So far, I've achieved better results with "Klinger Volume Oscillator" in RVSI but TFS Volume Oscillator and On Balance Volume can be used which would change dynamic length differently. It doesn't mean that results would be wrong with some oscillator and precise with others but every oscillator works in its specific way for and RVSI just detect strength of Volume based on provided oscillator.Chỉ báo Pine Script®của MightyZingerCập nhật 99478
ema3Simple 3 EMA with fib defaults. It's all you ever need sometimesChỉ báo Pine Script®của arbingersys32
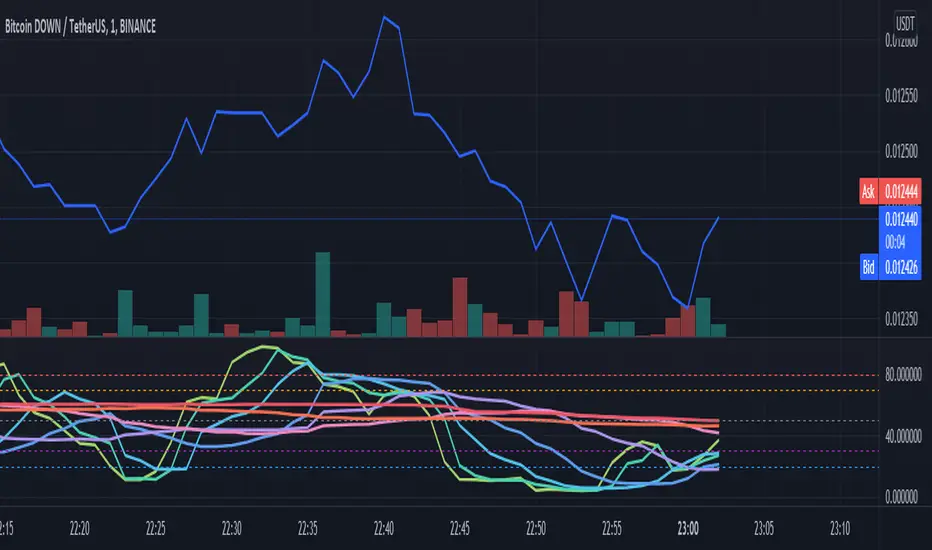
Stochastic RSI rainbow in fibonacci sequence using VWMAThe standard stochastic RSI gives limited information as it only contains two reference lines. This Stochastic RSI rainbow contains more lines in shorter timeframes and progressively fewer as the reference time increase. This is done in a FIB sequence 2,3,8,13,21,34,55.... The shorter timeframes are more reactive to current market conditions indicating recent price action and the longer lines represent more significant periods of time. The indicator uses VWMA for its calculations (volume weighted moving average) HOW TO USE THIS INDICATOR: When multiple lines are above, either 70 or 80, you can consider the commodity overbought, or OB. The more lines that are above the threshhold, the more significant the signal. The same is true in inverse. In addition, you can use each cross to signify a buy/sell signal according to the type and quantity of trading you are doing. If you are looking to get in and out quickly you can use the lower timeframe signals. OPTIONS: You can change what data is used for the VWMA calculation... Of course, you can select colors and other properties as well. Chỉ báo Pine Script®của cryptofilio1178
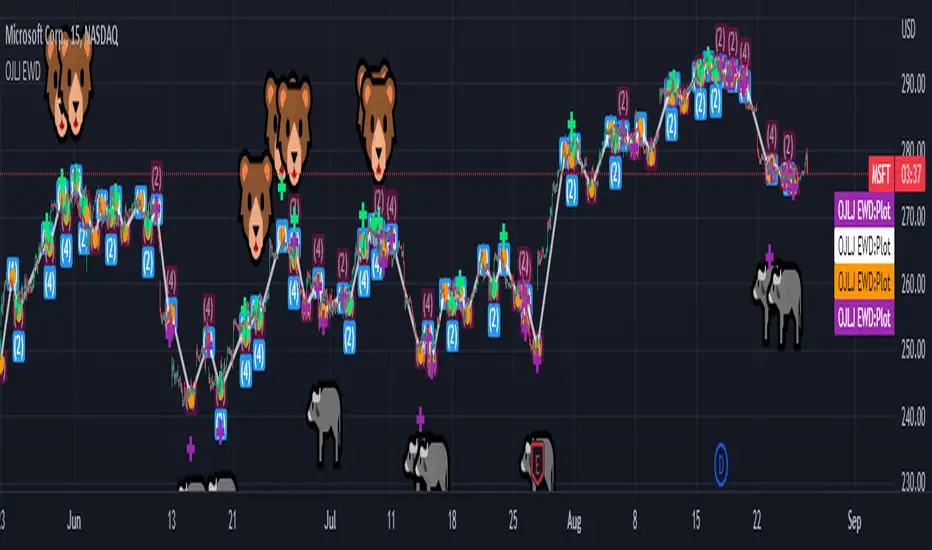
OJLJ Elliott Waves detector (Free)This script is made to identify Elliot Waves by setting a zigzag line as principal source, it identifies patterns with the most common rules, in the chart you will see a number in each wave detected, a wave could have the characteristics to be two different waves so it will be plotted the options that could be, To identify which one is most trustable I suggest to use the Fibonacci levels options as an additional note this is a free update to my existing script. Features: + All waves ? (Option to show just the 5 Wave patterns recognition) + Draw zigzag line (Option to show the zigzag line) + Supports Multiple instruments, from FOREX to Stocks + It works on all the timeframes + Show Fib levels (Option to show the Fibonacci levels) + Fibonacci levels fit test (Green crosses mark were should a Bull wave be to fit with a Fibonacci Level While the purple crosses show were should the wave fit to be a bear trend, the more closer with the point of the wave the most trustable Example, a 5 Wave Bull could also be a 2 Bear Wave, if the green cross is closer to the orange point of the wave then is a 5 Wave Bull, if the purple cross is closer to the orange point) + A background color also show when a 5 pattern is identified + The way to plot the zigzag can be changed with 3 Input options Characteristics to add in future updates (Please if you like it you can support me with coins): + Detect more than 1 cycle at the same time + Use a volume indicator to identify how many volume was traded in each wave + Implement the use of the EWO ( Elliot Wave Oscillator) + Improve the display + Identify ABC patterns + Add triangles and Zigzag formationsChỉ báo Pine Script®của Oscar118Cập nhật 2424 1.7 K
CRC.lib Log FunctionsLibrary "CRCLog" default_params() Returns default high/low intercept/slope parameter values for Bitcoin that can be adjusted and used to calculate new Regression Log lines log_regression() Returns set of (fib) spaced lines representing log regression (default values attempt fitted to INDEX:BTCUSD genesis-2021)Thư viện Pine Script®của calmratCập nhật 12
TSI in Dynamic Zones with Divergence and Pivot PointsTrue Strength Index , or TSI is considered a "leading indicator" - in contrast to a "lagging indicator" just as Moving Averages it does not show a confirmation what already happened, but it shows what can happen in the future. For example: The chart is climbing while the TSI oscillator is slowly declining, gets weaker and weaker, maybe even prints bearish divergences? That means that a reversal might be occurring soon. Leading indicators are best paired with Stop and Resistance Lines, General Trendlines , Fib Retracements etc. Your chart is approaching a very important Resistance Trendline but the TSI shows a very positive signal? That means there is a high probability that the Resistance is going to be pushed through and becomes Support in the future. What are those circles? -These are Divergences. Red for Regular-Bearish. Orange for Hidden-Bearish. Green for Regular-Bullish. Aqua for Hidden-Bullish. What are those triangles? - These are Pivots . They show when the TSI oscillator might reverse, this is important to know because many times the price action follows this move. What are these blue or orange areas? - Those are dynamic zones. For the analysis of the TSI its important to know if the indicator is in a state of oversold or overbought to filter out ranging price movement. Normally those zones are static, in this version of the TSI oscillator dynamic zones were added to show a dynamic calculation whether the TSI oscillator is oversold, overbought or ranging. Please keep in mind that this indicator is a tool and not a strategy, do not blindly trade signals, do your own research first! Use this indicator in conjunction with other indicators to get multiple confirmations.Chỉ báo Pine Script®của AdonisWertherCập nhật 2727 1.1 K