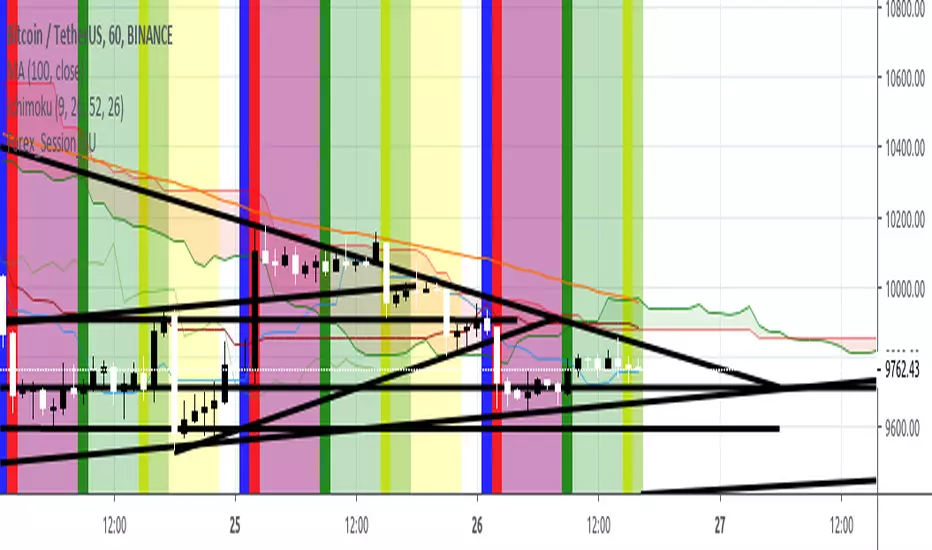
Efficient Support & Resistance LevelsThis script is a mixture of my two previous scripts "True Strong Classical Support/Resistance Levels" and "Hidden Supports & Resistances + Round Levels". This combination brings on better identification of the most efficient support/resistance levels.
Note that "Hidden SnR Levels" part of the code is only expected to work on Forex charts, but apart from that, the other parts could be applied to any chart.
The script may:
- Draw classical support/resistance levels which retraced the price previously, aided by multi-timeframe analysis
- Draw hidden support/resistance levels based on psychological patterns of the price
- Adjust to wicks better than Pine Script built-in pivot functions
- Differ the levels color based on chart reactions
- Merge nearby classical levels to avoid congestion on the chart
Feel free to use it and send me your thoughts.
Tìm kiếm tập lệnh với "forex"

Low Scanner Forex strategyThis strategy is non repainting as the scanner do not use security for its entry and the Hull MTF is non repainted one.
it design for forex only
why it working as such ?
simple once we have good detection of Low using Low scanner and Low scaner strategy
which is a killer for stoks as I shown in that script
here i show winning non repainting strategy for Forex
why it working perfect?
if the Low entry is good. the market go up or down but eventualy by using step wise profit take out
as shown by adolgov
then you will win most of time .
This is example how I use my script with adolgov script to create this strategy
it not pyramiding as in pyramiding we buy and buy and buy. here the entry is fix but exit is progressive,0.5% -1% 1.5% ,2% at 25% equaty each.
the market go up or down we just take ourt profit out.
so if you use leverage in forex the win % will be crazy. but you must to apply this only to asstes where this strategy is working like EURO/USD
the dat here is from 2017 t0 2018 ,if you want the last data which show the same put in test year 2019 as start
This script is for forex lovers as teaching how to create winning non repainting strategy
if you want to invite to coffe be free to do so
let me know what you think

Real Interest Rate DifferentialThe Real IRD is a simple indicator built for forex trades that need a long-term view and want to compare currencies in search of high yield. The indicated interest rate maturity is 2 years, since shorter maturities may not price central banks' monetary policy decisions.
Example:
- You need to do an analysis of the AUDUSD
- In the Interest Rate 1 field, we put the interest rate for the base currency, in this case the AUD
- In the Interest Rate 2 field, the interest rate of the other currency, in this case the USD
- In the CPI 1 field, inflation referring to base currency
- In the CPI 2 field, inflation for another currency
CPI Codes:
QUANDL:RATEINF/INFLATION_USA < USD
QUANDL:RATEINF/INFLATION_EUR < EUR
QUANDL:RATEINF/INFLATION_JPN < JPY
QUANDL:RATEINF/INFLATION_CHE < CHF
QUANDL:RATEINF/INFLATION_GBR < GBP
QUANDL:RATEINF/INFLATION_CAN < CAD
QUANDL:RATEINF/INFLATION_RUS < RUB
QUANDL:RATEINF/INFLATION_AUS < AUD
QUANDL:RATEINF/INFLATION_NZL < NZD

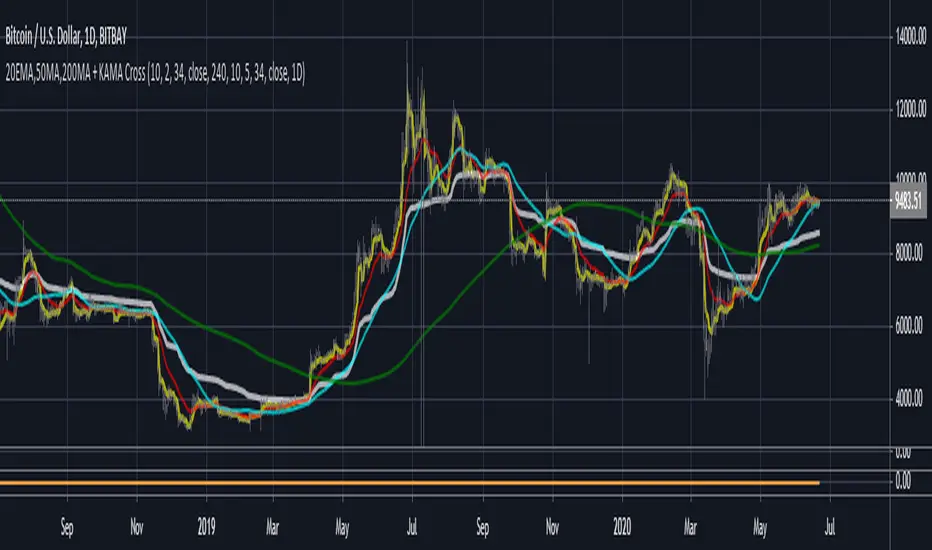
3MA'S + KAMA Trend (20EMA,50MA,200MA + KAMA Trend)This indicator, combines the traditional FOREX moving averages (20EMA, 50ma, 200ma) into a single indicator with
an adaptive moving average (AMA) taken from a user defined timeframe to show trend direction (by default, it plots
the daily 10/2/34 KAMA overlayed on any timeframe chart.
An AMA moves slowly when markets are sideways but swiftly during periods of volatility as a result it reacts much fast than
traditional options for moving average trends.
If the price is above the KAMA, trend is up. Below the KAMA, trend is down.
Naked Forex - Kangaroo Tail & Big Shadow Indicator-modifiedKind of new to here and new to code
It's a modified version of ErwinBeckers's Naked Forex - Kangaroo Tail Indicator

FRAMA - Supertrend strategyFRAMA Strategy
I found this strategy on internet, in a well-known forex forum.
I have translated the two indicators mentioned in that strategy (originally in mq4) in pine script.
Thanks to Fractured and Shizaru for the FRAMA snippets, to mejialucas for Supertrend snippet, to JayRogers for trade management snippet and to Trost for backtesting snippet.
I also added some code to have FRAME with a deiiferent timeframe
Indicators set-up:
FRAMA period 24 (it was originally 25 but it's better to use an even number)
FRAMA timefarme lower then chart timeframe (e.g. daily chart and weekly FRAMA)
Supertrend indicator as it is.
Of course, it is better to adapt above setting to traded instrument.
Long/Buy rules:
1 - Enter at crossover between FRAMA and its signal
2 - Option to filter entries based on supertrend signal
3 - Exit when Supertrend change direction;
4 - Exit long when short signal occurs;
Short/Sell rules:
1 - Enter at crossunder between FRAMA and its signal
2 - Option to filter entries based on supertrend signal
3 - Exit when Supertrend change direction;
4 - Exit short when long signal occurs;
VERY IMPORTANT NOTE: this is a trend following strategy, so the target is to stay in the trade as much as possible (drawdown my be high). If your trading style is more focused on scalping and/or pullbaks, this strategy is not for you.
Credits to who developed this startegy (google it).
Thanks to all pinescripters mentined in the code for their snippets.
I have also a study with alerts.
Please use comment section for any feedback or contact me if you need support.

Best Volatility Calculator (Multi Instruments)Hello traders
A bit of context
Definition: Volatility is defined as the close of current candle - close of the previous N candle
This is an alternative version of my Best Volatility Calculator
The other version is displayed on a panel below. This one overlays on the chart using the "overlay=true" setting
This indicator shows the average volatility, of last N Periods, for the selected time frames and for 2 selected instruments.
You can select up to 2 timeframes with this version
Presented as Currency, Pip, percentage labels in a panel below.
Will calculate in real-time only for the current instrument on the chart.
The indicator is coded to not be repainting
Example
In the indicator screenshot, I used a lookback period of 1.
That compares the current candle close versus the previous one for the daily and weekly timeframe
Showing how the results look like using FOREX instruments (where using the PIPS labels make more sense than with cryptocurrency assets)
Best regards
Dave

Syminfo.TypeHello traders
Earlier this week I discovered a new built-in variable called syminfo.type
What is it for?
This variable returns the type of the current symbol. Possible values are cfd, stock, futures, indices, forex, crypto, fund.
Cool bro but... should we care?
Well... we all should. Imagine you have a generic script and you want a different configuration whether you're trading FOREX or Crypto .
I designed a dummy example in that script that will preset the inputs according to the asset type from the chart.
Here I want 12/26/9 for forex and 20/50/50 for crypto - 30/60/90 otherwise
Quick caveat
It seems that for any crypto asset, syminfo.type returns "bitcoin". TradingView will fix it at some point but wanted to give you the heads-up regardless
Enjoy and all the BEST ^^
--
Dave

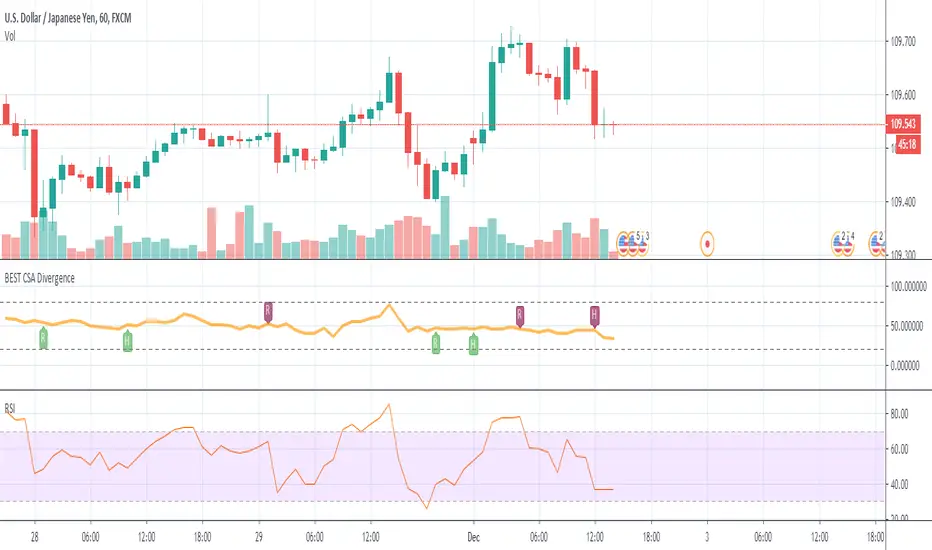
BEST Currency Strength Indicator DivergenceHello traders
Hope you had a great Thanksgiving
Now it's my turn to give and all I ask in return is you to be thankful (did I get the "Thanksgiving" thing right?)
The Currency Strength Indicator plots an average of the selected FX pairs in the indicator.
Someone asked me if I could develop an alternative of that script adding a divergence component.
The script evaluates the divergences between the average of the selected RSI(FOREX pairs) and the RSI(FOREX pair) displayed on the chart.
This version includes new features such as:
- the RSI length can now be selected
- we can select the 6 pairs used for the divergence calculations
All the BEST my aspiring traders and quants
See you tomorrow for another script
Dave
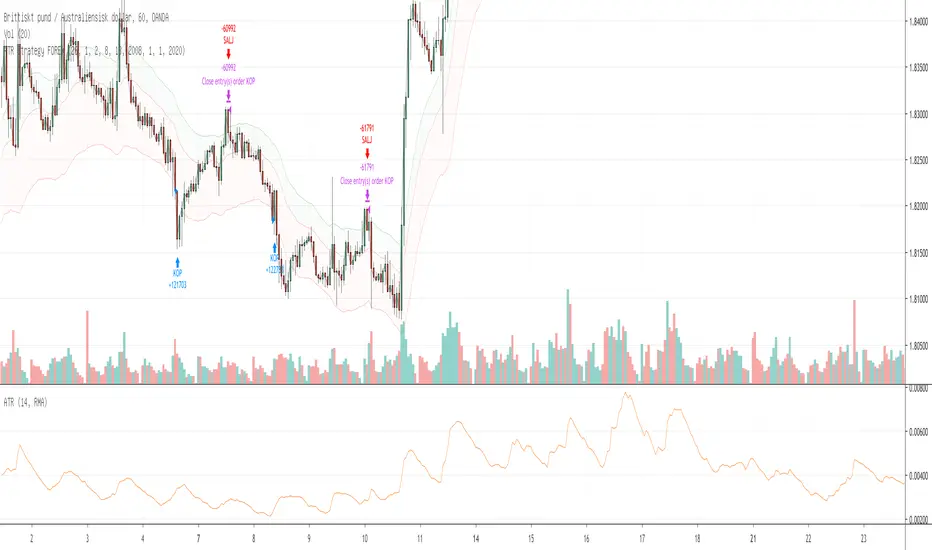
ATR Strategy for most volatile FOREX pairsA strategy suitable for volatile Forex pairs. The strategy is simple, buy low band and sell short high band. Doing so, you will always be in a trade, that is important to understand.
Tested on 1 hour charts.
Mirror MACD by Trader JayThis is my take on the metatrader indicator, the mirror macd. Works pretty good on Forex, haven't tested on anything else
Enter long after the Blue Line Cross Up the Red Line and EXIT after the Green line Cross Up the Red Line (above the Blue Line).
For the opposite position : ENTER SELL after the Red Line Cross Down.

TradingView Alerts to MT4 MT5 + dynamic variables NON-REPAINTINGAccidentally, I’m sharing open-source profitable Forex strategy. Accidentally, because this was aimed to be purely educational material. A few days ago TradingView released a very powerful feature of dynamic values from PineScript now being allowed to be passed in Alerts. And thanks to TradingConnector, they could be instantly executed in MT4 or MT5 platform of any broker in the world. So yeah - TradingConnector works with indices and commodities, too.
The logic of this EURUSD 6h strategy is very simple - it is based on Stochastic crossovers with stop-loss set under most recent pivot point. Setting stop-loss with surgical precision is possible exactly thanks to allowance of dynamic values in alerts. TradingConnector has been also upgraded to take advantage of these dynamic values and it now enables executing trades with pre-calculated stop-loss, take-profit, as well as stop and limit orders.
Another fresh feature of TradingConnector, is closing positions only partly - provided that the broker allows it, of course. A position needs to have trade_id specified at entry, referred to in further alerts with partial closing. Detailed spec of alerts syntax and functionalities can be found at TradingConnector website. How to include dynamic variables in alert messages can be seen at the very end of the script in alertcondition() calls.
The strategy also takes commission into consideration.
Slippage is intentionally left at 0. Due to shorter than 1 second delivery time of TradingConnector, slippage is practically non-existing. This can be achieved especially if you’re using VPS server, hosted in the same datacenter as your brokers’ servers. I am using such setup, it is doable. Small slippage and spread is already included in commission value.
This strategy is NON-REPAINTING and uses NO TRAILING-STOP or any other feature known to be faulty in TradingView backtester. Does it make this strategy bulletproof and 100% success-guaranteed? Hell no! Remember the no.1 rule of backtesting - no matter how profitable and good looking a script is, it only tells about the past. There is zero guarantee the same strategy will get similar results in the future.
To turn this script into study so that alerts can be produced, do 2 things:
1. comment “strategy” line at the beginning and uncomment “study” line
2. comment lines 54-59 and uncomment lines 62-65.
Then add script to the chart and configure alerts.
This script was build for educational purposes only.
Certainly this is not financial advice. Anybody using this script or any of its parts in any way, must be aware of high risks connected with trading.
Thanks @LucF and @a.tesla2018 for helping me with code fixes :)

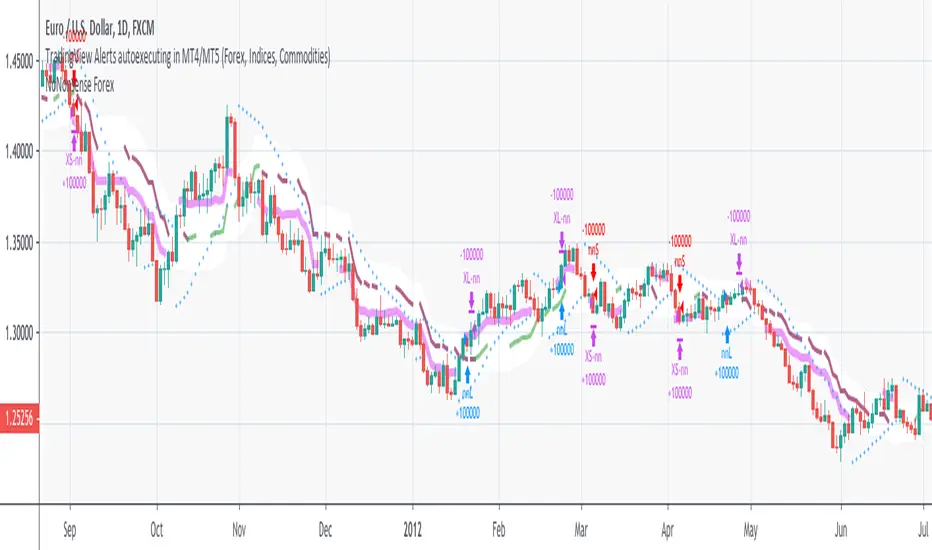
NoNonsense Forex - high timeframe trading absurd NON-REPAINTINGSome time ago I bumped into NoNonsense Forex - pretty good-looking course with well-designed videos, reasonable rules, etc. Nice explanatory videos, not selling anything, building indicators-only strategy. But there was one thing that really annoyed me - it was supposed to work only on Daily timeframe. What is the point in trading such high timeframe, if decisions changing market direction are playing out within 1 minute? What is the point in evaluating trades from 1994 if we are 25 years later?
Anyway, I have developed this strategy, which is:
- non-repainting
- not using trailing-stop
- not using any other known TradingView backtest bugs
And I'm showing it as an example of OVERFITTING. Backtesting results look absurd: 100% profitable. But if you change any of the many parameters in the Settings popup, they will turn into disaster. It means, the rules of this strategy are very fragile. Don't trade this! Remember about backtesting rule #1: past results do not guarantee success in the future.
I'm giving this strategy out with the source code. Feel free to do anything you want with it. But if you find parameters or modifications on, which allow profitable trading on lower timeframes, don't be shy, let me know :)
*********
Forex / Indices / Commodities traders who want to start AUTO-TRADING might want to take a look at "TradingConnector", which allows no-latency trades execution from TradingView to MT4/MT5.
DAY separator P4L FOREX
day separator for better orientation of neutralizations in the graph. with the possibility of choosing day and color to show in the graph

[PX] Forex ATRCompare forex volatility at a glance.
If you are looking for someone to develop your own indicator or trading strategy, don't hesitate to get in touch with me here on TradingView or below.
Contact:
www.pascal-simon.de
info@pascal-simon.de


Naked Forex - Kangaroo Tail IndicatorIndicator which identfies a kangaroo tail as defined in the book naked forex
A kangaroo tail is defined as
- a candle where the body closes in the upper or lower third
- which has room to the left

[New series!] [Consistent Losing Strategies] 34 EMA Scalping//---------------------------INTRO------------------------------
Hi All!
Let me introduce myself as a semi-successful forex trader & lover of automation.
I've taken to algo trading and have been hunting down strategies (that usually use indicators) to automate, backtest, and hopefully implement in MT4.
Unfortunately, most strategies are complete bulls*** and the select cases that are shown to "prove" success are limited.
These strategy sources often do not provide useful analytics either.
I want to change that approach to trading! We can really benefit each other and the community by being methodical about backtesting
as well as evaluating our results with some kind of scoring heuristic.
As for what that standardized process looks like..well I'm still working on it.
I'm pretty much on Tv for multiple hours of the day, screening strategies via Pinescript and I'd like to start sharing my progress!
This is a new series I'd like to start on consistently losing strategies. I'll make all the code public, so if you think I've made a blunder
or approached a problem the wrong way, then drop me a DM or paste your fix into the comments.
//---------------------------STRAT------------------------------
34 EMA Scalping strategy (ref. forextradingstrategies4u )
How you're supposed to trade it:
BUY:
1. Market is in an down trend as shown by the 34 EMA
2. Price breaks above a downwards trend line
3. Price breaks above the 34 EMA
4. Look for a very bullish candlestick or chart pattern
SELL:
1. Look for the 34 EMA to show we are in an uptrend
2. Price breaks below an upwards sloping trend line
3. Price breaks below 34 EMA
4. Look for a bearish candlestick or a chart pattern
//---------------------------CONC------------------------------
Q: Why does it fail?
A: I believe this strategy relies too much on subjective input (aka, trendlines).
Q: Why does it fail as an algo?
A: The 34 EMA is no more predictive than any other EMA, although it does a good job at filtering out noise.
Q: Should I try it out?
A: No, it's trash. This is the proof that it is trash.

Colored Volume Bars All Markets: Combining Volume SourcesUsing volume in Forex is potentially misleading as we are only provided the broker volume or futures exchange volume for the currency or commodity in a decentralised market. This code combines the volumes from FXCM, Onanda and futures for the instrument being studied. The combination of the volumes could improve the reliability of the volume being considered. Using this approach other volume indicators can also be improved.

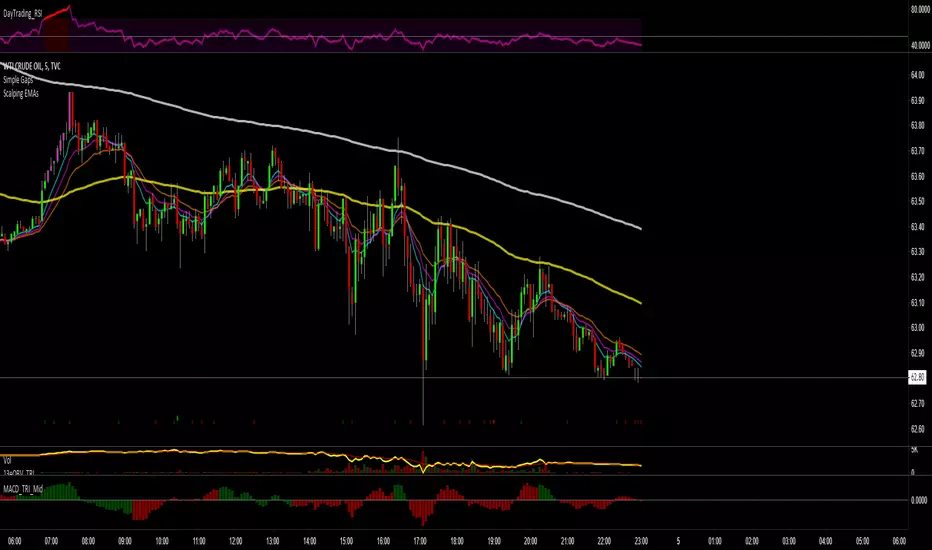
Scalping EMAs for ForexMoving averages for 5m time frame. The 96 and 252 are the 8 and 21 on 1h
Inspired by this simple scalping strategy
NKD Forex Combo Indicator (UTC 0:00, UK Time)This indicator is for the NKD Forex Kings & Queens. Use this version if you live in the United Kingdom UTC 0:00 time zone.

NKD Forex Combo Indicator (UTC 0:00, UK Time)This indicator is for the NKD Forex Kings & Queens. Use this version if you live in the United Kingdom UTC 0:00 time zone.
