Multiple MA + Bollinger bands + Ichimoku cloudThis is an extension of my previous script 'Multiple MA', now featuring also an Ichimoku Cloud and Bollinger bands.
More, I added more functionality to the integrated Bollinger bands script, that by default use only Standard Moving Average to plot the bands. With this script you can plot Bollinger bands using the MA you prefer from the ones included in the 'Multiple MA' script (SMA, EMA, WMA, VWMA and Hull MA), allowing you to better fit your preferences.
About Ichimoku cloud I choose to enable by default only the cloud and the lagged price, which I consider the most useful components of this indicator, however you can enable each component from the settings.
I tried to make 3 indicators fit well with each other using some graphical customization (It works quite well with dark background). However keep in mind that i made this script as much customizable as possible, letting you enable and disable each one of the components from the plot. So you can take advantage of the whole indicators, and in case, clean the plot when you feel it's too much full of drawings and lines.
Please show me your support if you like the script, and find it useful, thanks!
Tìm kiếm tập lệnh với "ichimoku"
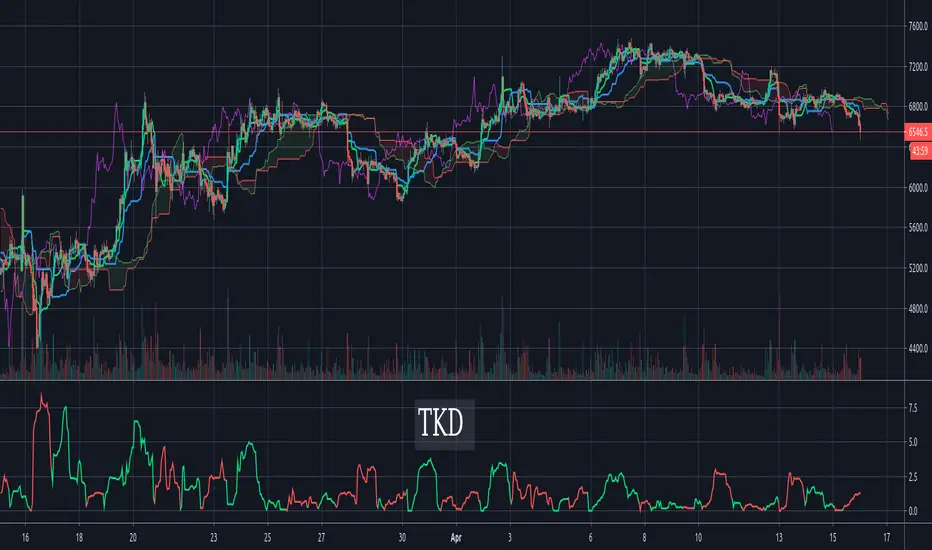
Tenkan-Sen Kijun-Sen Distance (TKD) Oscillator - IchimokuThe TKD is the distance between the Tenkan-Sen and the Kijun-Sen, expressed in percentage of current price. The further apart the tenken-sen and kijun-sen are, the more they want to snap back together. This makes for a decent oscillator. When the Tenkan-Sen is above the Kijun-Sen, the TKD is green. When it is below, the TKD is red. At the crossing points, it turns blue.
For those more familiar with Ichimoku Cloud techniques, one might also think of this indicator as a C-Clamp indicator. Bar coloring is supported and enabled by default. There's also an option to flip/invert the green/red colors in case you want to use it to judge pending cycles rather than current ones.
Pivot Boss 4 EMA + BB + Parabolic SAR + IchimokuA combination of a few of my favorite indicators.
1) Pivot Boss 4 EMA
2) Bollinger Bands
3) Parabolic SAR
4) Ichimoku Cloud
All credit to original authors.

MA - EMA - DMA - ICHIMOKU - BOLLINGER BANDS - SUPPORT RESISTANCE*** FREE ACCESS ***
JUST ADD THE SCRIPT
Multiple indicators in a single script
Moving Average, Exponential Moving Average, Displaced Moving Average, Ichimoku, Bollinger Bands and Support / Resistance
I hope that you will enjoy this script,
Take care
CCI CANDLE ICHIMOKU v1.0This indicator plots CCI candles with Ichimoku cloud and lines.
So you can get buy or sell signals like Ichimoku strategy system.
Your comments and suggestions will be greatly appreciated.
Good Luck,


[M10] Ichimoku Keltner Channel Scalper [Alerts]Hey all,
This script combines a couple of popular indicators to create a reliable yet versatile opportunity to automate trades based on the Ichimoku Cloud. The idea is to use bullish/bearish Ichimoku crossovers to enter positions whilst taking advantage of a modified Keltner Channel to exit these positions at maximum profit.
The script has been backtested on various timeframes and proves effective in both trending and ranging markets.
I have also added the ability to limit your positions to only long, or short, if this is of preference.
Want to backtest this? A strategy version of this script is also available at no cost on my page - enjoy!
Any questions? Let me know!

HTF IchimokuThis Indicator makes trading with ichimoku on different timeframes alot easier and more intuitive. It colors bars according to ichimoku trend and plots Kumo Breakouts and tk crosses.
tips are always welcome at: 38uGQJDDZDL6wX48x4gYTccPeQ3ZHVYmY4 ( btc )
Happy tradings :)

Complete Ichimoku Trader *modified*I just found this script from @kingthies here and like it. So i just made some changes and added some little code into it.
Reduced some noise for the signals. Hope anyone can enjoy it. But keep in mind, did not test it on live trading! Had just some time and love to work in pine :)
Original
Happy Trading

4 Ichimoku Clouds 2 BB by Theo ParkYou can use 4 Ichimoku Clouds and 2 Bollinger Bands with this indicator

Quad Moving Avarage-Ichimoku Cloud-ALMA-Bollinger BandsAll-in-One
Ingradients:
* Ichimoku Cloud,
* 2 Simple Moving Avarage (SMA),
* 2 Exponential Moving Avarage (EMA),
* 2 Arnoud Legoux Moving Avarage (ALMA),
* Bollinger Bands and
* Volume Based Colored Bars (developed by KIVANÇ fr3762).
Compiled for limitations. Thank you.

two Ichimoku ITNG
with this indicator you can have 2 ichimoku clouds on chart
first one with chart timeframe
and second one with your choosen timeframe
Enjoy

two Ichimoku ITNG
with this indicator you can have 2 ichimoku clouds on chart
first one with chart timeframe
and second one with your choosen timeframe
Enjoy
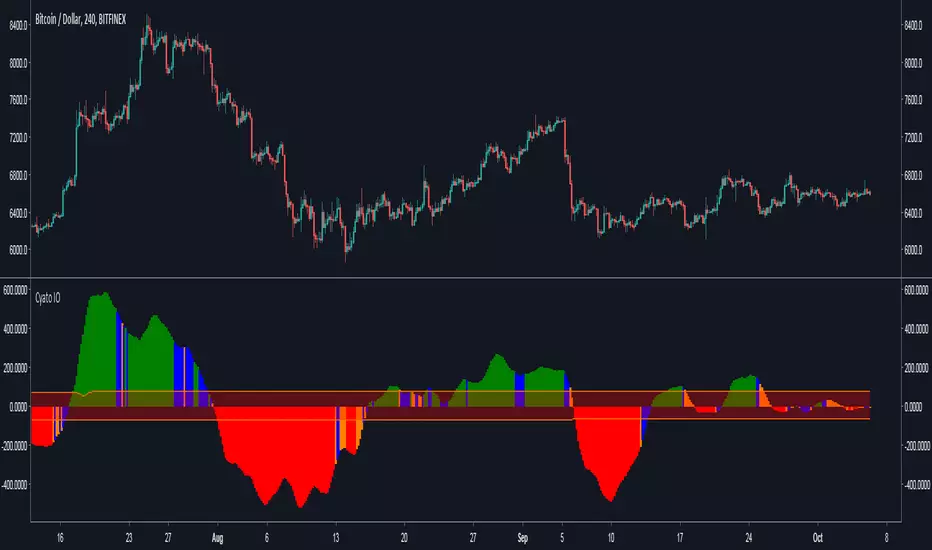
Cyatophilum Ichimoku Oscillator [ALERT SETUP]Hello, I built an oscillator based on Ichimoku trading rules. I wanted something simple to use, but powerful, with automated alerts that would help us trade breakouts and trend reversals.
The indicator can be used on all timeframes and everywhere : Crypto, Forex, Index, Stocks, Futures, CFD.
Basically, green bars equals bull market and red bars equals bear market.
Blue and Orange bars show potential breakouts and you can setup automatic alerts for receiving an email or SMS when it happens.
You can also setup alerts for new highs and new lows indicating a potential trend reversal.
The narrow channel in the middle indicates consolidating periods and unsignificant trades, because we know Ichimoku performs badly in range markets.
For more information on how to use it, I made a description page at the link below.
Sample Use Cases :
BTCUSD 4H
BTCUSD 2H with New Highs/Lows on chart (blue and red circles correspond to alert conditions)
BTCUSD 1H
ETHUSD 2H
Use divergences with price action to trade breakouts.
More information on my website
blockchainfiesta.com
Purchase this indicator today and get access to my other Cyatophilum Indicators that will help you in your trading
blockchainfiesta.com
Happy trading!
Uncle Mo's Ultimate Ichimoku V1Main features:
2 x Ichimoku Cloud
5 x EMA
2 x MA
1 x HullMA
Williams Fractals
Study is based around trader @br0qn 's Ichimoku script.
Credits also go to:
@RicardoSantos for the Bill Williams Fractals
@EmilianoMesa for the EMAs/MAs
@mohamed982 for the HullMA
The script is open source so please feel free to change it around. I'd greatly appreciate it if you could suggest ways to improve it.
Happy trading!

EMA analysis with Stoch OverSold/Bought indicator + IchimokuThe script will analyze trend around EMAs (configurable periods) and let you know when to short or long the market.
It will also tell you when there is a Overbought / Oversold Cross over Stochastic indicator
The script also includes a Ichimoku cloud so you can add this to your analysis for a trading action.
There will be more indicators coming into this script since im constantly working on Trading view scripts and analysing new strategys.
If you want access to it, contact me. (Its not free but also not expensive)
Best Regards.

CoryT's Noro's Ichimoku AlertsA few months ago I took Noro's Ichimoku Cloud and used the AV bot template to throw stops on it. I took some code from JustUncleL
to make it not so hideous. Trailing Stops are turned off, stop losses are turned off (you really don't need them with this), and this is currently a Long/Short strategy, the Longs Only and Shorts Only options are broken right now, I'm tired and you guys can either fix it yourselves or deal with it like this for now.
Hint: If you wanna use this as a long-only strategy just have AV close your buy orders whenever a short is triggered.
TSP Ichimoku Clouds x2 MTFDouble Ichimoku
Use a Multiple of current time frame :
15m * 4 = 1h
1h*24 = 1d

Fibon-IchimokuThis is a highly modified version of the classic Ichimoku cloud indicator. It incorporates Fibonacci retracement levels into the display. Hence the name "Fibon-Ichimoku"
As well as the standard short term Tenken-sen (blue line) and medium term Kinjun-sen (red line), it also includes a long term perspective line as well (in white).
The Tenken-sen and Kinjun-sen lines have been adjusted to work with 24hr Cryptocurrency markets.
Each line can also have the option to show 38.2% and 61.8% Fibonacci levels, however, I suggest not using them all at once, as there is a lot of information on the screen.
There is also a faint green and red thin line showing the top and bottom limits of the long term period.
Plotted above the candles, is a Fibonacci extension target line as a "possible" sell target level, this uses the Kinjun-sen time frame to find the swing low and swing high.
The extension target value is customisable by value as well as by forward or backward display offset.
The target level will show if the closing prices, from current bar to 2 periods back, is greater than the long term 50% line and the current Kinjun-sen 61.8% level is greater than the current long term 50% level.
After that if the Tenken-sen line is above the Kinjun-sen line, then the target will be green indicating a stronger trend. If it's less, then it will show as yellow.
BUT WAIT THERE"S MORE!!!
======================
Just for the sake of it, it also includes as an option to show inside bar alerts and price bar direction.
an "X" means an inside bar, arrows up or down indicate the direction of movement if it's not an inside bar.
The middle points of the bars determine the colouring of the alert.
If the current middle is greater than the previous, then it's green.
If the current middle is less than the previous, then it's red.
If there is no change then it's yellow.


Idō Heikin Ichimoku [DW]This is an experimental study inspired by Goichi Hosoda's Ichimoku Kinkō Hyō.
In this study, a McGinley Dynamic replaces the Tenkan-Sen and Kaufman's Adaptive Moving Average replaces the Kijun-Sen.
The cloud is calculated by taking the mean of the highest high and lowest low, adding a golden mean standard deviation above and below, and offsetting it over the specified period.
The lagging span is calculated by offsetting the closing price by the same amount as the cloud period.

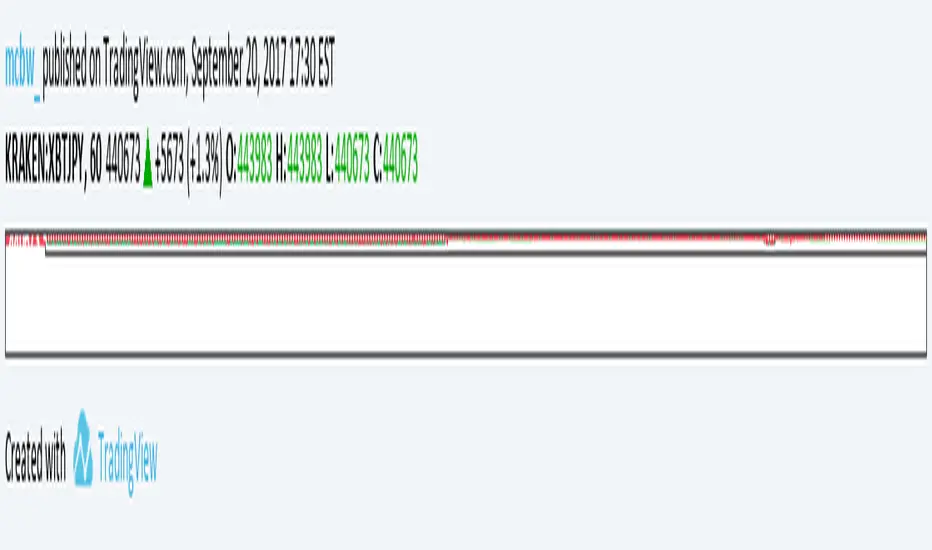
Multiple Ichimoku CloudsFor anyone that uses the Ichimoku Cloud there is a consistent need to flip between timeframes to get information about this at all levels. However, that trouble is now over. In this script there are 4 Ichimoku Clouds that operate in 4 different time frames. To change the timeframe simply change the multiplication factor to the desired levels. How this script works is that it takes your current timeframe as an input then it applies multiplication factors to it to achieve larger timescales. In the example here we are looking at the XBTJPY pair on the 1 hour. Our first cloud is 1x scaling, meaning that it is the 1 hour cloud. The second and third are 2x and 4x respectively meaning that we are looking at the 2 hour cloud and the 4 hour cloud. Lastly the largest cloud is the 24x cloud, aka the daily cloud. Now you only really need one look at the clouds for all the essential information.
As always feel free to message me about anything regarding this script.
Be happy :)