Uptrick X PineIndicators: Z-Score Flow StrategyThis strategy is based on the Z-Score Flow Indicator developed by Uptrick. Full credit for the original concept and logic goes to Uptrick.
The Z-Score Flow Strategy combines statistical mean-reversion logic with trend filtering, RSI confirmation, and multi-mode trade execution, offering a flexible and structured approach to trading both reversals and trend continuations.
Core Concepts Behind Z-Score Flow
1. Z-Score Mean Reversion Logic
The Z-score measures how far current price deviates from its statistical mean, in standard deviations.
A high positive Z-score (e.g. > 2) suggests price is overbought and may revert downward.
A low negative Z-score (e.g. < -2) suggests price is oversold and may revert upward.
The strategy uses Z-score thresholds to trigger signals when price deviates far enough from its mean.
2. Trend Filtering with EMA
To prevent counter-trend entries, the strategy includes a trend filter based on a 50-period EMA:
Only allows long entries if price is below EMA (mean-reversion in downtrends).
Only allows short entries if price is above EMA (mean-reversion in uptrends).
3. RSI Confirmation and Lockout System
An RSI smoothing mechanism helps confirm signals and avoid whipsaws:
RSI must be below 30 and rising to allow buys.
RSI must be above 70 and falling to allow sells.
Once a signal occurs, it is "locked out" until RSI re-enters the neutral zone (30–70).
This avoids multiple signals in overextended zones and reduces overtrading.
Entry Signal Logic
A buy or sell is triggered when:
Z-score crosses below (buy) or above (sell) the threshold.
RSI smoothed condition is met (oversold and rising / overbought and falling).
The trend condition (EMA filter) aligns.
A cooldown period has passed since the last opposite trade.
This layered approach helps ensure signal quality and timing precision.
Trade Modes
The strategy includes three distinct trade modes to adapt to various market behaviors:
1. Standard Mode
Trades are opened using the Z-score + RSI + trend filter logic.
Each signal must pass all layered conditions.
2. Zero Cross Mode
Trades are based on the Z-score crossing zero.
This mode is useful in trend continuation setups, rather than mean reversion.
3. Trend Reversal Mode
Trades occur when the mean slope direction changes, i.e., basis line changes color.
Helps capture early trend shifts with less lag.
Each mode can be customized for long-only, short-only, or long & short execution.
Visual Components
1. Z-Score Mean Line
The basis (mean) line is colored based on slope direction.
Green = bullish slope, Purple = bearish slope, Gray = flat.
A wide shadow band underneath reflects current trend momentum.
2. Gradient Fill to Price
A gradient zone between price and the mean reflects:
Price above mean = bearish zone with purple overlay.
Price below mean = bullish zone with teal overlay.
This visual aid quickly reveals market positioning relative to equilibrium.
3. Signal Markers
"𝓤𝓹" labels appear for buy signals.
"𝓓𝓸𝔀𝓷" labels appear for sell signals.
These are colored and positioned according to trend context.
Customization Options
Z-Score Period & Thresholds: Define sensitivity to price deviations.
EMA Trend Filter Length: Filter entries with long-term bias.
RSI & Smoothing Periods: Fine-tune RSI confirmation conditions.
Cooldown Period: Prevent signal spam and enforce timing gaps.
Slope Index: Adjust how far back to compare mean slope.
Visual Settings: Toggle mean lines, gradients, and more.
Use Cases & Strategy Strengths
1. Mean-Reversion Trading
Ideal for catching pullbacks in trending markets or fading overextended price moves.
2. Trend Continuation or Reversal
With multiple trade modes, traders can choose between fading price extremes or trading slope momentum.
3. Signal Clarity and Risk Control
The combination of Z-score, RSI, EMA trend, and cooldown logic provides high-confidence signals with built-in filters.
Conclusion
The Z-Score Flow Strategy by Uptrick X PineIndicators is a versatile and structured trading system that:
Fuses statistical deviation (Z-score) with technical filters.
Provides both mean-reversion and trend-based entry logic.
Uses visual overlays and signal labels for clarity.
Prevents noise-driven trades via cooldown and lockout systems.
This strategy is well-suited for traders seeking a data-driven, multi-condition entry framework that can adapt to various market types.
Full credit for the original concept and indicator goes to Uptrick.
Tìm kiếm tập lệnh với "momentum"

ATM Option Selling StrategyATM Option Selling Strategy – Explained
This strategy is designed for intraday option selling based on the 9/15 EMA crossover, 50/80 MA trend filter, and RSI 50 level. It ensures that all trades are exited before market close (3:24 PM IST).
. Indicators Used:
9 EMA & 15 EMA → For short-term trend identification.
50 MA & 80 MA → To determine the overall trend.
RSI (14) → To confirm momentum (above or below 50 level).
2. Entry Conditions:
🔴 Sell ATM Call (CE) when:
Price is below 50 & 80 MA (Bearish trend).
9 EMA crosses below 15 EMA (Short-term trend turns bearish).
RSI is below 50 (Momentum confirms weakness).
🟢 Sell ATM Put (PE) when:
Price is above 50 & 80 MA (Bullish trend).
9 EMA crosses above 15 EMA (Short-term trend turns bullish).
RSI is above 50 (Momentum confirms strength).
3. Position Sizing & Risk Management:
Sell 375 quantity per trade (Lot size).
50-Point Stop Loss → If option premium moves against us by 50 points, exit.
50-Point Take Profit → If option premium moves in our favor by 50 points, book profit.
Exit all trades at 3:24 PM IST → No overnight positions.
4. Exit Conditions:
✅ Stop Loss or Take Profit Hits → Automatically exits based on a 50-point move.
✅ Time-Based Exit at 3:24 PM → Ensures no open positions at market close.
Why This Works?
✔ Trend Confirmation → 50/80 MA ensures we only sell options in the direction of the market trend.
✔ Momentum Confirmation → RSI prevents entering weak trades.
✔ Controlled Risk → SL and TP protect against large losses.
✔ No Overnight Risk → All trades close before market close.

Enhanced Range Filter Strategy with ATR TP/SLBuilt by Omotola
## **Enhanced Range Filter Strategy: A Comprehensive Overview**
### **1. Introduction**
The **Enhanced Range Filter Strategy** is a powerful technical trading system designed to identify high-probability trading opportunities while filtering out market noise. It utilizes **range-based trend filtering**, **momentum confirmation**, and **volatility-based risk management** to generate precise entry and exit signals. This strategy is particularly useful for traders who aim to capitalize on trend-following setups while avoiding choppy, ranging market conditions.
---
### **2. Key Components of the Strategy**
#### **A. Range Filter (Trend Determination)**
- The **Range Filter** smooths price fluctuations and helps identify clear trends.
- It calculates an **adjusted price range** based on a **sampling period** and a **multiplier**, ensuring a dynamic trend-following approach.
- **Uptrends:** When the current price is above the range filter and the trend is strengthening.
- **Downtrends:** When the price falls below the range filter and momentum confirms the move.
#### **B. RSI (Relative Strength Index) as Momentum Confirmation**
- RSI is used to **filter out weak trades** and prevent entries during overbought/oversold conditions.
- **Buy Signals:** RSI is above a certain threshold (e.g., 50) in an uptrend.
- **Sell Signals:** RSI is below a certain threshold (e.g., 50) in a downtrend.
#### **C. ADX (Average Directional Index) for Trend Strength Confirmation**
- ADX ensures that trades are only taken when the trend has **sufficient strength**.
- Avoids trading in low-volatility, ranging markets.
- **Threshold (e.g., 25):** Only trade when ADX is above this value, indicating a strong trend.
#### **D. ATR (Average True Range) for Risk Management**
- **Stop Loss (SL):** Placed **one ATR below** (for long trades) or **one ATR above** (for short trades).
- **Take Profit (TP):** Set at a **3:1 reward-to-risk ratio**, using ATR to determine realistic price targets.
- Ensures volatility-adjusted risk management.
---
### **3. Entry and Exit Conditions**
#### **📈 Buy (Long) Entry Conditions:**
1. **Price is above the Range Filter** → Indicates an uptrend.
2. **Upward trend strength is positive** (confirmed via trend counter).
3. **RSI is above the buy threshold** (e.g., 50, to confirm momentum).
4. **ADX confirms trend strength** (e.g., above 25).
5. **Volatility is supportive** (using ATR analysis).
#### **📉 Sell (Short) Entry Conditions:**
1. **Price is below the Range Filter** → Indicates a downtrend.
2. **Downward trend strength is positive** (confirmed via trend counter).
3. **RSI is below the sell threshold** (e.g., 50, to confirm momentum).
4. **ADX confirms trend strength** (e.g., above 25).
5. **Volatility is supportive** (using ATR analysis).
#### **🚪 Exit Conditions:**
- **Stop Loss (SL):**
- **Long Trades:** 1 ATR below entry price.
- **Short Trades:** 1 ATR above entry price.
- **Take Profit (TP):**
- Set at **3x the risk distance** to achieve a favorable risk-reward ratio.
- **Ranging Market Exit:**
- If ADX falls below the threshold, indicating a weakening trend.
---
### **4. Visualization & Alerts**
- **Colored range filter line** changes based on trend direction.
- **Buy and Sell signals** appear as labels on the chart.
- **Stop Loss and Take Profit levels** are plotted as dashed lines.
- **Gray background highlights ranging markets** where trading is avoided.
- **Alerts trigger on Buy, Sell, and Ranging Market conditions** for automation.
---
### **5. Advantages of the Enhanced Range Filter Strategy**
✅ **Trend-Following with Noise Reduction** → Helps avoid false signals by filtering out weak trends.
✅ **Momentum Confirmation with RSI & ADX** → Ensures that only strong, valid trades are executed.
✅ **Volatility-Based Risk Management** → ATR ensures adaptive stop loss and take profit placements.
✅ **Works on Multiple Timeframes** → Effective for day trading, swing trading, and scalping.
✅ **Visually Intuitive** → Clearly displays trade signals, SL/TP levels, and trend conditions.
---
### **6. Who Should Use This Strategy?**
✔ **Trend Traders** who want to enter trades with momentum confirmation.
✔ **Swing Traders** looking for medium-term opportunities with a solid risk-reward ratio.
✔ **Scalpers** who need precise entries and exits to minimize false signals.
✔ **Algorithmic Traders** using alerts for automated execution.
---
### **7. Conclusion**
The **Enhanced Range Filter Strategy** is a powerful trading tool that combines **trend-following techniques, momentum indicators, and risk management** into a structured, rule-based system. By leveraging **Range Filters, RSI, ADX, and ATR**, traders can improve trade accuracy, manage risk effectively, and filter out unfavorable market conditions.
This strategy is **ideal for traders looking for a systematic, disciplined approach** to capturing trends while **avoiding market noise and false breakouts**. 🚀

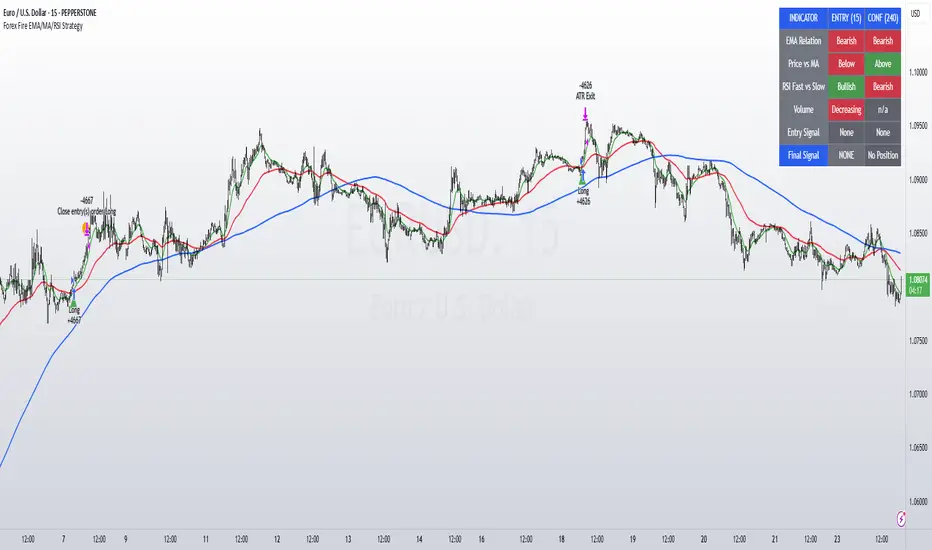
Forex Fire EMA/MA/RSI StrategyEURUSD
The entry method in the Forex Fire EMA/MA/RSI Strategy combines several conditions across two timeframes. Here's a breakdown of how entries are determined:
Long Entry Conditions:
15-Minute Timeframe Conditions:
EMA 13 > EMA 62 (short-term momentum is bullish)
Price > MA 200 (trading above the major trend indicator)
Fast RSI (7) > Slow RSI (28) (momentum is increasing)
Fast RSI > 50 (showing bullish momentum)
Volume is increasing compared to 20-period average
4-Hour Timeframe Confluence:
EMA 13 > EMA 62 (larger timeframe confirms bullish trend)
Price > MA 200 (confirming overall uptrend)
Slow RSI (28) > 40 (showing bullish bias)
Fast RSI > Slow RSI (momentum is supporting the move)
Additional Precision Requirement:
Either EMA 13 has just crossed above EMA 62 (crossover)
OR price has just crossed above MA 200
Short Entry Conditions:
15-Minute Timeframe Conditions:
EMA 13 < EMA 62 (short-term momentum is bearish)
Price < MA 200 (trading below the major trend indicator)
Fast RSI (7) < Slow RSI (28) (momentum is decreasing)
Fast RSI < 50 (showing bearish momentum)
Volume is increasing compared to 20-period average
4-Hour Timeframe Confluence:
EMA 13 < EMA 62 (larger timeframe confirms bearish trend)
Price < MA 200 (confirming overall downtrend)
Slow RSI (28) < 60 (showing bearish bias)
Fast RSI < Slow RSI (momentum is supporting the move)
Additional Precision Requirement:
Either EMA 13 has just crossed under EMA 62 (crossunder)
OR price has just crossed under MA 200
The key aspect of this strategy is that it requires alignment between the shorter timeframe (15m) and the larger timeframe (4h), which helps filter out false signals and focuses on trades that have strong multi-timeframe support. The crossover/crossunder requirement further refines entries by looking for actual changes in direction rather than just conditions that might have been in place for a long time.
Keltner Channel StrategyOverview
The Keltner Channel Strategy is a powerful trend-following and mean-reversion system that leverages the Keltner Channels, EMA crossovers, and ATR-based stop-losses to optimize trade entries and exits. This strategy has proven to be highly effective, particularly when applied to Gold (XAUUSD) and other commodities with strong trend characteristics.
📈 How It Works
This strategy incorporates two trading approaches: 1️⃣ Keltner Channel Reversal Trades – Identifies overbought and oversold conditions when price touches the outer bands.
2️⃣ Trend Following Trades – Uses the 9 EMA & 21 EMA crossover, with confirmation from the 50 EMA, to enter trades in the direction of the trend.
🔍 Entry & Exit Criteria
📊 Keltner Channel Entries (Reversal Strategy)
✅ Long Entry: When the price crosses below the lower Keltner Band (potential reversal).
✅ Short Entry: When the price crosses above the upper Keltner Band (potential reversal).
⏳ Exit Conditions:
Long positions close when price crosses back above the mid-band (EMA-based).
Short positions close when price crosses back below the mid-band (EMA-based).
📈 Trend Following Entries (Momentum Strategy)
✅ Long Entry: When the 9 EMA crosses above the 21 EMA, and price is above the 50 EMA (bullish momentum).
✅ Short Entry: When the 9 EMA crosses below the 21 EMA, and price is below the 50 EMA (bearish momentum).
⏳ Exit Conditions:
Long positions close when the 9 EMA crosses back below the 21 EMA.
Short positions close when the 9 EMA crosses back above the 21 EMA.
📌 Risk Management & Profit Targeting
ATR-based Stop-Losses:
Long trades: Stop set at 1.5x ATR below entry price.
Short trades: Stop set at 1.5x ATR above entry price.
Take-Profit Levels:
Long trades: Profit target 2x ATR above entry price.
Short trades: Profit target 2x ATR below entry price.
🚀 Why Use This Strategy?
✅ Works exceptionally well on Gold (XAUUSD) due to high volatility.
✅ Combines reversal & trend strategies for improved adaptability.
✅ Uses ATR-based risk management for dynamic position sizing.
✅ Fully automated alerts for trade entries and exits.
🔔 Alerts
This script includes automated TradingView alerts for:
🔹 Keltner Band touches (Reversal signals).
🔹 EMA crossovers (Momentum trades).
🔹 Stop-loss & Take-profit activations.
📊 Ideal Markets & Timeframes
Best for: Gold (XAUUSD), NASDAQ (NQ), Crude Oil (CL), and trending assets.
Recommended Timeframes: 15m, 1H, 4H, Daily.
⚡️ How to Use
1️⃣ Add this script to your TradingView chart.
2️⃣ Select a 15m, 1H, or 4H timeframe for optimal results.
3️⃣ Enable alerts to receive trade notifications in real time.
4️⃣ Backtest and tweak ATR settings to fit your trading style.
🚀 Optimize your Gold trading with this Keltner Channel Strategy! Let me know how it performs for you. 💰📊

iD EMARSI on ChartSCRIPT OVERVIEW
The EMARSI indicator is an advanced technical analysis tool that maps RSI values directly onto price charts. With adaptive scaling capabilities, it provides a unique visualization of momentum that flows naturally with price action, making it particularly valuable for FOREX and low-priced securities trading.
KEY FEATURES
1 PRICE MAPPED RSI VISUALIZATION
Unlike traditional RSI that displays in a separate window, EMARSI plots the RSI directly on the price chart, creating a flowing line that identifies momentum shifts within the context of price action:
// Map RSI to price chart with better scaling
mappedRsi = useAdaptiveScaling ?
median + ((rsi - 50) / 50 * (pQH - pQL) / 2 * math.min(1.0, 1/scalingFactor)) :
down == pQL ? pQH : up == pQL ? pQL : median - (median / (1 + up / down))
2 ADAPTIVE SCALING SYSTEM
The script features an intelligent scaling system that automatically adjusts to different market conditions and price levels:
// Calculate adaptive scaling factor based on selected method
scalingFactor = if scalingMethod == "ATR-Based"
math.min(maxScalingFactor, math.max(1.0, minTickSize / (atrValue/avgPrice)))
else if scalingMethod == "Price-Based"
math.min(maxScalingFactor, math.max(1.0, math.sqrt(100 / math.max(avgPrice, 0.01))))
else // Volume-Based
math.min(maxScalingFactor, math.max(1.0, math.sqrt(1000000 / math.max(volume, 100))))
3 MODIFIED RSI CALCULATION
EMARSI uses a specially formulated RSI calculation that works with an adaptive base value to maintain consistency across different price ranges:
// Adaptive RSI Base based on price levels to improve flow
adaptiveRsiBase = useAdaptiveScaling ? rsiBase * scalingFactor : rsiBase
// Calculate RSI components with adaptivity
up = ta.rma(math.max(ta.change(rsiSourceInput), adaptiveRsiBase), emaSlowLength)
down = ta.rma(-math.min(ta.change(rsiSourceInput), adaptiveRsiBase), rsiLengthInput)
// Improved RSI calculation with value constraint
rsi = down == 0 ? 100 : up == 0 ? 0 : 100 - (100 / (1 + up / down))
4 MOVING AVERAGE CROSSOVER SYSTEM
The indicator creates a smooth moving average of the RSI line, enabling a crossover system that generates trading signals:
// Calculate MA of mapped RSI
rsiMA = ma(mappedRsi, emaSlowLength, maTypeInput)
// Strategy entries
if ta.crossover(mappedRsi, rsiMA)
strategy.entry("RSI Long", strategy.long)
if ta.crossunder(mappedRsi, rsiMA)
strategy.entry("RSI Short", strategy.short)
5 VISUAL REFERENCE FRAMEWORK
The script includes visual guides that help interpret the RSI movement within the context of recent price action:
// Calculate pivot high and low
pQH = ta.highest(high, hlLen)
pQL = ta.lowest(low, hlLen)
median = (pQH + pQL) / 2
// Plotting
plot(pQH, "Pivot High", color=color.rgb(82, 228, 102, 90))
plot(pQL, "Pivot Low", color=color.rgb(231, 65, 65, 90))
med = plot(median, style=plot.style_steplinebr, linewidth=1, color=color.rgb(238, 101, 59, 90))
6 DYNAMIC COLOR SYSTEM
The indicator uses color fills to clearly visualize the relationship between the RSI and its moving average:
// Color fills based on RSI vs MA
colUp = mappedRsi > rsiMA ? input.color(color.rgb(128, 255, 0), '', group= 'RSI > EMA', inline= 'up') :
input.color(color.rgb(240, 9, 9, 95), '', group= 'RSI < EMA', inline= 'dn')
colDn = mappedRsi > rsiMA ? input.color(color.rgb(0, 230, 35, 95), '', group= 'RSI > EMA', inline= 'up') :
input.color(color.rgb(255, 47, 0), '', group= 'RSI < EMA', inline= 'dn')
fill(rsiPlot, emarsi, mappedRsi > rsiMA ? pQH : rsiMA, mappedRsi > rsiMA ? rsiMA : pQL, colUp, colDn)
7 REAL TIME PARAMETER MONITORING
A transparent information panel provides real-time feedback on the adaptive parameters being applied:
// Information display
var table infoPanel = table.new(position.top_right, 2, 3, bgcolor=color.rgb(0, 0, 0, 80))
if barstate.islast
table.cell(infoPanel, 0, 0, "Current Scaling Factor", text_color=color.white)
table.cell(infoPanel, 1, 0, str.tostring(scalingFactor, "#.###"), text_color=color.white)
table.cell(infoPanel, 0, 1, "Adaptive RSI Base", text_color=color.white)
table.cell(infoPanel, 1, 1, str.tostring(adaptiveRsiBase, "#.####"), text_color=color.white)
BENEFITS FOR TRADERS
INTUITIVE MOMENTUM VISUALIZATION
By mapping RSI directly onto the price chart, traders can immediately see the relationship between momentum and price without switching between different indicator windows.
ADAPTIVE TO ANY MARKET CONDITION
The three scaling methods (ATR-Based, Price-Based, and Volume-Based) ensure the indicator performs consistently across different market conditions, volatility regimes, and price levels.
PREVENTS EXTREME VALUES
The adaptive scaling system prevents the RSI from generating extreme values that exceed chart boundaries when trading low-priced securities or during high volatility periods.
CLEAR TRADING SIGNALS
The RSI and moving average crossover system provides clear entry signals that are visually reinforced through color changes, making it easy to identify potential trading opportunities.
SUITABLE FOR MULTIPLE TIMEFRAMES
The indicator works effectively across multiple timeframes, from intraday to daily charts, making it versatile for different trading styles and strategies.
TRANSPARENT PARAMETER ADJUSTMENT
The information panel provides real-time feedback on how the adaptive system is adjusting to current market conditions, helping traders understand why the indicator is behaving as it is.
CUSTOMIZABLE VISUALIZATION
Multiple visualization options including Bollinger Bands, different moving average types, and customizable colors allow traders to adapt the indicator to their personal preferences.
CONCLUSION
The EMARSI indicator represents a significant advancement in RSI visualization by directly mapping momentum onto price charts with adaptive scaling. This approach makes momentum shifts more intuitive to identify and helps prevent the scaling issues that commonly affect RSI-based indicators when applied to low-priced securities or volatile markets.

RSI + Stochastic + WMA StrategyThis script is designed for TradingView and serves as a trading strategy (not just a visual indicator). It's intended for backtesting, strategy optimization, or live trading signal generation using a combination of popular technical indicators.
📊 Indicators Used in the Strategy:
Indicator Description
RSI (Relative Strength Index) Measures momentum; identifies overbought (>70) or oversold (<30) conditions.
Stochastic Oscillator (%K & %D) Detects momentum reversal points via crossovers. Useful for timing entries.
WMA (Weighted Moving Average) Identifies the trend direction (used as a trend filter).
📈 Trading Logic / Strategy Rules:
📌 Long Entry Condition (Buy Signal):
All 3 conditions must be true:
RSI is Oversold → RSI < 30
Stochastic Crossover Upward → %K crosses above %D
Price is above WMA → Confirms uptrend direction
👉 Interpretation: Market was oversold, momentum is turning up, and price confirms uptrend — bullish entry.
📌 Short Entry Condition (Sell Signal):
All 3 conditions must be true:
RSI is Overbought → RSI > 70
Stochastic Crossover Downward → %K crosses below %D
Price is below WMA → Confirms downtrend direction
👉 Interpretation: Market is overbought, momentum is turning down, and price confirms downtrend — bearish entry.
🔄 Strategy Execution (Backtesting Logic):
The script uses:
pinescript
Copy
Edit
strategy.entry("LONG", strategy.long)
strategy.entry("SHORT", strategy.short)
These are Pine Script functions to place buy and sell orders automatically when the above conditions are met. This allows you to:
Backtest the strategy
Measure win/loss ratio, drawdown, and profitability
Optimize indicator settings using TradingView Strategy Tester
📊 Visual Aids (Charts):
Plots WMA Line: Orange line for trend direction
Overbought/Oversold Zones: Horizontal lines at 70 (red) and 30 (green) for RSI visualization
⚡ Strategy Type Summary:
Category Setting
Strategy Type Momentum Reversal + Trend Filter
Timeframe Flexible (Works best on 1H, 4H, Daily)
Trading Style Swing/Intraday
Risk Profile Medium to High (due to momentum triggers)
Uses Leverage Possible (adjust risk accordingly)

Market Trend Levels Non-Repainting [BigBeluga X PineIndicators]This strategy is based on the Market Trend Levels Detector developed by BigBeluga. Full credit for the concept and original indicator goes to BigBeluga.
The Market Trend Levels Detector Strategy is a non-repainting trend-following strategy that identifies market trend shifts using two Exponential Moving Averages (EMA). It also detects key price levels and allows traders to apply multiple filters to refine trade entries and exits.
This strategy is designed for trend trading and enables traders to:
Identify trend direction based on EMA crossovers.
Detect significant market levels using labeled trend lines.
Use multiple filter conditions to improve trade accuracy.
Avoid false signals through non-repainting calculations.
How the Market Trend Levels Detector Strategy Works
1. Core Trend Detection Using EMA Crossovers
The strategy detects trend shifts using two EMAs:
Fast EMA (default: 12 periods) – Reacts quickly to price movements.
Slow EMA (default: 25 periods) – Provides a smoother trend confirmation.
A bullish crossover (Fast EMA crosses above Slow EMA) signals an uptrend , while a bearish crossover (Fast EMA crosses below Slow EMA) signals a downtrend .
2. Market Level Detection & Visualization
Each time an EMA crossover occurs, a trend level line is drawn:
Bullish crossover → A green line is drawn at the low of the crossover candle.
Bearish crossover → A purple line is drawn at the high of the crossover candle.
Lines can be extended to act as support and resistance zones for future price action.
Additionally, a small label (●) appears at each crossover to mark the event on the chart.
3. Trade Entry & Exit Conditions
The strategy allows users to choose between three trading modes:
Long Only – Only enters long trades.
Short Only – Only enters short trades.
Long & Short – Trades in both directions.
Entry Conditions
Long Entry:
A bullish EMA crossover occurs.
The trade direction setting allows long trades.
Filter conditions (if enabled) confirm a valid long signal.
Short Entry:
A bearish EMA crossover occurs.
The trade direction setting allows short trades.
Filter conditions (if enabled) confirm a valid short signal.
Exit Conditions
Long Exit:
A bearish EMA crossover occurs.
Exit filters (if enabled) indicate an invalid long position.
Short Exit:
A bullish EMA crossover occurs.
Exit filters (if enabled) indicate an invalid short position.
Additional Trade Filters
To improve trade accuracy, the strategy allows traders to apply up to 7 additional filters:
RSI Filter: Only trades when RSI confirms a valid trend.
MACD Filter: Ensures MACD histogram supports the trade direction.
Stochastic Filter: Requires %K line to be above/below threshold values.
Bollinger Bands Filter: Confirms price position relative to the middle BB line.
ADX Filter: Ensures the trend strength is above a set threshold.
CCI Filter: Requires CCI to indicate momentum in the right direction.
Williams %R Filter: Ensures price momentum supports the trade.
Filters can be enabled or disabled individually based on trader preference.
Dynamic Level Extension Feature
The strategy provides an optional feature to extend trend lines until price interacts with them again:
Bullish support lines extend until price revisits them.
Bearish resistance lines extend until price revisits them.
If price breaks a line, the line turns into a dotted style , indicating it has been breached.
This helps traders identify key levels where trend shifts previously occurred, providing useful support and resistance insights.
Customization Options
The strategy includes several adjustable settings :
Trade Direction: Choose between Long Only, Short Only, or Long & Short.
Trend Lengths: Adjust the Fast & Slow EMA lengths.
Market Level Extension: Decide whether to extend support/resistance lines.
Filters for Trade Confirmation: Enable/disable individual filters.
Color Settings: Customize line colors for bullish and bearish trend shifts.
Maximum Displayed Lines: Limit the number of drawn support/resistance lines.
Considerations & Limitations
Trend Lag: As with any EMA-based strategy, signals may be slightly delayed compared to price action.
Sideways Markets: This strategy works best in trending conditions; frequent crossovers in sideways markets can produce false signals.
Filter Usage: Enabling multiple filters may reduce trade frequency, but can also improve trade quality.
Line Overlap: If many crossovers occur in a short period, the chart may become cluttered with multiple trend levels. Adjusting the "Display Last" setting can help.
Conclusion
The Market Trend Levels Detector Strategy is a non-repainting trend-following system that combines EMA crossovers, market level detection, and customizable filters to improve trade accuracy.
By identifying trend shifts and key price levels, this strategy can be used for:
Trend Confirmation – Using EMA crossovers and filters to confirm trend direction.
Support & Resistance Trading – Identifying dynamic levels where price reacts.
Momentum-Based Trading – Combining EMA crossovers with additional momentum filters.
This strategy is fully customizable and can be adapted to different trading styles, timeframes, and market conditions.
Full credit for the original concept and indicator goes to BigBeluga.

RSI, Volume, MACD, EMA ComboRSI + Volume + MACD + EMA Trading System
This script combines four powerful indicators—Relative Strength Index (RSI), Volume, Moving Average Convergence Divergence (MACD), and Exponential Moving Average (EMA)—to create a comprehensive trading strategy for better trend confirmation and trade entries.
How It Works
RSI (Relative Strength Index)
Helps identify overbought and oversold conditions.
Used to confirm momentum strength before taking a trade.
Volume
Confirms the strength of price movements.
Avoids false signals by ensuring there is sufficient trading activity.
MACD (Moving Average Convergence Divergence)
Confirms trend direction and momentum shifts.
Provides buy/sell signals through MACD line crossovers.
EMA (Exponential Moving Average)
Acts as a dynamic support and resistance level.
Helps filter out trades that go against the overall trend.
Trading Logic
Buy Signal:
RSI is above 50 (bullish momentum).
MACD shows a bullish crossover.
The price is above the EMA (trend confirmation).
Volume is increasing (strong participation).
Sell Signal:
RSI is below 50 (bearish momentum).
MACD shows a bearish crossover.
The price is below the EMA (downtrend confirmation).
Volume is increasing (intense selling pressure).
Backtesting & Risk Management
The strategy is optimized for scalping on the 1-minute timeframe (adjustable for other timeframes).
Default settings use realistic commission and slippage to simulate actual trading conditions.
A stop-loss and take-profit system is integrated to manage risk effectively.
This script is designed to help traders filter out false signals, improve trend confirmation, and increase trade accuracy by combining multiple indicators in a structured way.

Ultimate Trading BotHow the "Ultimate Trading Bot" Works:
This Pine Script trading bot executes buy and sell trades based on a combination of technical indicators:
Indicators Used:
RSI (Relative Strength Index)
Measures momentum and determines overbought (70) and oversold (30) levels.
A crossover above 30 suggests a potential buy, and a cross below 70 suggests a potential sell.
Moving Average (MA)
A simple moving average (SMA) of 50 periods to track the trend.
Prices above the MA indicate an uptrend, while prices below indicate a downtrend.
Stochastic Oscillator (%K and %D)
Identifies overbought and oversold conditions using a smoothed stochastic formula.
A crossover of %K above %D signals a buy, and a crossover below %D signals a sell.
MACD (Moving Average Convergence Divergence)
Uses a 12-period fast EMA and a 26-period slow EMA, with a 9-period signal line.
A crossover of MACD above the signal line suggests a bullish move, and a cross below suggests bearish movement.
Trade Execution:
Buy (Long Entry) Conditions:
RSI crosses above 30 (indicating recovery from an oversold state).
The closing price is above the 50-period moving average (showing an uptrend).
The MACD line crosses above the signal line (indicating upward momentum).
The Stochastic %K crosses above %D (indicating bullish momentum).
→ If all conditions are met, the bot enters a long (buy) position.
Sell (Exit Trade) Conditions:
RSI crosses below 70 (indicating overbought conditions).
The closing price is below the 50-period moving average (downtrend).
The MACD line crosses below the signal line (bearish signal).
The Stochastic %K crosses below %D (bearish momentum).
→ If all conditions are met, the bot closes the long position.
Visuals:
The bot plots the moving average, RSI, MACD, and Stochastic indicators for reference.
It also displays buy/sell signals with arrows:
Green arrow (Buy Signal) → When all buy conditions are met.
Red arrow (Sell Signal) → When all sell conditions are met.
How to Use It in TradingView:

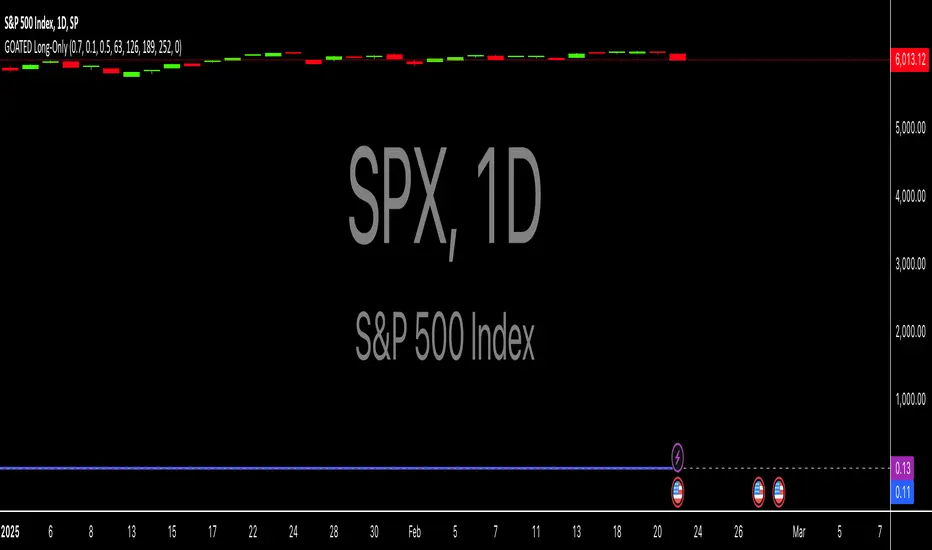
Long-Only For SPXThe "GOATED Long-Only" TradingView strategy, written in Pine Script v5, is designed for long-term momentum trading with a $50 initial capital. It identifies high-momentum stocks by calculating a composite momentum score across 3-month (63 days), 6-month (126 days), 9-month (189 days), and 12-month (252 days) periods, using the formula (current_price / past_price) - 1. The strategy filters stocks with annualized volatility below 0.5 (calculated as the standard deviation of daily returns, annualized by multiplying by the square root of 252 trading days) and requires momentum to exceed a customizable threshold (default 0.0). It enters long positions when momentum becomes positive and exits when it turns negative, using stop-loss (1%) and take-profit (50%) levels to manage risk. The strategy visualizes momentum and volatility on the chart, plotting entry/exit signals as green triangles (long entry) and red triangles (long exit) for backtesting and analysis.
Gold Pro StrategyHere’s the strategy description in a chat format:
---
**Gold (XAU/USD) Trend-Following Strategy**
This **trend-following strategy** is designed for trading gold (XAU/USD) by combining moving averages, MACD momentum indicators, and RSI filters to capture sustained trends while managing volatility risks. The strategy uses volatility-adjusted stops to protect gains and prevent overexposure during erratic price movements. The aim is to take advantage of trending markets by confirming momentum and ensuring entries are not made at extreme levels.
---
**Key Components**
1. **Trend Identification**
- **50 vs 200 EMA Crossover**
- **Bullish Trend:** 50 EMA crosses above 200 EMA, and the price closes above the 200 EMA
- **Bearish Trend:** 50 EMA crosses below 200 EMA, and the price closes below the 200 EMA
2. **Momentum Confirmation**
- **MACD (12,26,9)**
- **Buy Signal:** MACD line crosses above the signal line
- **Sell Signal:** MACD line crosses below the signal line
- **RSI (14 Period)**
- **Bullish Zone:** RSI between 50-70 to avoid overbought conditions
- **Bearish Zone:** RSI between 30-50 to avoid oversold conditions
3. **Entry Criteria**
- **Long Entry:** Bullish trend, MACD bullish crossover, and RSI between 50-70
- **Short Entry:** Bearish trend, MACD bearish crossover, and RSI between 30-50
4. **Exit & Risk Management**
- **ATR Trailing Stops (14 Period):**
- Initial Stop: 3x ATR from entry price
- Trailing Stop: Adjusts to lock in profits as price moves favorably
- **Position Sizing:** 100% of equity per trade (high-risk strategy)
---
**Key Logic Flow**
1. **Trend Filter:** Use the 50/200 EMA relationship to define the market's direction
2. **Momentum Confirmation:** Confirm trend momentum with MACD crossovers
3. **RSI Validation:** Ensure RSI is within non-extreme ranges before entering trades
4. **Volatility-Based Risk Management:** Use ATR stops to manage market volatility
---
**Visual Cues**
- **Blue Line:** 50 EMA
- **Red Line:** 200 EMA
- **Green Triangles:** Long entry signals
- **Red Triangles:** Short entry signals
---
**Strengths**
- **Clear Trend Focus:** Avoids counter-trend trades
- **RSI Filter:** Prevents entering overbought or oversold conditions
- **ATR Stops:** Adapts to gold’s inherent volatility
- **Simple Rules:** Easy to follow with minimal inputs
---
**Weaknesses & Risks**
- **Infrequent Signals:** 50/200 EMA crossovers are rare
- **Potential Missed Opportunities:** Strict RSI criteria may miss some valid trends
- **Aggressive Position Sizing:** 100% equity allocation can lead to large drawdowns
- **No Profit Targets:** Relies on trailing stops rather than defined exit targets
---
**Performance Profile**
| Metric | Expected Range |
|----------------------|---------------------|
| Annual Trades | 4-8 |
| Win Rate | 55-65% |
| Max Drawdown | 25-35% |
| Profit Factor | 1.8-2.5 |
---
**Optimization Recommendations**
1. **Increase Trade Frequency**
Adjust the EMAs to shorter periods:
- `emaFastLen = input.int(30, "Fast EMA")`
- `emaSlowLen = input.int(150, "Slow EMA")`
2. **Relax RSI Filters**
Adjust the RSI range to:
- `rsiBullish = rsi > 45 and rsi < 75`
- `rsiBearish = rsi < 55 and rsi > 25`
3. **Add Profit Targets**
Introduce a profit target at 1.5% above entry:
```pine
strategy.exit("Long Exit", "Long",
stop=longStopPrice,
profit=close*1.015, // 1.5% target
trail_offset=trailOffset)
```
4. **Reduce Position Sizing**
Risk a smaller percentage per trade:
- `default_qty_value=25`
---
**Best Use Case**
This strategy excels in **strong trending markets** such as gold rallies during economic or geopolitical crises. However, during sideways or choppy market conditions, the strategy might require manual intervention to avoid false signals. Additionally, integrating fundamental analysis—like monitoring USD weakness or geopolitical risks—can enhance its effectiveness.
---
This strategy offers a balanced approach for trading gold, combining trend-following principles with risk management tailored to the volatility of the market.

3 EMA + RSI with Trail Stop [Free990] (LOW TF)This trading strategy combines three Exponential Moving Averages (EMAs) to identify trend direction, uses RSI to signal exit conditions, and applies both a fixed percentage stop-loss and a trailing stop for risk management. It aims to capture momentum when the faster EMAs cross the slower EMA, then uses RSI thresholds, time-based exits, and stops to close trades.
Short Explanation of the Logic
Trend Detection: When the 10 EMA crosses above the 20 EMA and both are above the 100 EMA (and the current price bar closes higher), it triggers a long entry signal. The reverse happens for a short (the 10 EMA crosses below the 20 EMA and both are below the 100 EMA).
RSI Exit: RSI crossing above a set threshold closes long trades; crossing below another threshold closes short trades.
Time-Based Exit: If a trade is in profit after a set number of bars, the strategy closes it.
Stop-Loss & Trailing Stop: A fixed stop-loss based on a percentage from the entry price guards against large drawdowns. A trailing stop dynamically tightens as the trade moves in favor, locking in potential gains.
Detailed Explanation of the Strategy Logic
Exponential Moving Average (EMA) Setup
Short EMA (out_a, length=10)
Medium EMA (out_b, length=20)
Long EMA (out_c, length=100)
The code calculates three separate EMAs to gauge short-term, medium-term, and longer-term trend behavior. By comparing their relative positions, the strategy infers whether the market is bullish (EMAs stacked positively) or bearish (EMAs stacked negatively).
Entry Conditions
Long Entry (entryLong): Occurs when:
The short EMA (10) crosses above the medium EMA (20).
Both EMAs (short and medium) are above the long EMA (100).
The current bar closes higher than it opened (close > open).
This suggests that momentum is shifting to the upside (short-term EMAs crossing up and price action turning bullish). If there’s an existing short position, it’s closed first before opening a new long.
Short Entry (entryShort): Occurs when:
The short EMA (10) crosses below the medium EMA (20).
Both EMAs (short and medium) are below the long EMA (100).
The current bar closes lower than it opened (close < open).
This indicates a potential shift to the downside. If there’s an existing long position, that gets closed first before opening a new short.
Exit Signals
RSI-Based Exits:
For long trades: When RSI exceeds a specified threshold (e.g., 70 by default), it triggers a long exit. RSI > short_rsi generally means overbought conditions, so the strategy exits to lock in profits or avoid a pullback.
For short trades: When RSI dips below a specified threshold (e.g., 30 by default), it triggers a short exit. RSI < long_rsi indicates oversold conditions, so the strategy closes the short to avoid a bounce.
Time-Based Exit:
If the trade has been open for xBars bars (configurable, e.g., 24 bars) and the trade is in profit (current price above entry for a long, or current price below entry for a short), the strategy closes the position. This helps lock in gains if the move takes too long or momentum stalls.
Stop-Loss Management
Fixed Stop-Loss (% Based): Each trade has a fixed stop-loss calculated as a percentage from the average entry price.
For long positions, the stop-loss is set below the entry price by a user-defined percentage (fixStopLossPerc).
For short positions, the stop-loss is set above the entry price by the same percentage.
This mechanism prevents catastrophic losses if the market moves strongly against the position.
Trailing Stop:
The strategy also sets a trail stop using trail_points (the distance in price points) and trail_offset (how quickly the stop “catches up” to price).
As the market moves in favor of the trade, the trailing stop gradually tightens, allowing profits to run while still capping potential drawdowns if the price reverses.
Order Execution Flow
When the conditions for a new position (long or short) are triggered, the strategy first checks if there’s an opposite position open. If there is, it closes that position before opening the new one (prevents going “both long and short” simultaneously).
RSI-based and time-based exits are checked on each bar. If triggered, the position is closed.
If the position remains open, the fixed stop-loss and trailing stop remain in effect until the position is exited.
Why This Combination Works
Multiple EMA Cross: Combining 10, 20, and 100 EMAs balances short-term momentum detection with a longer-term trend filter. This reduces false signals that can occur if you only look at a single crossover without considering the broader trend.
RSI Exits: RSI provides a momentum oscillator view—helpful for detecting overbought/oversold conditions, acting as an extra confirmation to exit.
Time-Based Exit: Prevents “lingering trades.” If the position is in profit but failing to advance further, it takes profit rather than risking a trend reversal.
Fixed & Trailing Stop-Loss: The fixed stop-loss is your safety net to cap worst-case losses. The trailing stop allows the strategy to lock in gains by following the trade as it moves favorably, thus maximizing profit potential while keeping risk in check.
Overall, this approach tries to capture momentum from EMA crossovers, protect profits with trailing stops, and limit risk through both a fixed percentage stop-loss and exit signals from RSI/time-based logic.

NUTJP CDC ActionZone 20241. Core Components of the Strategy
• Fast EMA and Slow EMA:
• The Fast EMA (shorter period) is more reactive to recent price changes.
• The Slow EMA (longer period) reacts slower and provides a smoother view of the overall trend.
• Relationship Between Fast EMA and Slow EMA:
• When the Fast EMA is above the Slow EMA, the market is considered Bullish.
• When the Fast EMA is below the Slow EMA, the market is considered Bearish.
2. Zones Based on Price and EMAs
The strategy defines six zones based on the position of the price, Fast EMA, and Slow EMA:
1. Green Zone (Buy):
• Bullish trend (Fast EMA > Slow EMA)
• Price is above the Fast EMA.
• Indicates a strong uptrend and suggests buying.
2. Blue and Light Blue Zones (Pre-Buy):
• Price is above the Fast EMA but below or near the Slow EMA.
• Represents potential bullish signals but not strong enough to trigger a buy.
3. Red Zone (Sell):
• Bearish trend (Fast EMA < Slow EMA)
• Price is below the Fast EMA.
• Indicates a strong downtrend and suggests selling or avoiding long trades.
4. Orange and Yellow Zones (Pre-Sell):
• Price is below the Fast EMA but above or near the Slow EMA.
• Represents potential bearish signals but not strong enough to trigger a sell.
These zones help traders visualize the market conditions and determine whether to buy, hold, or sell.
3. Buy and Sell Conditions
• Buy Condition:
A buy signal is triggered when:
• The price enters the Green Zone (Bullish trend and price > Fast EMA).
• It’s the first green candle after a non-green candle.
• Sell Condition:
A sell signal is triggered when:
• The price enters the Red Zone (Bearish trend and price < Fast EMA).
• It’s the first red candle after a non-red candle.
4. Trade Execution Logic
• Buy:
The strategy enters a long position (buy) when the above buy condition is met.
• Sell:
The strategy exits the long position when the sell condition is met.
Note: It doesn’t support short trades, meaning it doesn’t enter sell positions.
5. Momentum-Based Signals (Optional)
The indicator also includes momentum signals using Stochastic RSI to provide additional buy/sell signals:
• These are based on oversold and overbought levels of the Stochastic RSI.
• It filters signals depending on whether the trend is Bullish or Bearish.
6. Visual Features
The indicator is designed to make the trading zones and signals visually intuitive:
• Bar Colors:
Candlesticks are colored based on the current zone (e.g., Green for Buy, Red for Sell).
• EMA Lines:
The Fast EMA and Slow EMA are plotted, making it easy to see crossover points.
• Buy/Sell Signals:
Marked with shapes (e.g., circles) below/above bars for clarity.
7. Strategy Assumptions
• Trend-Following Nature:
This strategy assumes that trends persist. It works best in trending markets but might give false signals in ranging markets.
• Lagging Nature of EMAs:
As EMAs are lagging indicators, buy and sell signals may occur after significant moves have already begun or ended.
• Momentum Confirmation (Optional):
Adding momentum signals can help filter false signals, though it’s not part of the core logic.
8. Usage Recommendations
• Timeframes:
Works on various timeframes but may perform better on higher timeframes (e.g., 1H, Daily) to reduce noise.
• Markets:
Can be applied to stocks, forex, and cryptocurrencies.
• Backtesting and Optimization:
Before live trading, backtest the strategy with different EMA periods and other parameters to find optimal settings for your market and timeframe.

Global Index Spread RSI StrategyThis strategy leverages the relative strength index (RSI) to monitor the price spread between a global benchmark index (such as AMEX) and the currently opened asset in the chart window. By calculating the spread between these two, the strategy uses RSI to identify oversold and overbought conditions to trigger buy and sell signals.
Key Components:
Global Benchmark Index: The strategy compares the current asset with a predefined global index (e.g., AMEX) to measure relative performance. The choice of a global benchmark allows the trader to analyze the current asset's movement in the context of broader market trends.
Spread Calculation:
The spread is calculated as the percentage difference between the current asset's closing price and the global benchmark index's closing price:
Spread=Current Asset Close−Global Index CloseGlobal Index Close×100
Spread=Global Index CloseCurrent Asset Close−Global Index Close×100
This metric provides a measure of how the current asset is performing relative to the global index. A positive spread indicates the asset is outperforming the benchmark, while a negative spread signals underperformance.
RSI of the Spread: The RSI is then calculated on the spread values. The RSI is a momentum oscillator that ranges from 0 to 100 and is commonly used to identify overbought or oversold conditions in asset prices. An RSI below 30 is considered oversold, indicating a potential buying opportunity, while an RSI above 70 is overbought, suggesting that the asset may be due for a pullback.
Strategy Logic:
Entry Condition: The strategy enters a long position when the RSI of the spread falls below the oversold threshold (default 30). This suggests that the asset may have been oversold relative to the global benchmark and might be due for a reversal.
Exit Condition: The strategy exits the long position when the RSI of the spread rises above the overbought threshold (default 70), indicating that the asset may have become overbought and a price correction is likely.
Visual Reference:
The RSI of the spread is plotted on the chart for visual reference, making it easier for traders to monitor the relative strength of the asset in relation to the global benchmark.
Overbought and oversold levels are also drawn as horizontal reference lines (70 and 30), along with a neutral level at 50 to show market equilibrium.
Theoretical Basis:
The strategy is built on the mean reversion principle, which suggests that asset prices tend to revert to a long-term average over time. When prices move too far from this mean—either being overbought or oversold—they are likely to correct back toward equilibrium. By using RSI to identify these extremes, the strategy aims to profit from price reversals.
Mean Reversion: According to financial theory, asset prices oscillate around a long-term average, and any extreme deviation (overbought or oversold conditions) presents opportunities for price corrections (Poterba & Summers, 1988).
Momentum Indicators (RSI): The RSI is widely used in technical analysis to measure the momentum of an asset. Its application to the spread between the asset and a global benchmark allows for a more nuanced view of relative performance and potential turning points in the asset's price trajectory.
Practical Application:
This strategy works best in markets where relative strength is a key factor in decision-making, such as in equity indices, commodities, or forex markets. By assessing the performance of the asset relative to a global benchmark and utilizing RSI to identify extremes in price movements, the strategy helps traders to make more informed decisions based on potential mean reversion points.
While the "Global Index Spread RSI Strategy" offers a method for identifying potential price reversals based on relative strength and oversold/overbought conditions, it is important to recognize that no strategy is foolproof. The strategy assumes that the historical relationship between the asset and the global benchmark will hold in the future, but financial markets are subject to a wide array of unpredictable factors that can lead to sudden changes in price behavior.
Risk of False Signals:
The strategy relies heavily on the RSI to trigger buy and sell signals. However, like any momentum-based indicator, RSI can generate false signals, particularly in highly volatile or trending markets. In such conditions, the strategy may enter positions too early or exit too late, leading to potential losses.
Market Context:
The strategy may not account for macroeconomic events, news, or other market forces that could cause sudden shifts in asset prices. External factors, such as geopolitical developments, monetary policy changes, or financial crises, can cause a divergence between the asset and the global benchmark, leading to incorrect conclusions from the strategy.
Overfitting Risk:
As with any strategy that uses historical data to make decisions, there is a risk of overfitting the model to past performance. This could result in a strategy that works well on historical data but performs poorly in live trading conditions due to changes in market dynamics.
Execution Risks:
The strategy does not account for slippage, transaction costs, or liquidity issues, which can impact the execution of trades in real-market conditions. In fast-moving markets, prices may move significantly between order placement and execution, leading to worse-than-expected entry or exit prices.
No Guarantee of Profit:
Past performance is not necessarily indicative of future results. The strategy should be used with caution, and risk management techniques (such as stop losses and position sizing) should always be implemented to protect against significant losses.
Traders should thoroughly test and adapt the strategy in a simulated environment before applying it to live trades, and consider seeking professional advice to ensure that their trading activities align with their risk tolerance and financial goals.
References:
Poterba, J. M., & Summers, L. H. (1988). Mean Reversion in Stock Prices: Evidence and Implications. Journal of Financial Economics, 22(1), 27-59.

XAUUSD Trend Strategy### Description of the XAUUSD Trading Strategy with Pine Script
This strategy is designed to trade gold (**XAUUSD**) using proven technical analysis principles. It combines key indicators such as **Exponential Moving Averages (EMA)**, the **Relative Strength Index (RSI)**, and **Bollinger Bands** to identify trading opportunities in trending market conditions.
---
#### Objective:
To maximize profits by identifying trend-aligned entry points while minimizing risks through well-defined Stop Loss and Take Profit levels.
---
### How It Works
1. **Indicators Used:**
- **Exponential Moving Averages (EMA):** Tracks short-term and long-term trends to confirm market direction.
- **Relative Strength Index (RSI):** Detects overbought or oversold conditions for potential reversals or trend continuation.
- **Bollinger Bands:** Measures volatility to identify breakout or reversion points.
2. **Entry Rules:**
- **Long (Buy):** Triggered when:
- The short-term EMA crosses above the long-term EMA (bullish trend confirmation).
- RSI exits oversold territory (<30), signaling buying momentum.
- The price breaks above the upper Bollinger Band, indicating a strong trend.
- **Short (Sell):** Triggered when:
- The short-term EMA crosses below the long-term EMA (bearish trend confirmation).
- RSI exits overbought territory (>70), signaling selling momentum.
- The price breaks below the lower Bollinger Band, indicating a strong downtrend.
3. **Risk Management:**
- **Stop Loss:** Automatically calculated based on a percentage of equity risk (customizable via inputs).
- **Take Profit:** Defined using a risk-to-reward ratio, ensuring consistent profitability when trades succeed.
4. **Visualization:**
- The chart displays the EMAs, Bollinger Bands, and entry/exit points for clear analysis.
---
### Key Features:
- **Customizable Parameters:** You can adjust EMAs, RSI thresholds, Bollinger Band settings, and risk levels to suit your trading style.
- **Alerts:** Automatic alerts for potential trade setups.
- **Backtesting-Ready:** Easily test historical performance on TradingView.
---
This strategy is ideal for gold traders looking for a systematic, rule-based approach to trading trends with minimal emotional interference.

Fibonacci ATR Fusion - Strategy [presentTrading]Open-script again! This time is also an ATR-related strategy. Enjoy! :)
If you have any questions, let me know, and I'll help make this as effective as possible.
█ Introduction and How It Is Different
The Fibonacci ATR Fusion Strategy is an advanced trading approach that uniquely integrates Fibonacci-based weighted averages with the Average True Range (ATR) to identify and capitalize on significant market trends.
Unlike traditional strategies that rely on single indicators or static parameters, this method combines multiple timeframes and dynamic volatility measurements to enhance precision and adaptability. Additionally, it features a 4-step Take Profit (TP) mechanism, allowing for systematic profit-taking at various levels, which optimizes both risk management and return potential in long and short market positions.
BTCUSD 6hr Performance
█ Strategy, How It Works: Detailed Explanation
The Fibonacci ATR Fusion Strategy utilizes a combination of technical indicators and weighted averages to determine optimal entry and exit points. Below is a breakdown of its key components and operational logic.
🔶 1. Enhanced True Range Calculation
The strategy begins by calculating the True Range (TR) to measure market volatility accurately.
TR = max(High - Low, abs(High - Previous Close), abs(Low - Previous Close))
High and Low: Highest and lowest prices of the current trading period.
Previous Close: Closing price of the preceding trading period.
max: Selects the largest value among the three calculations to account for gaps and limit movements.
🔶 2. Buying Pressure (BP) Calculation
Buying Pressure (BP) quantifies the extent to which buyers are driving the price upwards within a period.
BP = Close - True Low
Close: Current period's closing price.
True Low: The lower boundary determined in the True Range calculation.
🔶 3. Ratio Calculation for Different Periods
To assess the strength of buying pressure relative to volatility, the strategy calculates a ratio over various Fibonacci-based timeframes.
Ratio = 100 * (Sum of BP over n periods) / (Sum of TR over n periods)
n: Length of the period (e.g., 8, 13, 21, 34, 55).
Sum of BP: Cumulative Buying Pressure over n periods.
Sum of TR: Cumulative True Range over n periods.
This ratio normalizes buying pressure, making it comparable across different timeframes.
🔶 4. Weighted Average Calculation
The strategy employs a weighted average of ratios from multiple Fibonacci-based periods to smooth out signals and enhance trend detection.
Weighted Avg = (w1 * Ratio_p1 + w2 * Ratio_p2 + w3 * Ratio_p3 + w4 * Ratio_p4 + Ratio_p5) / (w1 + w2 + w3 + w4 + 1)
w1, w2, w3, w4: Weights assigned to each ratio period.
Ratio_p1 to Ratio_p5: Ratios calculated for periods p1 to p5 (e.g., 8, 13, 21, 34, 55).
This weighted approach emphasizes shorter periods more heavily, capturing recent market dynamics while still considering longer-term trends.
🔶 5. Simple Moving Average (SMA) of Weighted Average
To further smooth the weighted average and reduce noise, a Simple Moving Average (SMA) is applied.
Weighted Avg SMA = SMA(Weighted Avg, m)
- m: SMA period (e.g., 3).
This smoothed line serves as the primary signal generator for trade entries and exits.
🔶 6. Trading Condition Thresholds
The strategy defines specific threshold values to determine optimal entry and exit points based on crossovers and crossunders of the SMA.
Long Condition = Crossover(Weighted Avg SMA, Long Entry Threshold)
Short Condition = Crossunder(Weighted Avg SMA, Short Entry Threshold)
Long Exit = Crossunder(Weighted Avg SMA, Long Exit Threshold)
Short Exit = Crossover(Weighted Avg SMA, Short Exit Threshold)
Long Entry Threshold (T_LE): Level at which a long position is triggered.
Short Entry Threshold (T_SE): Level at which a short position is triggered.
Long Exit Threshold (T_LX): Level at which a long position is exited.
Short Exit Threshold (T_SX): Level at which a short position is exited.
These conditions ensure that trades are only executed when clear trends are identified, enhancing the strategy's reliability.
Previous local performance
🔶 7. ATR-Based Take Profit Mechanism
When enabled, the strategy employs a 4-step Take Profit system to systematically secure profits as the trade moves in the desired direction.
TP Price_1 Long = Entry Price + (TP1ATR * ATR Value)
TP Price_2 Long = Entry Price + (TP2ATR * ATR Value)
TP Price_3 Long = Entry Price + (TP3ATR * ATR Value)
TP Price_1 Short = Entry Price - (TP1ATR * ATR Value)
TP Price_2 Short = Entry Price - (TP2ATR * ATR Value)
TP Price_3 Short = Entry Price - (TP3ATR * ATR Value)
- ATR Value: Calculated using ATR over a specified period (e.g., 14).
- TPxATR: User-defined multipliers for each take profit level.
- TPx_percent: Percentage of the position to exit at each TP level.
This multi-tiered exit strategy allows for partial position closures, optimizing profit capture while maintaining exposure to potential further gains.
█ Trade Direction
The Fibonacci ATR Fusion Strategy is designed to operate in both long and short market conditions, providing flexibility to traders in varying market environments.
Long Trades: Initiated when the SMA of the weighted average crosses above the Long Entry Threshold (T_LE), indicating strong upward momentum.
Short Trades: Initiated when the SMA of the weighted average crosses below the Short Entry Threshold (T_SE), signaling robust downward momentum.
Additionally, the strategy can be configured to trade exclusively in one direction—Long, Short, or Both—based on the trader’s preference and market analysis.
█ Usage
Implementing the Fibonacci ATR Fusion Strategy involves several steps to ensure it aligns with your trading objectives and market conditions.
1. Configure Strategy Parameters:
- Trading Direction: Choose between Long, Short, or Both based on your market outlook.
- Trading Condition Thresholds: Set the Long Entry, Short Entry, Long Exit, and Short Exit thresholds to define when to enter and exit trades.
2. Set Take Profit Levels (if enabled):
- ATR Multipliers: Define how many ATRs away from the entry price each take profit level is set.
- Take Profit Percentages: Allocate what percentage of the position to close at each TP level.
3. Apply to Desired Chart:
- Add the strategy to the chart of the asset you wish to trade.
- Observe the plotted Fibonacci ATR and SMA Fibonacci ATR indicators for visual confirmation.
4. Monitor and Adjust:
- Regularly review the strategy’s performance through backtesting.
- Adjust the input parameters based on historical performance and changing market dynamics.
5. Risk Management:
- Ensure that the sum of take profit percentages does not exceed 100% to avoid over-closing positions.
- Utilize the ATR-based TP levels to adapt to varying market volatilities, maintaining a balanced risk-reward ratio.
█ Default Settings
Understanding the default settings is crucial for optimizing the Fibonacci ATR Fusion Strategy's performance. Here's a precise and simple overview of the key parameters and their effects:
🔶 Key Parameters and Their Effects
1. Trading Direction (`tradingDirection`)
- Default: Both
- Effect: Determines whether the strategy takes both long and short positions or restricts to one direction. Selecting Both allows maximum flexibility, while Long or Short can be used for directional bias.
2. Trading Condition Thresholds
Long Entry (long_entry_threshold = 58.0): Higher values reduce false positives but may miss trades.
Short Entry (short_entry_threshold = 42.0): Lower values capture early short trends but may increase false signals.
Long Exit (long_exit_threshold = 42.0): Exits long positions early, securing profits but potentially cutting trends short.
Short Exit (short_exit_threshold = 58.0): Delays short exits to capture favorable movements, avoiding premature exits.
3. Take Profit Configuration (`useTakeProfit` = false)
- Effect: When enabled, the strategy employs a 4-step TP mechanism to secure profits at multiple levels. By default, it is disabled to allow users to opt-in based on their trading style.
4. ATR-Based Take Profit Multipliers
TP1 (tp1ATR = 3.0): Sets the first TP at 3 ATRs for initial profit capture.
TP2 (tp2ATR = 8.0): Targets larger trends, though less likely to be reached.
TP3 (tp3ATR = 14.0): Optimizes for extreme price moves, seldom triggered.
5. Take Profit Percentages
TP Level 1 (tp1_percent = 12%): Secures 12% at the first TP.
TP Level 2 (tp2_percent = 12%): Exits another 12% at the second TP.
TP Level 3 (tp3_percent = 12%): Closes an additional 12% at the third TP.
6. Weighted Average Parameters
Ratio Periods: Fibonacci-based intervals (8, 13, 21, 34, 55) balance responsiveness.
Weights: Emphasizes recent data for timely responses to market trends.
SMA Period (weighted_avg_sma_period = 3): Smoothens data with minimal lag, balancing noise reduction and responsiveness.
7. ATR Period (`atrPeriod` = 14)
Effect: Sets the ATR calculation length, impacting TP sensitivity to volatility.
🔶 Impact on Performance
- Sensitivity and Responsiveness:
- Shorter Ratio Periods and Higher Weights: Make the weighted average more responsive to recent price changes, allowing quicker trade entries and exits but increasing the likelihood of false signals.
- Longer Ratio Periods and Lower Weights: Provide smoother signals with fewer false positives but may delay trade entries, potentially missing out on significant price moves.
- Profit Taking:
- ATR Multipliers: Higher multipliers set take profit levels further away, targeting larger price movements but reducing the probability of reaching these levels.
- Fixed Percentages: Allocating equal percentages at each TP level ensures consistent profit realization and risk management, preventing overexposure.
- Trade Direction Control:
- Selecting Specific Directions: Restricting trades to Long or Short can align the strategy with market trends or personal biases, potentially enhancing performance in trending markets.
- Risk Management:
- Take Profit Percentages: Dividing the position into smaller percentages at multiple TP levels helps lock in profits progressively, reducing risk and allowing the remaining position to ride further trends.
- Market Adaptability:
- Weighted Averages and ATR: By combining multiple timeframes and adjusting to volatility, the strategy adapts to different market conditions, maintaining effectiveness across various asset classes and timeframes.
---
If you want to know more about ATR, can also check "SuperATR 7-Step Profit".
Enjoy trading.

Williams %R StrategyThe Williams %R Strategy implemented in Pine Script™ is a trading system based on the Williams %R momentum oscillator. The Williams %R indicator, developed by Larry Williams in 1973, is designed to identify overbought and oversold conditions in a market, helping traders time their entries and exits effectively (Williams, 1979). This particular strategy aims to capitalize on short-term price reversals in the S&P 500 (SPY) by identifying extreme values in the Williams %R indicator and using them as trading signals.
Strategy Rules:
Entry Signal:
A long position is entered when the Williams %R value falls below -90, indicating an oversold condition. This threshold suggests that the market may be near a short-term bottom, and prices are likely to reverse or rebound in the short term (Murphy, 1999).
Exit Signal:
The long position is exited when:
The current close price is higher than the previous day’s high, or
The Williams %R indicator rises above -30, indicating that the market is no longer oversold and may be approaching an overbought condition (Wilder, 1978).
Technical Analysis and Rationale:
The Williams %R is a momentum oscillator that measures the level of the close relative to the high-low range over a specific period, providing insight into whether an asset is trading near its highs or lows. The indicator values range from -100 (most oversold) to 0 (most overbought). When the value falls below -90, it indicates an oversold condition where a reversal is likely (Achelis, 2000). This strategy uses this oversold threshold as a signal to initiate long positions, betting on mean reversion—an established principle in financial markets where prices tend to revert to their historical averages (Jegadeesh & Titman, 1993).
Optimization and Performance:
The strategy allows for an adjustable lookback period (between 2 and 25 days) to determine the range used in the Williams %R calculation. Empirical tests show that shorter lookback periods (e.g., 2 days) yield the most favorable outcomes, with profit factors exceeding 2. This finding aligns with studies suggesting that shorter timeframes can effectively capture short-term momentum reversals (Fama, 1970; Jegadeesh & Titman, 1993).
Scientific Context:
Mean Reversion Theory: The strategy’s core relies on mean reversion, which suggests that prices fluctuate around a mean or average value. Research shows that such strategies, particularly those using oscillators like Williams %R, can exploit these temporary deviations (Poterba & Summers, 1988).
Behavioral Finance: The overbought and oversold conditions identified by Williams %R align with psychological factors influencing trading behavior, such as herding and panic selling, which often create opportunities for price reversals (Shiller, 2003).
Conclusion:
This Williams %R-based strategy utilizes a well-established momentum oscillator to time entries and exits in the S&P 500. By targeting extreme oversold conditions and exiting when these conditions revert or exceed historical ranges, the strategy aims to capture short-term gains. Scientific evidence supports the effectiveness of short-term mean reversion strategies, particularly when using indicators sensitive to momentum shifts.
References:
Achelis, S. B. (2000). Technical Analysis from A to Z. McGraw Hill.
Fama, E. F. (1970). Efficient Capital Markets: A Review of Theory and Empirical Work. The Journal of Finance, 25(2), 383-417.
Jegadeesh, N., & Titman, S. (1993). Returns to Buying Winners and Selling Losers: Implications for Stock Market Efficiency. The Journal of Finance, 48(1), 65-91.
Murphy, J. J. (1999). Technical Analysis of the Financial Markets: A Comprehensive Guide to Trading Methods and Applications. New York Institute of Finance.
Poterba, J. M., & Summers, L. H. (1988). Mean Reversion in Stock Prices: Evidence and Implications. Journal of Financial Economics, 22(1), 27-59.
Shiller, R. J. (2003). From Efficient Markets Theory to Behavioral Finance. Journal of Economic Perspectives, 17(1), 83-104.
Williams, L. (1979). How I Made One Million Dollars… Last Year… Trading Commodities. Windsor Books.
Wilder, J. W. (1978). New Concepts in Technical Trading Systems. Trend Research.
This explanation provides a scientific and evidence-based perspective on the Williams %R trading strategy, aligning it with fundamental principles in technical analysis and behavioral finance.

High/Low Breakout Statistical Analysis StrategyThis Pine Script strategy is designed to assist in the statistical analysis of breakout systems on a monthly, weekly, or daily timeframe. It allows the user to select whether to open a long or short position when the price breaks above or below the respective high or low for the chosen timeframe. The user can also define the holding period for each position in terms of bars.
Core Functionality:
Breakout Logic:
The strategy triggers trades based on price crossing over (for long positions) or crossing under (for short positions) the high or low of the selected period (daily, weekly, or monthly).
Timeframe Selection:
A dropdown menu enables the user to switch between the desired timeframe (monthly, weekly, or daily).
Trade Direction:
Another dropdown allows the user to select the type of trade (long or short) depending on whether the breakout occurs at the high or low of the timeframe.
Holding Period:
Once a trade is opened, it is automatically closed after a user-defined number of bars, making it useful for analyzing how breakout signals perform over short-term periods.
This strategy is intended exclusively for research and statistical purposes rather than real-time trading, helping users to assess the behavior of breakouts over different timeframes.
Relevance of Breakout Systems:
Breakout trading systems, where trades are executed when the price moves beyond a significant price level such as the high or low of a given period, have been extensively studied in financial literature for their potential predictive power.
Momentum and Trend Following:
Breakout strategies are a form of momentum-based trading, exploiting the tendency of prices to continue moving in the direction of a strong initial movement after breaching a critical support or resistance level. According to academic research, momentum strategies, including breakouts, can produce returns above average market returns when applied consistently. For example, Jegadeesh and Titman (1993) demonstrated that stocks that performed well in the past 3-12 months continued to outperform in the subsequent months, suggesting that price continuation patterns, like breakouts, hold value .
Market Efficiency Hypothesis:
While the Efficient Market Hypothesis (EMH) posits that markets are generally efficient, and it is difficult to outperform the market through technical strategies, some studies show that in less liquid markets or during specific times of market stress, breakout systems can capitalize on temporary inefficiencies. Taylor (2005) and other researchers have found instances where breakout systems can outperform the market under certain conditions.
Volatility and Breakouts:
Breakouts are often linked to periods of increased volatility, which can generate trading opportunities. Coval and Shumway (2001) found that periods of heightened volatility can make breakouts more significant, increasing the likelihood that price trends will follow the breakout direction. This correlation between volatility and breakout reliability makes it essential to study breakouts across different timeframes to assess their potential profitability .
In summary, this breakout strategy offers an empirical way to study price behavior around key support and resistance levels. It is useful for researchers and traders aiming to statistically evaluate the effectiveness and consistency of breakout signals across different timeframes, contributing to broader research on momentum and market behavior.
References:
Jegadeesh, N., & Titman, S. (1993). Returns to Buying Winners and Selling Losers: Implications for Stock Market Efficiency. Journal of Finance, 48(1), 65-91.
Fama, E. F., & French, K. R. (1996). Multifactor Explanations of Asset Pricing Anomalies. Journal of Finance, 51(1), 55-84.
Taylor, S. J. (2005). Asset Price Dynamics, Volatility, and Prediction. Princeton University Press.
Coval, J. D., & Shumway, T. (2001). Expected Option Returns. Journal of Finance, 56(3), 983-1009.

Scalping with Williams %R, MACD, and SMA (1m)Overview:
This trading strategy is designed for scalping in the 1-minute timeframe. It uses a combination of the Williams %R, MACD, and SMA indicators to generate buy and sell signals. It also includes alert functionalities to notify users when trades are executed or closed.
Indicators Used:
Williams %R : A momentum indicator that measures overbought and oversold conditions. The Williams %R values range from -100 to 0.
Length: 140 bars (i.e., 140-period).
MACD (Moving Average Convergence Divergence) : A trend-following momentum indicator that shows the relationship between two moving averages of a security's price.
Fast Length: 24 bars
Slow Length: 52 bars
MACD Length: 9 bars (signal line)
SMA (Simple Moving Average) : A trend-following indicator that smooths out price data to create a trend-following indicator.
Length: 7 bars
Conditions and Logic:
Timeframe Check :
The strategy is designed specifically for the 1-minute timeframe. If the current chart is not on the 1-minute timeframe, a warning label is displayed on the chart instructing the user to switch to the 1-minute timeframe.
Williams %R Conditions :
Buy Condition: The strategy looks for a crossover of Williams %R from below -94 to above -94. This indicates a potential buying opportunity when the market is moving out of an oversold condition.
Sell Condition: The strategy looks for a crossunder of Williams %R from above -6 to below -6. This indicates a potential selling opportunity when the market is moving out of an overbought condition.
Deactivate Buy: If Williams %R crosses above -40, the buy signal is deactivated, suggesting that the buying condition is no longer valid.
Deactivate Sell: If Williams %R crosses below -60, the sell signal is deactivated, suggesting that the selling condition is no longer valid.
MACD Conditions :
MACD Histogram: Used to identify the momentum and the direction of the trend.
Long Entry: The strategy initiates a buy order if the MACD histogram shows a positive bar after a negative bar while a buy condition is active and Williams %R is above -94.
Long Exit: The strategy exits the buy position if the MACD histogram turns negative and is below the previous histogram bar.
Short Entry: The strategy initiates a sell order if the MACD histogram shows a negative bar after a positive bar while a sell condition is active and Williams %R is below -6.
Short Exit: The strategy exits the sell position if the MACD histogram turns positive and is above the previous histogram bar.
Trend Confirmation (Using SMA) :
Bullish Trend: The strategy considers a bullish trend if the current price is above the 7-bar SMA. A buy signal is only considered if this condition is met.
Bearish Trend: The strategy considers a bearish trend if the current price is below the 7-bar SMA. A sell signal is only considered if this condition is met.
Alerts:
Long Entry Alert: An alert is triggered when a buy order is executed.
Long Exit Alert: An alert is triggered when the buy order is closed.
Short Entry Alert: An alert is triggered when a sell order is executed.
Short Exit Alert: An alert is triggered when the sell order is closed.
Summary:
Buy Signal: Activated when Williams %R crosses above -94 and the price is above the 7-bar SMA. A buy order is placed if the MACD histogram shows a positive bar after a negative bar. The buy order is closed when the MACD histogram turns negative and is below the previous histogram bar.
Sell Signal: Activated when Williams %R crosses below -6 and the price is below the 7-bar SMA. A sell order is placed if the MACD histogram shows a negative bar after a positive bar. The sell order is closed when the MACD histogram turns positive and is above the previous histogram bar.
This strategy combines momentum (Williams %R), trend-following (MACD), and trend confirmation (SMA) to identify trading opportunities in the 1-minute timeframe. It is designed for short-term trading or scalping.

Intelle_city - World Cycle - Ath & Atl - Logarithmic - Strategy.Overview
Indicators: Strategy !
INTELLECT_city - World Cycle - ATH & ATL - Timeframe 1D and 1W - Logarithmic - Strategy - The Pi Cycle Top and Bottom Oscillator is an adaptation of the original Pi Cycle Top chart. It compares the 111-Day Moving Average circle and the 2 * 350-Day Moving Average circle of Bitcoin’s Price. These two moving averages were selected as 350 / 111 = 3.153; An approximation of the important mathematical number Pi.
When the 111-Day Moving Average circle reaches the 2 * 350-Day Moving Average circle, it indicates that the market is becoming overheated. That is because the mid time frame momentum reference of the 111-Day Moving Average has caught up with the long timeframe momentum reference of the 2 * 350-Day Moving Average.
Historically this has occurred within 3 days of the very top of each market cycle.
When the 111 Day Moving Average circle falls back beneath the 2 * 350 Day Moving Average circle, it indicates that the market momentum of that cycle is significantly cooling down. The oscillator drops down into the lower green band shown where the 111 Day Moving Average is moving at a 75% discount relative to the 2 * 350 Day Moving Average.
Historically, this has highlighted broad areas of bear market lows.
IMPORTANT: You need to set a LOGARITHMIC graph. (The function is located at the bottom right of the screen)
IMPORTANT: The INTELLECT_city indicator is made for a buy-sell strategy; there is also a signal indicator from INTELLECT_city
IMPORTANT: The Chart shows all cycles, both buying and selling.
IMPORTANT: Suitable timeframes are 1 daily (recommended) and 1 weekly
-----------------------------
Описание на русском:
-----------------------------
Обзор индикатора
INTELLECT_city - World Cycle - ATH & ATL - Timeframe 1D and 1W - Logarithmic - Strategy - Логарифмический - Сигнал - Осциллятор вершины и основания цикла Пи представляет собой адаптацию оригинального графика вершины цикла Пи. Он сравнивает круг 111-дневной скользящей средней и круг 2 * 350-дневной скользящей средней цены Биткойна. Эти две скользящие средние были выбраны как 350/111 = 3,153; Приближение важного математического числа Пи.
Когда круг 111-дневной скользящей средней достигает круга 2 * 350-дневной скользящей средней, это указывает на то, что рынок перегревается. Это происходит потому, что опорный моментум среднего временного интервала 111-дневной скользящей средней догнал опорный момент импульса длинного таймфрейма 2 * 350-дневной скользящей средней.
Исторически это происходило в течение трех дней после вершины каждого рыночного цикла.
Когда круг 111-дневной скользящей средней опускается ниже круга 2 * 350-дневной скользящей средней, это указывает на то, что рыночный импульс этого цикла значительно снижается. Осциллятор опускается в нижнюю зеленую полосу, показанную там, где 111-дневная скользящая средняя движется со скидкой 75% относительно 2 * 350-дневной скользящей средней.
Исторически это высветило широкие области минимумов медвежьего рынка.
ВАЖНО: Выставлять нужно ЛОГАРИФМИЧЕСКИЙ график. (Находиться функция с правой нижней части экрана)
ВАЖНО: Индикатор INTELLECT_city сделан для стратегии покупок продаж, есть также и сигнальный от INTELLECT_сity
ВАЖНО: На Графике видны все циклы, как на покупку так и на продажу.
ВАЖНО: Подходящие таймфреймы 1 дневной (рекомендовано) и 1 недельный
-----------------------------
Beschreibung - Deutsch
-----------------------------
Indikatorübersicht
INTELLECT_city – Weltzyklus – ATH & ATL – Zeitrahmen 1T und 1W – Logarithmisch – Strategy – Der Pi-Zyklus-Top- und Bottom-Oszillator ist eine Anpassung des ursprünglichen Pi-Zyklus-Top-Diagramms. Er vergleicht den 111-Tage-Gleitenden-Durchschnittskreis und den 2 * 350-Tage-Gleitenden-Durchschnittskreis des Bitcoin-Preises. Diese beiden gleitenden Durchschnitte wurden als 350 / 111 = 3,153 ausgewählt; eine Annäherung an die wichtige mathematische Zahl Pi.
Wenn der 111-Tage-Gleitenden-Durchschnittskreis den 2 * 350-Tage-Gleitenden-Durchschnittskreis erreicht, deutet dies darauf hin, dass der Markt überhitzt. Das liegt daran, dass der Momentum-Referenzwert des 111-Tage-Gleitenden-Durchschnitts im mittleren Zeitrahmen den Momentum-Referenzwert des 2 * 350-Tage-Gleitenden-Durchschnitts im langen Zeitrahmen eingeholt hat.
Historisch gesehen geschah dies innerhalb von 3 Tagen nach dem Höhepunkt jedes Marktzyklus.
Wenn der Kreis des 111-Tage-Durchschnitts wieder unter den Kreis des 2 x 350-Tage-Durchschnitts fällt, deutet dies darauf hin, dass die Marktdynamik dieses Zyklus deutlich nachlässt. Der Oszillator fällt in das untere grüne Band, in dem der 111-Tage-Durchschnitt mit einem Abschlag von 75 % gegenüber dem 2 x 350-Tage-Durchschnitt verläuft.
Historisch hat dies breite Bereiche mit Tiefstständen in der Baisse hervorgehoben.
WICHTIG: Sie müssen ein logarithmisches Diagramm festlegen. (Die Funktion befindet sich unten rechts auf dem Bildschirm)
WICHTIG: Der INTELLECT_city-Indikator ist für eine Kauf-Verkaufs-Strategie konzipiert; es gibt auch einen Signalindikator von INTELLECT_city
WICHTIG: Das Diagramm zeigt alle Zyklen, sowohl Kauf- als auch Verkaufszyklen.
WICHTIG: Geeignete Zeitrahmen sind 1 täglich (empfohlen) und 1 wöchentlich

NASDAQ 100 Peak Hours StrategyNASDAQ 100 Peak Hours Trading Strategy
Description
Our NASDAQ 100 Peak Hours Trading Strategy leverages a carefully designed algorithm to trade within specific hours of high market activity, particularly focusing on the first two hours of the trading session from 09:30 AM to 11:30 AM GMT-5. This period is identified for its increased volatility and liquidity, offering numerous trading opportunities.
The strategy incorporates a blend of technical indicators to identify entry and exit points for both long and short positions. These indicators include:
Exponential Moving Averages (EMAs) : A short-term 9-period EMA and a longer-term 21-period EMA to determine the market trend and momentum.
Relative Strength Index (RSI) : A 14-period RSI to gauge the market's momentum.
Average True Range (ATR) : A 14-period ATR to assess market volatility and to set dynamic stop losses and trailing stops.
Volume Weighted Average Price (VWAP) : To identify the market's average price weighted by volume, serving as a benchmark for the trading day.
Our strategy uniquely applies a volatility filter using the ATR, ensuring trades are only executed in conditions that favor our setup. Additionally, we consider the direction of the EMAs to confirm the market's trend before entering trades.
Originality and Usefulness
This strategy stands out by combining these indicators within the NASDAQ 100's peak hours, exploiting the specific market conditions that prevail during these times. The inclusion of a volatility filter and dynamic stop-loss mechanisms based on the ATR provides a robust method for managing risk.
By focusing on the early trading hours, the strategy aims to capture the initial market movements driven by overnight news and the opening rush, often characterized by higher volatility. This approach is particularly useful for traders looking to maximize gains from short-term fluctuations while limiting exposure to longer-term market uncertainty.
Strategy Results
To ensure the strategy's effectiveness and reliability, it has undergone rigorous backtesting over a significant dataset to produce a sample size of more than 100 trades. This testing phase helps in identifying the strategy's potential in various market conditions, its consistency, and its risk-to-reward ratio.
Our backtesting adheres to realistic trading conditions, accounting for slippage and commission to reflect actual trading scenarios accurately. The strategy is designed with a conservative approach to risk management, advising not to risk more than 5-10% of equity on a single trade. The default settings in the script align with these principles, ensuring that users can replicate our tested conditions.
Using the Strategy
The strategy is designed for simplicity and ease of use:
Trade Hours : Focuses on 09:30 AM to 11:30 AM GMT-5, during the NASDAQ 100's peak activity hours.
Entry Conditions : Trades are initiated based on the alignment of EMAs, RSI, VWAP, and the ATR's volatility filter within the designated time frame.
Exit Conditions : Includes dynamic trailing stops based on ATR, a predefined time exit strategy, and a trend reversal exit condition for risk management.
This script is a powerful tool for traders looking to leverage the NASDAQ 100's peak hours, providing a structured approach to navigating the early market hours with a robust set of criteria for making informed trading decisions.

Dual-Supertrend with MACD - Strategy [presentTrading]## Introduction and How it is Different
The Dual-Supertrend with MACD strategy offers an amalgamation of two trend-following indicators (Supertrend 1 & 2) with a momentum oscillator (MACD). It aims to provide a cohesive and systematic approach to trading, eliminating the need for discretionary decision-making.
Key advantages over traditional single-indicator strategies:
- Dual Supertrend Validation: Utilizes two Supertrend indicators with different ATR periods and factors to confirm the trend direction. This double-check mechanism minimizes false signals.
- Momentum Confirmation: The MACD histogram acts as a momentum filter, confirming entries and exits, thus adding an extra layer of validation.
- Objective Entry and Exit: The strategy generates buy and sell signals based on a combination of trend direction and momentum, leaving no room for subjective interpretation.
- Automated Trade Management: The strategy includes built-in settings for commission, slippage, and initial capital, automating the trade execution process.
- Adaptability: The strategy allows for easy customization of all its parameters, adapting to a trader's specific needs and varying market conditions.
BTCUSD 8hr chart Long Condition
BTCUSD 6hr chart Long Short Condition
## Strategy, How it Works
The strategy operates on a set of clearly defined rules, primarily focusing on the trend direction confirmed by the Dual-Supertrend and the momentum as indicated by the MACD histogram.
### Entry Rules
- Long Entry: When both Supertrend indicators are bullish and the MACD histogram is above zero.
- Short Entry: When both Supertrend indicators are bearish and the MACD histogram is below zero.
### Exit Rules
- Exit long positions when either of the Supertrends turn bearish or the MACD histogram drops below zero.
- Exit short positions when either of the Supertrends turn bullish or the MACD histogram rises above zero.
### Trade Management
- The strategy uses a fixed commission rate and slippage in its calculations.
- Automated risk management features are integrated to avoid overexposure.
## Trade Direction
The strategy allows for trading in both bullish and bearish markets. Users can select their preferred trading direction ("long", "short", or "both") to align with their market outlook and trading objectives.
## Usage
- The strategy is best applied on timeframes where the trend is evident.
- Users can modify the ATR periods, factors for Supertrends, and MACD settings to suit their trading needs.
## Default Settings
- ATR Period for Supertrend 1: 10
- Factor for Supertrend 1: 3.0
- ATR Period for Supertrend 2: 20
- Factor for Supertrend 2: 5.0
- MACD Fast Length: 12
- MACD Slow Length: 26
- MACD Signal Smoothing: 9
- Commission: 0.1%
- Slippage: 1 point
- Trading Direction: Both
The strategy comes with these default settings to offer a balanced trading approach but can be customized according to individual trading preferences.
