Kalman PSaR [BackQuant]Kalman PSaR
Overview and Innovation
The Kalman PSaR combines the well-known Parabolic SAR (PSaR) with the advanced smoothing capabilities of the Kalman Filter . This innovative tool aims to enhance the traditional PSaR by integrating Kalman filtering, which reduces noise and improves trend detection. The Kalman PSaR adapts dynamically to price movements, making it a highly effective indicator for spotting trend shifts while minimizing the impact of false signals caused by market volatility.
Please Find the Basic Kalman Here:
Kalman Filter Dynamics
The Kalman Filter is a powerful algorithm for estimating the true value of a system amidst noisy data. In the Kalman PSaR, this filter is applied to the high, low, and closing prices, resulting in a smoother and more accurate representation of price action. The filter’s parameters—process noise and measurement noise—are customizable, allowing traders to fine-tune the sensitivity of the indicator to market conditions. By reducing the impact of noise, the Kalman-filtered PSaR offers clearer signals for identifying trend reversals and continuations.
Enhanced PSaR Calculation
The traditional Parabolic SAR is a popular trend-following indicator that highlights potential entry and exit points based on price acceleration. In the Kalman PSaR, this calculation is enhanced by the Kalman-filtered prices, providing a smoother and more reliable signal. The indicator continuously updates based on the acceleration factor and max step values, while the Kalman filter ensures that sudden price spikes or market noise do not trigger false signals.
Min Step and Max Step: These settings control the sensitivity of the PSaR. The Min Step sets the initial acceleration factor, while the Max Step limits how fast the PSaR adapts to price changes, helping traders fine-tune the indicator’s responsiveness.
Optional Smoothing Techniques To further enhance the signal clarity, the Kalman PSaR includes an optional smoothing feature. Traders can choose from various smoothing methods, such as SMA, Hull, EMA, WMA, TEMA, and more, to reduce short-term fluctuations and emphasize the underlying trend. The smoothing period is customizable, allowing traders to adjust the indicator’s behavior according to their preferred trading style and timeframe.
Color-Coded Candle Painting The Kalman PSaR features color-coded candles that change according to the trend direction. When the price is above the PSaR, candles are painted green to indicate a long trend, and when the price is below the PSaR, candles are painted red to signal a short trend. This visual representation makes it easy to interpret market sentiment at a glance, improving decision-making speed during fast-moving markets.
Key Features and Customization
Kalman Filter Customization: The process noise and measurement noise parameters allow traders to adjust how aggressively the filter adapts to price changes, making it suitable for both volatile and stable markets.
Smoothing Options: A variety of moving average types, such as SMA, Hull, EMA, and more, can be applied to smooth the PSaR values, ensuring that the signal remains clear even in choppy markets.
Dynamic Trend Detection: The Kalman PSaR dynamically updates based on price movements, helping traders spot trend reversals early while filtering out false signals caused by short-term volatility.
Bar Coloring and PSaR Plotting: Traders can choose to color candles based on trend direction or plot the PSaR directly on the chart for additional visual clarity.
Practical Applications
Trend-Following Strategies: The Kalman PSaR excels in trend-following strategies by providing timely signals of trend changes. The dynamic nature of the indicator allows traders to capture significant price movements while avoiding market noise.
Reversal Identification: The indicator’s ability to filter out noise and provide smoother signals makes it ideal for identifying reversals in volatile markets.
Risk Management: By plotting clear stop levels based on the PSaR, traders can use this indicator to effectively manage risk, placing stop-loss orders at key points based on the trend direction.
Conclusion
The Kalman PSaR is a fusion of the classic Parabolic SAR and the Kalman filter, offering enhanced trend detection with reduced noise. Its customizable filtering and smoothing options, combined with dynamic trend-following capabilities, make it a versatile tool for traders seeking to improve their timing and signal accuracy. The adaptive nature of the Kalman filter, combined with the robust PSaR logic, helps traders stay on the right side of the market and manage risk more effectively.
Tìm kiếm tập lệnh với "psar"

Multi-indicator Signal Builder [Skyrexio]Overview
Multi-Indicator Signal Builder is a versatile, all-in-one script designed to streamline your trading workflow by combining multiple popular technical indicators under a single roof. It features a single-entry, single-exit logic, intrabar stop-loss/take-profit handling, an optional time filter, a visually accessible condition table, and a built-in statistics label. Traders can choose any combination of 12+ indicators (RSI, Ultimate Oscillator, Bollinger %B, Moving Averages, ADX, Stochastic, MACD, PSAR, MFI, CCI, Heikin Ashi, and a “TV Screener” placeholder) to form entry or exit conditions. This script aims to simplify strategy creation and analysis, making it a powerful toolkit for technical traders.
Indicators Overview
1. RSI (Relative Strength Index)
Measures recent price changes to evaluate overbought or oversold conditions on a 0–100 scale.
2. Ultimate Oscillator (UO)
Uses weighted averages of three different timeframes, aiming to confirm price momentum while avoiding false divergences.
3. Bollinger %B
Expresses price relative to Bollinger Bands, indicating whether price is near the upper band (overbought) or lower band (oversold).
4. Moving Average (MA)
Smooths price data over a specified period. The script supports both SMA and EMA to help identify trend direction and potential crossovers.
5. ADX (Average Directional Index)
Gauges the strength of a trend (0–100). Higher ADX signals stronger momentum, while lower ADX indicates a weaker trend.
6. Stochastic
Compares a closing price to a price range over a given period to identify momentum shifts and potential reversals.
7. MACD (Moving Average Convergence/Divergence)
Tracks the difference between two EMAs plus a signal line, commonly used to spot momentum flips through crossovers.
8. PSAR (Parabolic SAR)
Plots a trailing stop-and-reverse dot that moves with the trend. Often used to signal potential reversals when price crosses PSAR.
9. MFI (Money Flow Index)
Similar to RSI but incorporates volume data. A reading above 80 can suggest overbought conditions, while below 20 may indicate oversold.
10. CCI (Commodity Channel Index)
Identifies cyclical trends or overbought/oversold levels by comparing current price to an average price over a set timeframe.
11. Heikin Ashi
A type of candlestick charting that filters out market noise. The script uses a streak-based approach (multiple consecutive bullish or bearish bars) to gauge mini-trends.
12. TV Screener
A placeholder condition designed to integrate external buy/sell logic (like a TradingView “Buy” or “Sell” rating). Users can override or reference external signals if desired.
Unique Features
1. Multi-Indicator Entry and Exit
You can selectively enable any subset of 12+ classic indicators, each with customizable parameters and conditions. A position opens only if all enabled entry conditions are met, and it closes only when all enabled exit conditions are satisfied, helping reduce false triggers.
2. Single-Entry / Single-Exit with Intrabar SL/TP
The script supports a single position at a time. Once a position is open, it monitors intrabar to see if the price hits your stop-loss or take-profit levels before the bar closes, making results more realistic for fast-moving markets.
3. Time Window Filter
Users may specify a start/end date range during which trades are allowed, making it convenient to focus on specific market cycles for backtesting or live trading.
4. Condition Table and Statistics
A table at the bottom of the chart lists all active entry/exit indicators. Upon each closed trade, an integrated statistics label displays net profit, total trades, win/loss count, average and median PnL, etc.
5. Seamless Alerts and Automation
Configure alerts in TradingView using “Any alert() function call.”
The script sends JSON alert messages you can route to your own webhook.
The indicator can be integrated with Skyrexio alert bots to automate execution on major cryptocurrency exchanges
6. Optional MA/PSAR Plots
For added visual clarity, optionally plot the chosen moving averages or PSAR on the chart to confirm signals without stacking multiple indicators.
Methodology
1. Multi-Indicator Entry Logic
When multiple entry indicators are enabled (e.g., RSI + Stochastic + MACD), the script requires all signals to align before generating an entry. Each indicator can be set for crossovers, crossunders, thresholds (above/below), etc. This “AND” logic aims to filter out low-confidence triggers.
2. Single-Entry Intrabar SL/TP
One Position At a Time: Once an entry signal triggers, a trade opens at the bar’s close.
Intrabar Checks: Stop-loss and take-profit levels (if enabled) are monitored on every tick. If either is reached, the position closes immediately, without waiting for the bar to end.
3. Exit Logic
All Conditions Must Agree: If the trade is still open (SL/TP not triggered), then all enabled exit indicators must confirm a closure before the script exits on the bar’s close.
4. Time Filter
Optional Trading Window: You can activate a date/time range to constrain entries and exits strictly to that interval.
Justification of Methodology
Indicator Confluence: Combining multiple tools (RSI, MACD, etc.) can reduce noise and false signals.
Intrabar SL/TP: Capturing real-time spikes or dips provides a more precise reflection of typical live trading scenarios.
Single-Entry Model: Straightforward for both manual and automated tracking (especially important in bridging to bots).
Custom Date Range: Helps refine backtesting for specific market conditions or to avoid known irregular data periods.
How to Use
1. Add the Script to Your Chart
In TradingView, open Indicators , search for “Multi-indicator Signal Builder”.
Click to add it to your chart.
2. Configure Inputs
Time Filter: Set a start and end date for trades.
Alerts Messages: Input any JSON or text payload needed by your external service or bot.
Entry Conditions: Enable and configure any indicators (e.g., RSI, MACD) for a confluence-based entry.
Close Conditions: Enable exit indicators, along with optional SL (negative %) and TP (positive %) levels.
3. Set Up Alerts
In TradingView, select “Create Alert” → Condition = “Any alert() function call” → choose this script.
Entry Alert: Triggers on the script’s entry signal.
Close Alert: Triggers on the script’s close signal (or if SL/TP is hit).
Skyrexio Alert Bots: You can route these alerts via webhook to Skyrexio alert bots to automate order execution on major crypto exchanges (or any other supported broker).
4. Visual Reference
A condition table at the bottom summarizes active signals.
Statistics Label updates automatically as trades are closed, showing PnL stats and distribution metrics.
Backtesting Guidelines
Symbol/Timeframe: Works on multiple assets and timeframes; always do thorough testing.
Realistic Costs: Adjust commissions and potential slippage to match typical exchange conditions.
Risk Management: If using the built-in stop-loss/take-profit, set percentages that reflect your personal risk tolerance.
Longer Test Horizons: Verify performance across diverse market cycles to gauge reliability.
Example of statistic calculation
Test Period: 2023-01-01 to 2025-12-31
Initial Capital: $1,000
Commission: 0.1%, Slippage ~5 ticks
Trade Count: 468 (varies by strategy conditions)
Win rate: 76% (varies by strategy conditions)
Net Profit: +96.17% (varies by strategy conditions)
Disclaimer
This indicator is provided strictly for informational and educational purposes .
It does not constitute financial or trading advice.
Past performance never guarantees future results.
Always test thoroughly in demo environments before using real capital.
Enjoy exploring the Multi-Indicator Signal Builder! Experiment with different indicator combinations and adjust parameters to align with your trading preferences, whether you trade manually or link your alerts to external automation services. Happy trading and stay safe!

Parabolic SAR of KAMA [Loxx]Parabolic SAR of KAMA attempts to reduce noise and volatility from regular Parabolic SAR in order to derive more accurate trends. In addition, and to further reduce noise and enhance trend identification, PSAR of KAMA includes two calculations of efficiency ratio: 1) price change adjusted for the daily volatility; or, 2) Jurik Fractal Dimension Adaptive (explained below)
What is PSAR?
The parabolic SAR indicator, developed by J. Wells Wilder, is used by traders to determine trend direction and potential reversals in price. The indicator uses a trailing stop and reverse method called "SAR," or stop and reverse, to identify suitable exit and entry points. Traders also refer to the indicator as to the parabolic stop and reverse, parabolic SAR, or PSAR.
What is KAMA?
Developed by Perry Kaufman, Kaufman's Adaptive Moving Average (KAMA) is a moving average designed to account for market noise or volatility. KAMA will closely follow prices when the price swings are relatively small and the noise is low. KAMA will adjust when the price swings widen and follow prices from a greater distance. This trend-following indicator can be used to identify the overall trend, time turning points and filter price movements.
What is the efficiency ratio?
In statistical terms, the Efficiency Ratio tells us the fractal efficiency of price changes. ER fluctuates between 1 and 0, but these extremes are the exception, not the norm. ER would be 1 if prices moved up 10 consecutive periods or down 10 consecutive periods. ER would be zero if price is unchanged over the 10 periods.
What is Jurik Fractal Dimension?
There is a weak and a strong way to measure the random quality of a time series.
The weak way is to use the random walk index (RWI). You can download it from the Omega web site. It makes the assumption that the market is moving randomly with an average distance D per move and proposes an amount the market should have changed over N bars of time. If the market has traveled less, then the action is considered random, otherwise it's considered trending.
The problem with this method is that taking the average distance is valid for a Normal (Gaussian) distribution of price activity. However, price action is rarely Normal, with large price jumps occuring much more frequently than a Normal distribution would expect. Consequently, big jumps throw the RWI way off, producing invalid results.
The strong way is to not make any assumption regarding the distribution of price changes and, instead, measure the fractal dimension of the time series. Fractal Dimension requires a lot of data to be accurate. If you are trading 30 minute bars, use a multi-chart where this indicator is running on 5 minute bars and you are trading on 30 minute bars.
Conclusion from the combined efforts explained above:
-PSAR is a tool that identifies trends
-To reduce noise and identify trends during periods of low volatility, we calculate a PSAR on KAMA
-To enhance noise and reduction and trend identification, we attempt to derive an efficiency ratio that is less reliant on a Normal (Gaussian) distribution of price
Included:
-Customization of all variables
-Select from two different ER calculation styles
-Multiple timeframe enabled

3x EMA fast, 3 x MA slow + BB + PsarThis is a trend system which combines multiple fast EMA + mulitple slower SMA together with bollinger band channel and PSAR.
For entry rules the ones that I use are:
Long
We are inside BB channel, psar is ascending, and our close is above all moving averages or below all EMA'S + 1 SMA
WE can exit either when our close is below all EMA's or when PSAR is descending or when we hit upper/lower BB levels
Short
We are inside BB channel, psar is descnending, and our close is below all moving averages or below all EMA's + 1 SMA
WE can exit either when our close is above all EMA's or when PSAR is ascending or when we hit upper/lower BB levels
If you have any questions, let me know

MomentumSync-PSAR: RSI·ADX Filtered 3-Tier Exit StrategyTriSAR-E3 is a precision swing trading strategy designed to capitalize on early trend reversals using a Triple Confirmation Model. It triggers entries based on an early Parabolic SAR bullish flip, supported by RSI strength and ADX trend confirmation, ensuring momentum-backed participation.
Exits are tactically managed through a 3-step staged exit after a PSAR bearish reversal is detected, allowing gradual profit booking and downside protection.
This balanced approach captures trend moves early while intelligently scaling out, making it suitable for directional traders seeking both agility and control.

Measure Volume, Momentum, Trend, VolatilityThis script displays the following indicators in one pane to quickly determine several important factors regarding price action. It allows the user to quickly see all of most important factors surrounding price action in one pane with one quick glance. This should be incredibly helpful and allow things like double divergence and trend confirmation to be spotted much more quickly. I personally use the data in this indicator to replace four separate indicators and it has brought my win rate and profit factor significantly higher. I hadn't seen any place where all of the best J. Welles Wilder indicators such as RSI, Parabolic SAR, and DMI/ADX were brought into one easy to use interface. This is my attempt at fixing that gap. For a much deeper understanding of how to use these indicators, I recommend reading New Concepts in Technical Trading Systems written by J. Welles Wilder.
Momentum via RSI (Relative Strength Index)
Volume via MFI (Money Flow Index)
Volatility via DMI/ADX (Direction Movement Index/Average Directional Index)
Trend via Parabolic SAR (Parabolic Stop and Reverse)
It is worth noting that DMI/ADX and Parabolic SAR can both help determine trend strength and volatility.
The Volatility mechanism is measured by DMI and ADX and displayed at the top of the pane using circles. The top, tiny circles reflect if show if positive DI or negative DI has a higher value. The small circles directly underneath indicate whether or not the ADX is above 20 (configurable, some may choose to increase this to 25 or even 30).
The Momentum mechanism is shown as standard RSI with the default being a white line and default period of 14, which is all configurable.
The Volume mechanism is shown as standard MFI with the default being a fuchsia line and default period of 14, which is also configurable.
The momentum and volume oscillators should be used in conjunction to help spot whether the trend is strong or weak using divergences and the middle, overbought, and oversold levels. These levels are also configurable.
The Trend mechanism is measured by Parabolic SAR and displayed at the bottom of the pane using diamonds. The default is red diamonds when in a bear trend, green when in an uptrend which is configurable. When price is above the Parabolic SAR, it is considered to be an uptrend. When price is below the Parabolic SAR, it is considered to be a downtrend. The way price is measured is also configurable (i.e. open, close, ohlc4, hlc3, etc.). When price crossed above or below the Parabolic SAR, the diamonds will change colors.
All the indicators displayed should be used in a well rounded strategy. For instance, I only trade when ADX is above 20 and rarely trade against the trend shown via PSAR. When trend shifts and divergences helped indicate a trend shift would occur using the RSI and MFI, it can be a great spot to take an entry. RSI/MFI can also confirm the trend is strong when they are not showing divergences and inline with price action. All of this data should be used in conjunction with good fundamental data and technical levels. Divergences with RSI and MFI on double tops or bottoms can also be incredibly powerful. There is no right or wrong way to use all the data displayed in this indicator, however using all four pillars of trading (Momentum, Volume, Trend, Volatility) will help ensure only the best trades are taken.

Standardized PSAR Oscillator [AlgoAlpha]Enhance your trading experience with the "Standardized PSAR Oscillator" 🪝, a powerful tool that combines the Parabolic Stop and Reverse (PSAR) with standardization techniques to offer more nuanced insights into market trends and potential reversals.
🔑 Key Features:
- 🛠 Customizable PSAR Settings: Adjust the starting point, increment, and maximum values for the PSAR to tailor the indicator to your strategy.
- 📏 Standardization: Smooth out volatility by standardizing the PSAR values using a customizable EMA, making reversals easier to identify.
- 🎨 Dynamic Color-Coding: The oscillator changes colors based on market conditions, helping you quickly spot bullish and bearish trends.
- 🔄 Divergence Detection: Automatic detection of bullish and bearish divergences with customizable sensitivity and confirmation settings.
- 🔔 Alerts: Set up alerts for key events like zero-line crossovers and trend weakening, ensuring you never miss a critical market move.
🚀 How to Use:
✨ Add the Indicator: Add the indicator to favorites by pressing the star icon, adjust the settings to suite your needs.
👀 Monitor Signals: Watch for the automatic plotting of divergences and reversal signals to identify potential market entries and exits.
🔔 Set Alerts: Configure alerts to get notified of key changes without constantly monitoring the charts.
🔍 How It Works:
The Standardized PSAR Oscillator is an advanced trading tool that refines the traditional PSAR (Parabolic Stop and Reverse) indicator by incorporating several key enhancements to improve trend analysis and signal accuracy. The script begins by calculating the PSAR, a widely used indicator known for its effectiveness in identifying trend reversals. To make the PSAR more adaptive and responsive to market conditions, it is standardized using an Exponential Moving Average (EMA) of the high-low range over a user-defined period. This standardization helps to normalize the PSAR values, making them more comparable across different market conditions.
To further enhance signal clarity, the standardized PSAR is then smoothed using a Weighted Moving Average (WMA). This combination of EMA and WMA creates an oscillator that not only captures trend direction but also smooths out market noise, providing a cleaner signal. The oscillator's values are color-coded to visually indicate its position relative to the zero line, with additional emphasis on whether the WMA is rising or falling—this helps traders quickly interpret the trend’s strength and direction.
The oscillator also includes built-in divergence detection by comparing pivot points in price action with those in the oscillator. This feature helps identify potential discrepancies between the price and the oscillator, signaling possible trend reversals. Alerts can be configured for when the oscillator crosses the zero line or when a trend shows signs of weakening, ensuring that traders receive timely notifications to act on emerging opportunities. These combined elements make the Standardized PSAR Oscillator a robust tool for enhancing your trading strategy with more reliable and actionable signals

Ultimate MA & PSAR [TARUN]Overview
This indicator combines a customizable Moving Average (MA) and Parabolic SAR (PSAR) to generate precise long and short trade signals. A dashboard displays real-time trade conditions, including signal direction, entry price, stop loss, and PnL tracking.
Key Features
✅ Customizable MA Type & Period – Choose between SMA or EMA with adjustable length.
✅ Adaptive PSAR Settings – Modify start, increment, and max step values to fine-tune stop levels.
✅ Trade Signal Logic – Identifies potential buy (long) and sell (short) opportunities based on:
Price action relative to MA
MA trend direction (rising or falling)
PSAR confirmation
✅ Dynamic Stop Loss Calculation – Uses lowest low/highest high over a specified period for stop loss placement.
✅ Trade State & Reversal Handling – Manages active trades, pending signals, and stop loss exits dynamically.
✅ PnL & Dashboard Table – Displays real-time signal status, entry price, stop loss, and profit/loss (PnL) in an easy-to-read format.
How It Works
1.Buy (Long) Condition:
MA is rising
Price is above the MA
PSAR is below price
2.Sell (Short) Condition:
MA is falling
Price is below the MA
PSAR is above price
3.Stop Loss Handling:
For long trades → stop loss is set at the lowest low of the last X candles
For short trades → stop loss is set at the highest high of the last X candles
4.Trade Execution & PnL Calculation:
If a valid long/short setup is detected, a pending signal is placed.
On the next bullish (for long) or bearish (for short) candle, the trade is confirmed.
Real-time PnL updates help track trade performance.
Customization Options
🔹 Moving Average: SMA or EMA, adjustable period
🔹 PSAR Settings: Start, Increment, Maximum step values
🔹 Stop Loss Lookback: Choose how many candles to consider for stop loss placement
🔹 Dashboard Positioning: Select preferred display location (top/bottom, left/right)
🔹 Trade Signal Selection: Enable/Disable Long and Short signals individually
How to Use
Add the indicator to your chart.
Customize the MA & PSAR settings according to your trading strategy.
Follow the dashboard signals for trade setups.
Use stop loss levels to manage risk effectively.
Disclaimer
⚠️ This indicator is for educational purposes only and does not constitute financial advice. Always perform proper risk management and backtesting before using it in live trading.

Hyper SAR Reactor Trend StrategyHyperSAR Reactor Adaptive PSAR Strategy
Summary
Adaptive Parabolic SAR strategy for liquid stocks, ETFs, futures, and crypto across intraday to daily timeframes. It acts only when an adaptive trail flips and confirmation gates agree. Originality comes from a logistic boost of the SAR acceleration using drift versus ATR, plus ATR hysteresis, inertia on the trail, and a bear-only gate for shorts. Add to a clean chart and run on bar close for conservative alerts.
Scope and intent
• Markets: large cap equities and ETFs, index futures, major FX, liquid crypto
• Timeframes: one minute to daily
• Default demo: BTC on 60 minute
• Purpose: faster yet calmer PSAR that resists chop and improves short discipline
• Limits: this is a strategy that places simulated orders on standard candles
Originality and usefulness
• Novel fusion: PSAR AF is boosted by a logistic function of normalized drift, trail is monotone with inertia, entries use ATR buffers and optional cooldown, shorts are allowed only in a bear bias
• Addresses false flips in low volatility and weak downtrends
• All controls are exposed in Inputs for testability
• Yardstick: ATR normalizes drift so settings port across symbols
• Open source. No links. No solicitation
Method overview
Components
• Adaptive AF: base step plus boost factor times logistic strength
• Trail inertia: one sided blend that keeps the SAR monotone
• Flip hysteresis: price must clear SAR by a buffer times ATR
• Volatility gate: ATR over its mean must exceed a ratio
• Bear bias for shorts: price below EMA of length 91 with negative slope window 54
• Cooldown bars optional after any entry
• Visual SAR smoothing is cosmetic and does not drive orders
Fusion rule
Entry requires the internal flip plus all enabled gates. No weighted scores.
Signal rule
• Long when trend flips up and close is above SAR plus buffer times ATR and gates pass
• Short when trend flips down and close is below SAR minus buffer times ATR and gates pass
• Exit uses SAR as stop and optional ATR take profit per side
Inputs with guidance
Reactor Engine
• Start AF 0.02. Lower slows new trends. Higher reacts quicker
• Max AF 1. Typical 0.2 to 1. Caps acceleration
• Base step 0.04. Typical 0.01 to 0.08. Raises speed in trends
• Strength window 18. Typical 10 to 40. Drift estimation window
• ATR length 16. Typical 10 to 30. Volatility unit
• Strength gain 4.5. Typical 2 to 6. Steepness of logistic
• Strength center 0.45. Typical 0.3 to 0.8. Midpoint of logistic
• Boost factor 0.03. Typical 0.01 to 0.08. Adds to step when strength rises
• AF smoothing 0.50. Typical 0.2 to 0.7. Adds inertia to AF growth
• Trail smoothing 0.35. Typical 0.15 to 0.45. Adds inertia to the trail
• Allow Long, Allow Short toggles
Trade Filters
• Flip confirm buffer ATR 0.50. Typical 0.2 to 0.8. Raise to cut flips
• Cooldown bars after entry 0. Typical 0 to 8. Blocks re entry for N bars
• Vol gate length 30 and Vol gate ratio 1. Raise ratio to trade only in active regimes
• Gate shorts by bear regime ON. Bear bias window 54 and Bias MA length 91 tune strictness
Risk
• TP long ATR 1.0. Set to zero to disable
• TP short ATR 0.0. Set to 0.8 to 1.2 for quicker shorts
Usage recipes
Intraday trend focus
Confirm buffer 0.35 to 0.5. Cooldown 2 to 4. Vol gate ratio 1.1. Shorts gated by bear regime.
Intraday mean reversion focus
Confirm buffer 0.6 to 0.8. Cooldown 4 to 6. Lower boost factor. Leave shorts gated.
Swing continuation
Strength window 24 to 34. ATR length 20 to 30. Confirm buffer 0.4 to 0.6. Use daily or four hour charts.
Properties visible in this publication
Initial capital 10000. Base currency USD. Order size Percent of equity 3. Pyramiding 0. Commission 0.05 percent. Slippage 5 ticks. Process orders on close OFF. Bar magnifier OFF. Recalculate after order filled OFF. Calc on every tick OFF. No security calls.
Realism and responsible publication
No performance claims. Past results never guarantee future outcomes. Shapes can move while a bar forms and settle on close. Strategies execute only on standard candles.
Honest limitations and failure modes
High impact events and thin books can void assumptions. Gap heavy symbols may prefer longer ATR. Very quiet regimes can reduce contrast and invite false flips.
Open source reuse and credits
Public domain building blocks used: PSAR concept and ATR. Implementation and fusion are original. No borrowed code from other authors.
Strategy notice
Orders are simulated on standard candles. No lookahead.
Entries and exits
Long: flip up plus ATR buffer and all gates true
Short: flip down plus ATR buffer and gates true with bear bias when enabled
Exit: SAR stop per side, optional ATR take profit, optional cooldown after entry
Tie handling: stop first if both stop and target could fill in one bar

[VJ]Phoenix Force of PSAR +MACD +RSIThis is a simple intraday strategy for working on Stocks or commodities based out on PSAR, MACD , RSI and chop index . You can modify the start time and end time based on your timezones. Session value should be from market start to the time you want to square-off
Important: The end time should be at least 2 minutes before the intraday square-off time set by your broker
Comment below if you get good returns
Strategy: Entry Exits using PSAR and momentum and trend using MACD and RSI. A chop index is used as filtering
Indicators used :
Parabolic SAR is a technical indicator that is used to determine the price direction of stocks and it also draws attention to the traders when the price is changing
PSAR helps you:
Identify when a certain price trend is going to change direction
Indicate the most effective level at which to enter into the trade
Indicate the most effective exit point for the trade
Moving average convergence divergence (MACD) is a trend-following momentum indicator that shows the relationship between two moving averages of a security's price. ... Traders may buy the security when the MACD crosses above its signal line and sell—or short—the security when the MACD crosses below the signal line
RSI is intended to chart the current and historical strength or weakness of a stock or market based on the closing prices of a recent trading period.
Buying/Selling
When trading with the parabolic SAR, you would buy a market when the dots move below the current asset price and are green in colour. Alternatively, you would sell a market when the dots move above the current asset price and are red in colour. We use MACD , RSI to ensure that a right trade is picked when PSAR gives an indication. CI is used to stay away from the range bound market as much as possible.
Usage & Best setting :
Choose a good volatile stock and a time frame - 5m.
MA length : 200
RSI threshold : 50
MACD: 12,26,9
There is stop loss and take profit that can be used to optimise your trade
The template also includes daily square off based on your time.

SAR MACDSAR MACD is an idea of implementing Directional MACD with Parabolic SAR to exactly detect and confirm Trend. This p-SAR MACD consist of a HYBRID MACD which acts as MACD TREND oscillator, MACD Oscillator, PSAR Indicator combined with MA line. thus Fake MACD Signals can be eliminated using this SAR MACD. Sideways can be detected using Threshold Levels must be adjusted based on timeframe.
Indicators Hybrid model contains:
1.MACD (12,26,9) Standard with MA Crossovers
2.MACD Trend
3.Parabolic SAR with 0.02
4.Threshold level - indicates Sideways
How to use.
Histogram:
-> HIST MODE: normal MACD indicator
MA Line Color is based on PSAR Direction Blue-Up/ Pink -Down
A crossover upside with a Blue MA line denotes Up confirmation
A Crossover downwards with a red MA line denotes Down Confirmation
Additionally Histogram above zero line and below zero line are to be confirmed
-> MACD MODE: MACD Trend indicator
MA Line Color is based on PSAR Direction Blue-Up/ Pink -Down
A crossover upside with a Blue MA line denotes Up confirmation
A Crossover downwards with a red MA line denotes Down Confirmation
Additionally Histogram above zero line and below zero denotes long term Trend
-> Histogram Color: Indicates candles direction
Yellow indicates Unconfirmed Direction
Green Indicates up direction
Red Indicates Down Direction
Buy Condition:
MA Color - Blue
Histogram- Above Zero
Histogram/Candle -Green
MA Crossover is must
Sell Condition:
MA Color - Red
Histogram- Below Zero
Histogram/Candle -Red
MA Cross under is must
Warning: Must not be used as a standalone indicator. Use for confirmation of your Buy Sell Signals and Entry only.

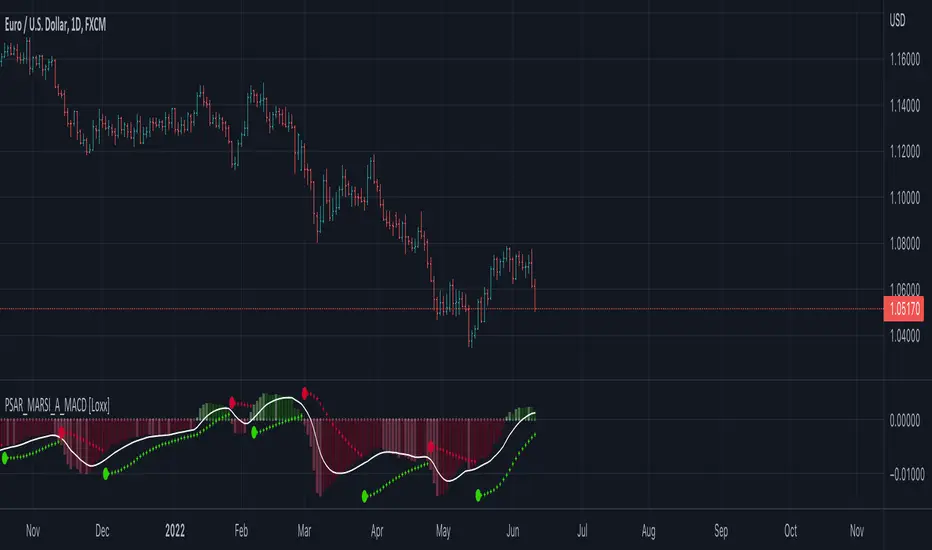
Parabolic SAR MARSI, Adaptive MACD [Loxx]Parabolic SAR MARSI, Adaptive MACD is a trend following indicator that combines MACD, Parabolic SAR, and RSI into a signal indicator.
What is Parabolic SAR?
The parabolic stop and reverse, more commonly known as the "Parabolic SAR," or "PSAR" is a trend-following indicator developed by J. Welles Wilder. It is displayed as a single parabolic line (or dots) underneath the price bars in an uptrend, and above the price bars in a downtrend.
What is MACD?
Moving average convergence divergence (MACD) is a trend-following momentum indicator that shows the relationship between two moving averages of a security’s price. The MACD is calculated by subtracting the 26-period exponential moving average (EMA) from the 12-period EMA.
What is RSI?
The relative strength index (RSI) is a momentum indicator used in technical analysis that measures the magnitude of recent price changes to evaluate overbought or oversold conditions in the price of a stock or other asset. The RSI is displayed as an oscillator (a line graph that moves between two extremes) and can have a reading from 0 to 100. The indicator was originally developed by J. Welles Wilder Jr. and introduced in his seminal 1978 book, “New Concepts in Technical Trading Systems.”
How to combine PSAR, MACD, and RSI into one:
1. Create a new type of moving average called MARSI. MARSI is like a typical moving average but it flexes to RSI sensitivities
2. Calculate MACD for the MARSI of High/Low values
3. Calculate the midpoint MACD between the High/Low MACDs created in step 2
4. Create a final MACD by calculating the MARSI for the midpoint MACD created in step 3
5. Finally, Inject these values into a customized Parabolic SAR function
Results:
-A unique spin on three different indicators that identifies trends of both RSI, MACD, and price of the underlying asset
-Entry, exit, and reversal points in price, RSI, and MACD
-A MACD that adapts to RSI
What's Included?
-Customization of all variables
-A variety of moving averages to smooth the signal line
-Customizable colors
-Alerts for MACD zero-line and signal crosses, and PSAR trend direction changes
Things to know:
-The histogram in this indicator is NOT the normal histogram found in the classic MACD indicator. The histogram here is a histogram of MACD itself. The classic histogram has questionable utility but the histogram in this indicator is very important and useful
-Parabolic SAR is calculated on the MARSI of High/Low values
Future releases:
-Divergences
-Regular, continuation, and exit signals
Happy trading!
MACD + PSAR SetupThis indicator combines 3 elements:-
1. MACD which will act as a source of potential Buy Signal
2. PSAR which provides the confirmation for buy signal and for potential Buy on Dip Strategy
3. Breakout candles which provides the confirmation signal for Buy on Breakout strategy
4. The direction of the trend is provided by the Exponential Moving Average
The strategy is to have any counters which has triggered the MACD Golden Cross signal. These counters are to be out under watchlist for further confirmation.
The Buy Signal is confirmed when:-
1. Price is above EMA Direction(standard is set at 200)
2. PSAR has given the Buy Signal OR a Breakout Candle occurs.
Buy Signal is shown with a Green Diamond symbol whilst the Sell Signal is shown in Red Diamond Symbol.
The bullish and bearish condition is set via a green and red background
The MACD and PSAR codes are derived from the standard codes which is available in tradingview.

SteO: PSAR with AlertSteO: PSAR with Alert, based on the existing PSAR but with constant long alerts for trading bots
7 Moving Averages [Plus]Moving Averages are price based, lagging (or reactive) indicators that display the average price of a security over a set period of time. A Moving Average is a good way to gauge momentum as well as to confirm trends, and define areas of support and resistance. Essentially, Moving Averages smooth out the “noise” when trying to interpret charts. Noise is made up of fluctuations of both price and volume. Because a Moving Average is a lagging indicator and reacts to events that have already happened, it is not used as a predictive indicator but as an interpretive one for confirmations and analysis.
Bollinger Bands (BB) are a widely popular technical analysis instrument created by John Bollinger. The BB consist of a band of three lines which are plotted in relation to security prices. The line in the middle is usually a Simple Moving Average (SMA) set to a period of 20 days (the type of trend line and period can be changed by the trader; however a 20 day moving average is by far the most popular). The SMA then serves as a base for the Upper and Lower Bands which are used as a way to measure volatility by observing the relationship between the Bands and price. Typically the Upper and Lower Bands are set to two standard deviations away from the SMA (The Middle Line); however the number of standard deviations can also be adjusted by the trader.
This script shows 6 moving averages and Bollinger Bands.
Features:
- Standard MA inputs.
- MA type.
- MA period.
- MA source.
- MA resolution (time frame).
- MA Offset.
- Forecasting : forcasted prices are calculated using our MAType and MASource for the MAPeriod.
- Trail: Show only candles not included in the MA calculation.
The color of MA1 depends on the chosen strategy, by default this is the 3EMA strategy. You can also select "Pivot Point Supertrend" or "Ichimoku Trend"
Added "Parabolic Stop and Reverse (PSAR)" . The PSAR is a time and price technical analysis tool primarily used to identify points of potential stops and reverses. In fact, the SAR in Parabolic SAR stands for "Stop and Reverse". The indicator's calculations create a parabola which is located below price during a Bullish Trend and above Price during a Bearish Trend.
Added "Linear Regression Channel" which can be correctly plotted on logarithmic charts. A linear regression channel consists of a median line with 2 parallel lines, above and below it, at the same distance. Those lines can be seen as support and resistance. The median line is calculated based on linear regression of the closing prices but the source can also be set to open, high or low. The height of the channel is based on the deviation of price to the median line. Extrapolating the channel forward can help to provide a bias and to find trading opportunities.

Crypto Scalper Divergence Macd Psar Ema 200This is a very efficient crypto scalper adapted to very short timeframes, however it can be optimized for other timeframes and assests as well.
Its components are
MACD
P SAR
EMA 200
Risk management
Rules for entry:
For short : we have an uptrend on PSAR , histogram is positive (divergence MACD) and close of a candle is below EMA 200
For long : we dont have an uptrend on PSAR, histogram is negative(divergence MACD) and close of a candle is above EMA 200
Rules for exit:
We exit when we either find a reverse condition than the entry one, or based on stop loss/take profit that are calculated on % movements of the price.
If you have any questions, let me know !

High/low crypto strategy with MACD/PSAR/ATR/EWaveToday I am glad to bring you another great creation of mine, this time suited for crypto markets.
MARKET
Its a high and low strategy, designed for crypto markets( btcusd , btcusdt and so on), and suited for for higher time charts : like 1hour, 4hours, 1 day and so on.
Preferably to use 1h time charts.
COMPONENTS
Higher high and lower low between different candle points
MACD with simple moving average
PSAR for uptrend and downtrend
Trenddirection made of a modified moving average and ATR
And lastly elliot wave oscillator to have an even better precision for entries and exits.
ENTRY DESCRIPTION
For entries we have : when the first condition is meet(we have a succession on higher high or lower lows), then we check the macd histogram level, then we pair that with psar for the direction of the trend, then we check the trend direction based on atr levels with MA applied on it and lastly to confirm the direction we check the level of elliot wave oscillator. If they are all on the same page we have a short or a long entry.
STATS
Its a low win percentage , we usually have between 10-20% win rate, but at the same time we use a 1:30 risk reward ratio .
By this we achieve an avg profit factor between 1.5- 2.5 between different currencies.
RISK MANAGEMENT
In this example, the stop loss is 0.5% of the price fluctuation ( 10.000 -> 9950 our sl), and tp is 15% (10.000 - > 11500).
In this example also we use a 100.000 capital account, risking 5% on each trade, but since its underleveraged, we only use 5000 of that ammount on every trade. With leveraged it can be achieved better profits and of course at the same time we will encounter bigger losses.
The comission applied is 5$ and a slippage of 5 points aswell added.
For any questions or suggestions regarding the script , please let me know.

Full strategy AllinOne with risk management MACD RSI PSAR ATR MAHey, I am glad to present you one of the strategies where I put a lot of time in it.
This strategy can be adapted to all type of timecharts like scalping, daytrading or swing.
The context is the next one :
First we have the ATR to calculate our TP/SL points. At the same time we have another rule once we enter(we enter based on % risk from total equity, in this example 1%, at the same time, lowest ammount for this example is 0.1 lots, but can be modified to 0.01), so we can exit both by tp/sl points, or by losing 1% of our equity or winning 1% of our total equity. It's dinamic.
The strategy is made from
Trend direction :
PSAR
First confirmation point :
Crossover between 10EMA and Bollinger bands middle point
Second confirmation
MACD histogram
Third confirmation
RSI overbought/oversold levels
For entries : we check trend with psar, then once ema cross bb middle point, we confirm together with rsi level for overbought/oversold and macd histogram ( > 0 or <0).
We exit, when we have opposite sign, like from buy to sell or sell to buy, or when we reach tp/sl points, or when we reach % basaed equity points.
It can be changed to be fixed lots, or fixed tp/sl , you just have to uncomment the size from entries, and tp/sl lines.
At the same time, it has the possibility if one desires, to trade only concrete forex session like european, asian and so on for intraday trading.
Hope you enjoy it.
Let me know how it goes.

Power PSARParabolic SAR can reverse often in choppy environments. Power PSAR will indicate only when there's sufficient slope that cuts through the prior PSAR trend lines.

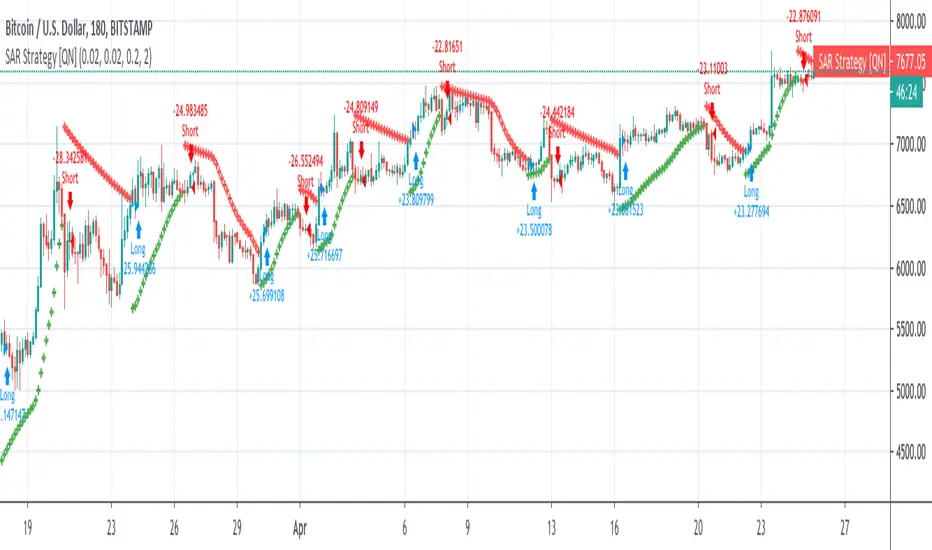
Parabolic SAR Strategy (on close) [QuantNomad]Created a Parabolic SAR strategy where price has to close under/above the level before for it to reverse. This way it should be a bit more stable and protect you from false breakouts.
It was impossible to adjust the built-in "sar" function so I implemented PSAR from scratch. So if you're interested in how it's work inside you can check the code and probably adjust to your need if you have a custom modification of PSAR in your mind.

Timeshifter Triple Timeframe Strategy w/ SessionsOverview
The "Enhanced Timeshifter Triple Timeframe Strategy with Session Filtering" is a sophisticated trading strategy designed for the TradingView platform. It integrates multiple technical indicators across three different timeframes and allows traders to customize their trading Sessions. This strategy is ideal for traders who wish to leverage multi-timeframe analysis and session-based trading to enhance their trading decisions.
Features
Multi-Timeframe Analysis and direction:
Higher Timeframe: Set to a daily timeframe by default, providing a broader view of market trends.
Trading Timeframe: Automatically set to the current chart timeframe, ensuring alignment with the trader's primary analysis period.
Lower Timeframe: Set to a 15-minute timeframe by default, offering a granular view for precise entry and exit points.
Indicator Selection:
RMI (Relative Momentum Index): Combines RSI and MFI to gauge market momentum.
TWAP (Time Weighted Average Price): Provides an average price over a specified period, useful for identifying trends.
TEMA (Triple Exponential Moving Average): Reduces lag and smooths price data for trend identification.
DEMA (Double Exponential Moving Average): Similar to TEMA, it reduces lag and provides a smoother trend line.
MA (Moving Average): A simple moving average for basic trend analysis.
MFI (Money Flow Index): Measures the flow of money into and out of a security, useful for identifying overbought or oversold conditions.
VWMA (Volume Weighted Moving Average): Incorporates volume data into the moving average calculation.
PSAR (Parabolic SAR): Identifies potential reversals in price movement.
Session Filtering:
London Session: Trade during the London market hours (0800-1700 GMT+1).
New York Session: Trade during the New York market hours (0800-1700 GMT-5).
Tokyo Session: Trade during the Tokyo market hours (0900-1800 GMT+9).
Users can select one or multiple sessions to align trading with specific market hours.
Trade Direction:
Long: Only long trades are permitted.
Short: Only short trades are permitted.
Both: Both long and short trades are permitted, providing flexibility based on market conditions.
ADX Confirmation:
ADX (Average Directional Index): An optional filter to confirm the strength of a trend before entering a trade.
How to Use the Script
Setup:
Add the script to your TradingView chart.
Customize the input parameters according to your trading preferences and strategy requirements.
Indicator Selection:
Choose the primary indicator you wish to use for generating trading signals from the dropdown menu.
Enable or disable the ADX confirmation based on your preference for trend strength analysis.
Session Filtering:
Select the trading sessions you wish to trade in. You can choose one or multiple Sessions based on your trading strategy and market focus.
Trade Direction:
Set your preferred trade direction (Long, Short, or Both) to align with your market outlook and risk tolerance. You can use this feature to gauge the market and understand the possible directions.
Tips for Profitable and Safe Trading:
Recommended Timeframes Combination:
LT: 1m , CT: 5m, HT: 1H
LT: 1-5m , CT: 15m, HT: 4H
LT: 5-15m , CT: 4H, HT: 1W
Backtesting:
Always backtest the strategy on historical data to understand its performance under various market conditions.
Adjust the parameters based on backtesting results to optimize the strategy for your specific trading style.
Risk Management:
Use appropriate risk management techniques, such as setting stop-loss and take-profit levels, to protect your capital.
Avoid over-leveraging and ensure that you are trading within your risk tolerance.
Market Analysis:
Combine the script with other forms of market analysis, such as fundamental analysis or market sentiment, to make well-rounded trading decisions.
Stay informed about major economic events and news that could impact market volatility and trading sessions.
Continuous Monitoring:
Regularly monitor the strategy's performance and make adjustments as necessary.
Keep an eye on the results and settings for real-time statistics and ensure that the strategy aligns with current market conditions.
Education and Practice:
Continuously educate yourself on trading strategies and market dynamics.
Practice using the strategy in a demo account before applying it to live trading to gain confidence and understanding.

Multi-Indicator Swing [TIAMATCRYPTO]v6# Strategy Description:
## Multi-Indicator Swing
This strategy is designed for swing trading across various markets by combining multiple technical indicators to identify high-probability trading opportunities. The system focuses on trend strength confirmation and volume analysis to generate precise entry and exit signals.
### Core Components:
- **Supertrend Indicator**: Acts as the primary trend direction filter with optimized settings (Factor: 3.0, ATR Period: 10) to balance responsiveness and reliability.
- **ADX (Average Directional Index)**: Confirms the strength of the prevailing trend, filtering out sideways or choppy market conditions where the strategy avoids taking positions.
- **Liquidity Delta**: A volume-based indicator that analyzes buying and selling pressure imbalances to validate trend direction and potential reversals.
- **PSAR (Optional)**: Can be enabled to add additional confirmation for trend changes, turned off by default to reduce signal filtering.
### Key Features:
- **Flexible Direction Trading**: Choose between long-only, short-only, or bidirectional trading to adapt to market conditions or account restrictions.
- **Conservative Risk Management**: Implements fixed percentage-based stop losses (default 2%) and take profits (default 4%) for a positive risk-reward ratio.
- **Realistic Backtesting Parameters**: Includes commission (0.1%) and slippage (2 points) to reflect real-world trading conditions.
- **Visual Signals**: Clear buy/sell arrows with customizable sizes for easy identification on the chart.
- **Information Panel**: Dynamic display showing active indicators and current risk settings.
### Best Used On:
Daily timeframes for cryptocurrencies, forex, or stock indices. The strategy performs optimally on assets with clear trending behavior and sufficient volatility.
### Default Settings:
Optimized for conservative position sizing (5% of equity per trade) with an initial capital of $10,000. The backtesting period (2021-2023) provides a statistically significant sample of varied market conditions.
