Scalp Tool
This script is primarily intended as a scalping tool.
The theory of the tool is based on the fact that the price always returns to its mean.
Elements used:
1. VWMA as a moving average. VWMA is calculated once based on source close and once based on source open.
2. the bands are not calculated like the Bollinger Band, but only a settlement is calculated for the lower bands based on the Lows and for the upper bands based on the Highs. Thus the bands do not become thicker or thinner, but remain in the same measure to the mean value above or below the price.
3. a volume filter on simple calculation of a MA with deviation. Therefore, it can be identified if a volume breakout has occurred.
4. support and resistance zones which are calculated based on the highs and lows over a certain length.
5. RSI to determine oversold and overbought zones. It also tries to capture the momentum by using a moving average (variable selectable) to filter the signals. The theory is that in an uptrend the RSI does not go below 50 and in a downtrend it does not go above 50.
However, this can be very different depending on the financial instrument.
Explanation of the signals:
The main signal in this indicator Serves for pure short-term trading and is generated purely on the basis of the bands and the RSI.
Only the first bands are taken into account.
Buy signal is generated when the price opens below the lower band 1 and closes above the lower band 1 or the RSI crosses a value of 25 from bottom to top.
Sell signal is generated when the price opens above the Upper Band 1 and closes below the Upper Band 1 or the RSI crosses a value of 75 from top to bottom.
The position should be closed when the price hits the opposite band. Alternatively, it can also be closed at the mean.
Other side signals:
1. breakouts:
The indicator includes 2 support and resistance zones, which differ only in length. For the breakout signals, the short version of the R/S is used. A signal is generated when the price breaks through the zones with increased volume. It is then assumed that the price will continue to follow the breakout.
The values of the S/R are adjustable and marked with "BK".
The value under Threshold 2 defines the volume breakout. 4 is considered as the highest value. The smaller the value, the smaller the volume must be during a breakout.
2. bounce
If the price hits a S/R (here the long variant is used with the designation "Support" or "Resistance") and makes a wick with small volume, the script assumes a bounce and generates a Sell or Buy signal accordingly.
The volume can be defined under "Threshold".
The S/R according to the designation as well.
Combined signals:
If the value of the S/R BK and the S/R is the same and the bounce logic of the S/R BK applies and an RSI signal is also generated, a signal is also plotted.
Here the idea was to get very strong signals for possible swing entries.
4. RSI Signals
The script contains two RSI.
RSI 1:
Bullish signal is generated when the set value is crossed from the bottom to the top.
Bearish signal is generated when the set value is crossed from the top to the bottom.
RSI 2:
Bullish signal is generated when the set value is crossed from the top to the bottom.
Bearish signal is generated when the set value is crossed from bottom to top.
For RSI 2 the theory is taken into account according to the description under Used elements point 5
Optical trend filter:
Also an optical trend filter was generated which fills the bands accordingly.
For this the VWMA is used and the two average values of the band.
Color definition:
Gray = Neutral
Red = Bearish
Green = Bullish
If the mean value is above the VWMA and the mean value based on the closing price is above the mean value based on the open price, the band is colored green. It is a bullish trend
If the mean value is below the VWMA and the mean value based on the closing price is below the mean value based on the open price, the band is colored red.
The band is colored gray if the mean value is correspondingly opposite. A sideways phase is assumed.
The script was developed on the basis of the pair BTCUSD in the 15 minute chart and the settings were defined accordingly on it. The display of S/R for forex pairs does not work correctly and should be hidden. The logic works anyway.
When using the script, all options should first be set accordingly to the asset and tested before trading afterwards. It applies of course also here that there is no 100% guarantee.
Also, a strong breakout leads to false signals and overheating of the indicator.
Tìm kiếm tập lệnh với "scalp"

Scalping Trading System ALERT Crypto and StocksThis is the alert version of the strategy with the same name.
Indicators
SImple Moving Average
Exponential Moving Average
Keltner Channels
MACD Histogram
Stochastics
Rules for entry
long= Close of the candle bigger than both moving averages and close of the candle is between the top and bot levels from Keltner . At the same time the macd histogram is negative and stochastic is below 50.
short= Close of the candle smaller than both moving averages and close of the candle is between the top and bot levels from Keltner . At the same time the macd histogram is positive and stochastic is above 50.
Rules for exit
We exit when we meet an opposite reverse order.
This strategy has no risk management inside, so use it with caution !

OMEN-SCALPING-TRENDScalp the market using low time frames and high leverage. Works well between 1m-10m charts.
Allow the candle to close before entering the position.
Set alert to "ONCE PER BAR CLOSED"

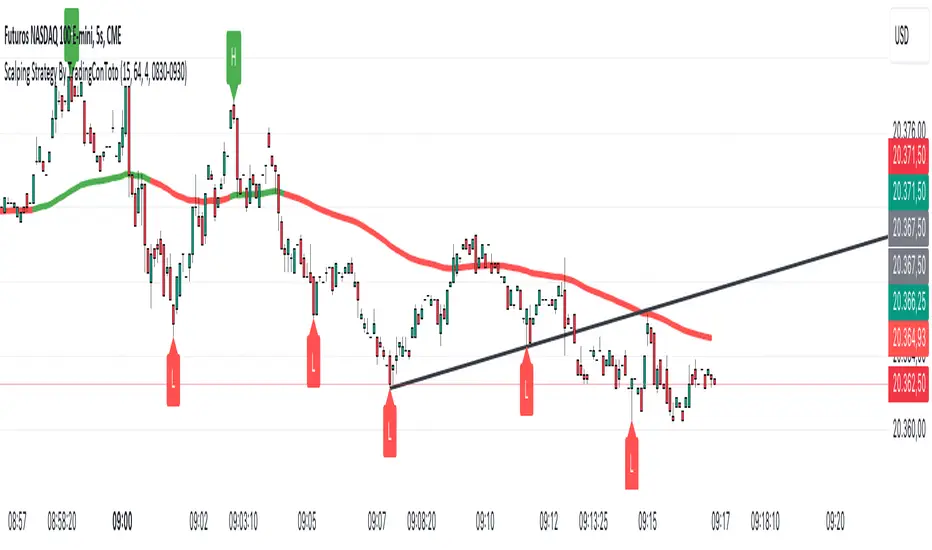
Scalping Strategy By TradingConTotoScript Description: "Scalping Strategy By TradingConToto"
This scalping strategy is designed to trade in volatile markets, taking advantage of rapid price movements. It uses pivots to identify key entry and exit points, along with exponential moving averages (EMAs) to determine the overall trend.
Key Features:
Dynamic Pivots: Calculates pivot highs and lows to identify support and resistance zones, improving entry accuracy.
Market Trend Analysis: Utilizes a 100-period EMA for long-term trend analysis and a 25-period EMA for short-term trends, facilitating informed decision-making.
Automated Entry and Exit: Generates buy and sell signals based on EMA crossovers and specific market conditions, ensuring you don't miss opportunities.
Risk Management: Allows you to set take profit and stop loss levels tailored to market volatility, using the ATR for effective risk management.
User-Friendly Interface: Easily customize strategy parameters such as pivot range, stop loss and take profit pips, and spread.
Requirements:
Ideal for use on short time frames during high activity sessions, like the configured scalping session.
Activate buy and sell options according to your preference and analyze performance using TradingView’s tools.
Note:
This script is a tool and does not guarantee results. It is recommended to test in a simulated environment before applying it to real accounts.
Optimize your scalping operations and enhance your market performance with this effective strategy!
Scalper ALThe script is an updated version of our old Scalper 1.1. It includes a linear regression line for trend indication, a moving average line and the buy sell labels. The fluctuation and strength of the trend can be discerned from Pearson's value and its sign. Algorithmic trading can be done by setting an alarm. There is a provision to set target and stop loss in setting window(for algo trading). It's more profitable on the 15 minute chart, and applies to any type of stock.The color of the moving average represents the short term trend.
Contact us using the links below to gain access to this indicator

Scalper V2Hey,
This is upgrade Version of Scalper V2 add couple of thing extra as
CCI:-
overbought B and over sold with S with water effect color
BB:-
bb lower cross Water effect with green color with cci B print
bb higher cross water effect with red color with cci S print
confirmation trade:-
please use with other indicators also for final Confirmation
find bullish div on CCI before enter long
same as bearish div on cci before short
see videos on youtube about bb and cci
MUST NEED BASIC INFO ABOUT BB AND CCI
FEEL FREE TO CHANGE COLOR AS YOU WISH AND ACT ALARMS ON COUPLE OF THING
if there any question please fell free to Reach me
thanks you so much
Respect yourself and others will respect you
JAS TOOR

Scalping Strategy: FVG + Engulfing
This is a scalping strategy based on the Fair Value Gap (FVG) and Engulfing pattern confirmation. It identifies the high and low of the first 5-minute candle after the 9:30 AM EST market open and waits for a breakout supported by a Fair Value Gap. A trade is only triggered after a retest of the FVG zone followed by an engulfing candle in the direction of the breakout. Trades are entered with a fixed 3:1 risk-to-reward ratio and limited to 2 entries per trading day to avoid overtrading. Ideal for NASDAQ scalping on a 1-minute chart.

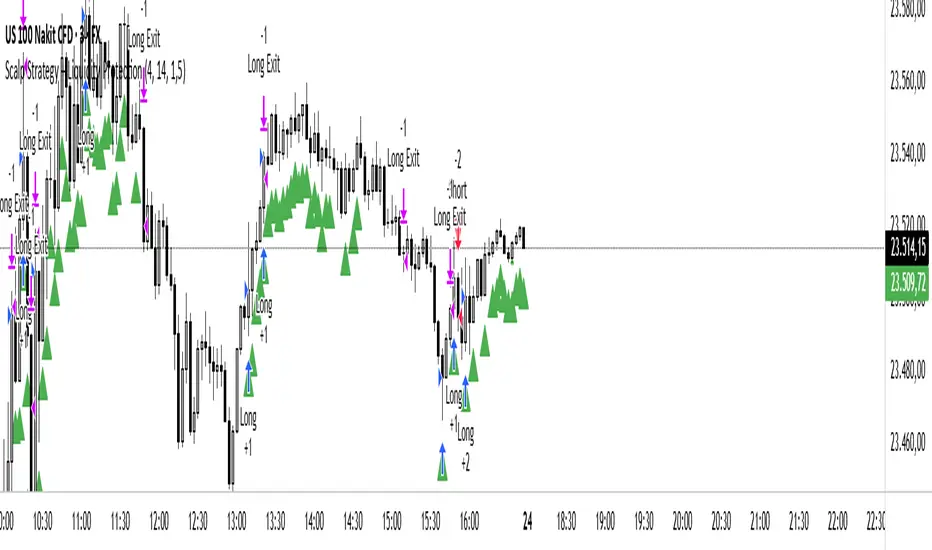
Scalp Liquidity Strategy v1this strategy combines scalp signals with liquidity concepts. Protected Highs/Lows, Fair Valıue Gaps. Designed for scalp trading on lower time frames.
Scalping 15min: EMA + MACD + RSI + ATR-based SL/TP📈 Strategy: 15-Minute Scalping — EMA + MACD + RSI + ATR-based SL/TP
This scalping strategy is designed for 15-minute charts and combines trend-following and momentum confirmation with dynamic stop loss and take profit levels based on volatility.
🔧 Indicators Used:
EMA 50 — identifies the main trend
MACD Histogram — confirms momentum direction
RSI (14) — filters overbought/oversold conditions
ATR (14) — dynamically sets SL and TP based on market volatility
📊 Entry Conditions:
Long Entry:
Price is above EMA 50
MACD histogram is positive
RSI is above 50 but below 70
Short Entry:
Price is below EMA 50
MACD histogram is negative
RSI is below 50 but above 30
🛑 Risk Management:
Stop Loss: 1×ATR (user-configurable)
Take Profit: 2×ATR (user-configurable)
These values can be adjusted in the script inputs depending on your risk/reward preference or market conditions.
⚠️ Notes:
Strategy is optimized for scalping fast-moving pairs (e.g. crypto, forex).
Works best in trending markets.
Use backtesting and forward testing before live trading.

Scalp BLACK | WHITE, Bollinger - RSIIntroductory Description:
This indicator - oscillator (Scalp BLACK | WHATE script) from GenaAk which perfectly shows volatility and shows potentially the best entry points into a position. The higher the volatility is, the wider the bands are. Conversely, when price crawls up or down (low volatility ), the bands get narrower. After each narrowing, the channel widens and the price moves sharply up or down. Consequently, after each "contraction" it is logical to expect an expansion. For this purpose, I have provided another additional signal by changing the color of bars. For example, if the last bars in the channel were black on the lower part of the channel, the price will go up; if the bars were white on the upper part of the channel, the price will go down. This usually works during periods of volatility .
Remember: this will only work if there isn't a clear trend. If there is (trend) - then the directional chart movement in the highlighted part of the channel will only indicate that the trend will continue.
A brief instruction:
The position should be entered when the chart bar enters the selected channel bar in the opposite direction.
Additional confirmation of a potential reversal is the change of color of the bars.
The upper part of the channel is white - sell
Lower part of the channel black - buy
_______________________________________
Перевод на русский:
Вводное описание:
Этот индикатор - оссцилятор (скрипт Scalp BLACK | WHATE) от GenaAk который отлично показывает волатильность и показывает потенциально наилучшие точки входа в позицию. Чем больше волатильность — тем полосы шире. И напротив, когда цена ползет вверх или вниз, (низкая волатильность) — сужаются и полосы. После каждого сужения канала происходит расширение — и цена резко движется вверх или вниз. Следовательно, после каждого «сужения» вполне логично ждать расширения. Для этого я предусмотрел как еще один дополнительный сигнал изменение цвета баров. На пример при сужении канала последними были черные бары на нижней части канала то цена пойдет в верх, если бары были белыми и на верхней части канала то цена пойдет в низ. Как правило, это работает в период волатильности.
Помните: это сработает лишь в том случае, когда нет ярко выраженного тренда. Если он есть (тренд) — то направленное движение графика в выделенной части канала будет свидетельствовать лишь о том, что тренд будет продолжаться.
Краткая инструкция:
В позицию следует входить при входе бара графика в выделенную полосу канала в противоположенную сторону.
Дополнительным подтверждением является на потенциальный разворот изменение цвета баров.
Верхняя часть канала белый цвет - продажа
Нижняя часть канала черный цвет - покупка

Scalp with AlertsThis is for entry alert for the strategy i posted here :
Use both on same chart. Here is how to use :
For long entries >
Go to alerts and add new alert. Choose 'Scalp with Alerts', plot3, long . Do rest settings as per your wish.
For short entries >
Choose short instead long, rest same.
Here is how to trade the whole setup:
Make sure no position is already open in same direction you want to trade(ie. long, short) .
Set the alert. Do not set alram on every bar setting. So after one ring it will deactivate .
When you get alram, open position. Place close position order at profit of 50 USD.
Do not open any new position in same direction until your this open order gets closed.
Once order closed , activate the alert again. Make sure you do not have more than one position open at same time.
User pyramid laddering technique to average your entry if price goes down after you open the position.
By using proper risk and money management you will make consistent profit. I use 25x leverage on Bitmex, you can use whatever is fit for you.
Try to avoid more then 25x leverage otherwise your portfolio can wipe out fast.
If is rainy season at my place and if you like my work, occasionally buying a coffee will boost me again.
My BTC address:
3BMEXvkAngigKesAYzi9wuBJyiCc5HxmJk
If you already bought me coffee, why not come over to inbox and have some chit chat :) .

Scalping Signals with MTF Fibo BandsThis indicator is a scalping / intraday signal system built on Multi-Timeframe (MTF) Fibonacci Bands, combined with an RSI midline filter and an optional direction-lock mechanism to reduce consecutive losing entries.
🔹 What does this indicator do?
It plots two independent Fibonacci Band sets (A & B), each calculated from a higher timeframe SMA + ATR.
Entry zones are defined between Band 2 and Band 3, representing statistically extreme price areas.
You can choose to generate signals from:
Band A only
Band B only
BOTH (A + B confirmation)
📈 Entry Logic
LONG
Price closes inside the Lower Zone (between Fib2 Lower & Fib3 Lower)
RSI is above the midline (default 50)
SHORT
Price closes inside the Upper Zone (between Fib2 Upper & Fib3 Upper)
RSI is below the midline (default 50)
🟧 Direction Lock System
If enabled, the indicator locks the trade direction when a position hits Stop Loss before reaching TP1.
This prevents repeated entries in the same direction during unfavorable conditions.
🔓 Unlock Logic
The lock can be removed when:
RSI crosses back over the midline (RSI > 50 for LONG, RSI < 50 for SHORT)
AND price closes again inside the valid Band 2–3 zone
With the optional setting enabled, a new entry can occur on the same candle
🛑 Stop Loss Logic (Important)
This indicator uses price-action-based stop logic, not fixed pip stops.
1️⃣ Before TP1
LONG: Two consecutive candle closes below Fib3 Lower
SHORT: Two consecutive candle closes above Fib3 Upper
⚠️ Because SL depends on candle closes, you must monitor lower timeframes (1m or below) to react quickly and avoid delayed exits.
2️⃣ After TP1 (Break-Even Protection)
Once TP1 is touched:
SL automatically shifts to Break-Even (entry price)
Any return to entry will close the position
⚠️ Usage Warning
This indicator is NOT designed for sharp, explosive, or news-driven moves
Avoid using it during:
High-impact news
Extremely fast impulsive candles
Sudden volatility spikes
Best performance is achieved in structured price action environments, not chaotic market conditions.

Scalping EMA + Pinbar Strategy (London & NY only, BE @ 1R)The scalping trading system uses two types of indicators:
EMA 10, EMA 21, EMA 50
Pinbar Indicator
Rules for entering a buy order:
If the closing price is above the EMA 50, the trend is uptrend and only buy orders should be considered.
The EMA 10 and EMA 21 lines must simultaneously be above the EMA 50.
The price must correct down at least 50% of the area created by the EMA 10 and EMA 21, or correct further down.
A Type 1 Pinbar candle (marked by the Pinbar indicator) must appear; this Pinbar candle must react to at least one of the three EMA lines (EMA 10, EMA 21, EMA 50) and close above the EMA 50.
This Pinbar candle must have a Pinbar strength value (marked by the Pinbar indicator) less than 2 to be considered valid. Check if the closing price of this pinbar candle is higher than the 50-day EMA and if the 10-day and 21-day EMAs are also higher than the 50-day EMA. If so, the conditions have been met and you can begin trading.
Place a buy stop order 0.1 pip higher than the highest price of the pinbar candle, and a stop loss order 0.1 pip lower than the lowest price of the pinbar candle. Set the take profit at 3R.
If the price moves past the previously set stop loss, cancel the pending order.
When the price moves 1R, move the stop loss back to the entry point.
The next trade can only be executed after the previous trade has moved the stop loss back to the entry point.
Rules for placing sell orders:
If the closing price is below the 50-day EMA, the trend is bearish, and only sell orders should be considered. The 10-day and 21-day EMAs must both be below the 50-day EMA.
The price must correct downwards by at least 50% of the area formed by the 10-day and 21-day EMAs, or even further.
A Type 1 pinbar candle (marked by the Pinbar indicator) must appear. This pinbar candle must react to at least one of the three EMAs (EMA 10, EMA 21, EMA 50) and close below the EMA 50.
This pinbar is valid if its strength (indicated by the Pinbar indicator) is less than 2. Verify that the closing price of this pinbar candle is below the EMA 50 and that both the EMA 10 and EMA 21 are below the EMA 50. If all conditions are met, the trade can be executed.
(This appears to be a separate entry rule and not part of the previous text.) Place a sell stop order 0.1 pip below the lowest point of the pinbar candle, and a stop loss order 0.1 pip above the highest point of the pinbar candle. Set the take profit point at 3R.
If the price moves past the previously set stop-loss point, cancel the pending order.
When the price moves 1R, move the stop-loss point back to the entry point.
The next trade can only be executed after the previous trade has moved the stop-loss point back to the entry point.

Scalping EMA9/15 This indicator is designed for high-accuracy intraday scalping based on a refined version of the popular EMA9–EMA15 trend-following technique.
It filters weak or premature entries by requiring a retest of the EMA zone before generating a Buy/Sell signal — drastically reducing false breakouts.

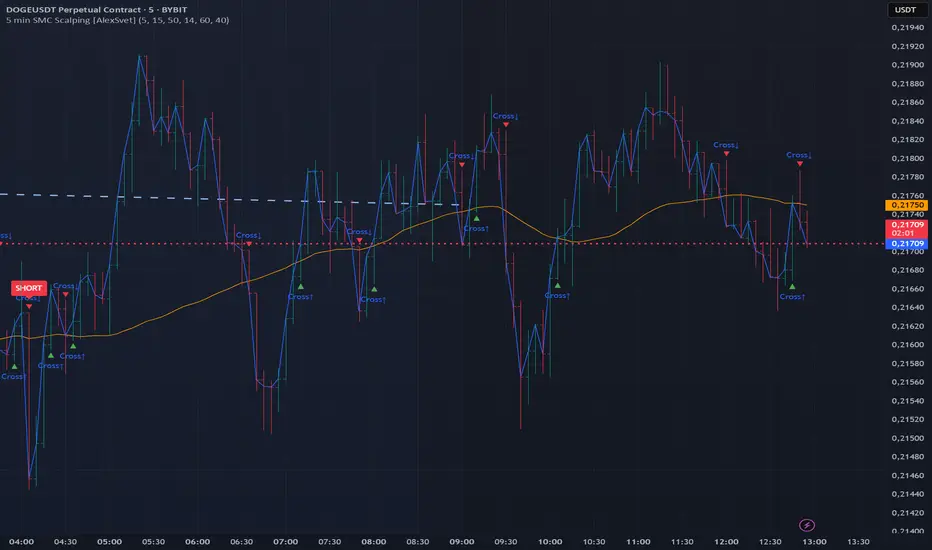
5 min SMC Scalping [AlexSvet]Scalping for 5 minute chart.
SMC based signals.
Light and clear indicator.
Scalping Indicator v6This Script Show You Recent Scalping Trades u can get instantly we have use the knowledge we gain across the time we might be right or wrong do your own research and use this indicator on ur own risk

Scalping Strategy (5min)This indicator is designed for scalping strategies on a 5-minute timeframe. It generates signals based on two RSI crossovers and incorporates moving averages to identify trends. Additionally, a Bollinger Band is included to eliminate the need for an additional Bollinger Band on the chart.
Please note that this indicator does not guarantee 100% accurate signals and may produce false signals. It is recommended to use this indicator in conjunction with other indicators such as Stochastic, MACD, SuperTrend, or any other suitable indicators to enhance the accuracy of trading decisions.
1) Signal Generation: The indicator generates buy and sell signals based on two RSI crossovers. A buy signal is generated when the fast RSI crosses above the slow RSI, indicating potential bullish momentum. Conversely, a sell signal is generated when the fast RSI crosses below the slow RSI, suggesting potential bearish momentum.
2) To adjust the indicator to your specific chart and trading preferences, you have the flexibility to modify the RSI and moving average (MA) values. By changing the RSI values (slow RSI length and fast RSI length), you can fine-tune the sensitivity of the RSI crossovers to suit different timeframes and market conditions. Similarly, adjusting the MA values (slow MA period and fast MA period) allows you to adapt the indicator to the desired trend identification and short-term trend confirmation.
3) Pay attention to trades that are confirmed by the short-term moving average (MA) aligning with the desired direction. For buy signals, ensure that the short MA is tending upward, indicating a potential uptrend. For sell signals, confirm that the short MA is trending downward, suggesting a potential downtrend.
4) Moving Averages: The indicator uses a 200-period moving average (MA) to identify the overall trend and a short-term MA for additional confirmation.
5) Bollinger Band: The included Bollinger Band is not directly used in the indicator's calculations. However, it is provided for convenience so that users don't need to add another Bollinger Band to their chart separately.
6) Exercise caution when the short MA is below the 200-period MA but showing signs of attempting an upward move. These situations may indicate a potential reversal or consolidation, and it is advisable to avoid taking trades solely based on the 200-period MA crossover in such cases.
Remember that these guidelines are intended to provide additional insights and should be used in combination with your trading judgment and analysis.

scalping with market facilitationThis strategy is for scalping low timeframes for 10 pips. I have yet to see a strategy with this unique combo of indicators.
First we have volume indicator market facilitation, where we are looking for volume and mfi to be up, then we want the adx 5 to be above level 30 and above its ema period 3, then if these conditions are good we take shorts when ema 8 is below ema 100 and longs when ema8 is above ema 100 with parabolic sar in its propet place, also to verify trend we have obv over or under its ema of 55 and macd line over its signal line.
I have heikenashi bars on with the regular priceline showing so j see actual price levels, when i get a buy signal i set a buystop above the high of that bar and have a stoploss of 7.5 pips and a take profit of 10 pips, reverse for sells, i have to use metatrader to trade so i use this as my signals to trade.
Note this is not advice trade at your own risk no guarantees in anything in life, but i wanted to share this for it is helping me with my trades to be more strict and semi mechanical. I use it for forex time frames 1 3 5 15 mjn

Scalp LevelsThis script is to provide scalp levels based on Price Action. It is mainly built keeping price action of SPY/SPX in mind.

scalping against trapped countertrendAbstract
This script attempts to find the end of countertrend.
This script uses oscillators to measure long term and short period trends. When the long term trend keeps positive and clear short term period is over, this script provides a buy signal.
This script does not contain pullback, cut loss and re-enter. You need to add it manually.
Introduction
Many traders want to buy when long term trend is bullish and short term pullback is over.
This is because we can take advantage to the emotion of countertrend traders.
Countertrend traders realizes their profit is finite and therefore want to protect their profit well and limit their loss.
This script is inspired by a searchable trading strategy video.
The video mentioned 4 points.
(1) long term trend. The video did not spend much ink on this point. You can use any method to observe.
(2) clear pullback bar (at least 50% body)
(3) weak bar after clear pullback
(4) entry trigger buy stop
This script attempts to quantize these points to determine trading direction.
This script is originally designed for timeframes lower than examples in the video but you can apply it on any timeframe.
Computing and Adjusting
(1) long term trend
This script uses smoothed stochastic.
(2) clear pullback bar
Since this script is originally designed for timeframes lower than examples in the video, so the condition becomes:
RSI is low enough
(3) weak bar after clear pullback
RSI goes back from low level.
(4) entry trigger buy stop
This script does not include this condition.
You can decide enter when buy stop or pullback.
Parameters
x_src : the value for computing oscillators
x_len_a : how many bars for measuring short term trend
x_len_b : how many bars for measuring long term trend
x_k_b : smooth long term trend, the average value of stochastic values
x_changk = check if clear short term pullback appears recently. 1 means do not use, larger numbers means how long of periods to check.
x_rsi_ct : threshold of short term pullback clear
x_rsi_ft : threshold of short term pullback end
Reading numbers in Strategy Tester
Most possible loss :
(1) to find rational pullback. Generally 1/3 to 2/3 atr.
(2) to find cut loss distance. Generally 1 to 2 atr.
Most possible profit :
to find if trading the opposite direction against this script is profitable.
Conclusion
This script can suggest us trading direction.
Waiting for pullback can reduce risk, compared to buy stop.
This script does not provide good signals in sideways markets.
Reference
A searchable trading strategy video

scalping low lag tema etalCredit for original idea goes to 1 min forex scalping by mikegoryunov
Changes include several lower lag filters (See line 3 for a list)
and values for profit, loss, and trail_points (See lines 48:53)
a, b, & c represent fast, medium, and slow filters. Basic idea is to monitor
crossovers of the three filters to determine buy/sells. Exits occur quickly within
the next time interval.
Note that this may be used for stocks and forex. The time interval can vary widely.
I have concerns about how to incorporate transaction costs with so many transactions.

Scalping Line Indicator"A derivated indicator of the stair step moving average exploration. This time, the stairstep MA (the main trend) represent the center of the oscillator.
The signal line (maroon line) is the difference between this center and a simple moving average of 7 periods by default.
Trade signals seems pretty effective on tick charts representation. Take long when signal line cross above zero and short below it. Of course, as always objectives and stoploss protection are your responsabilities
You can play with different parameters to sweet any other instruments."
Coded referring the"Scalping Line Indicator" from prorealcode for Tradingview users after one of my followers asked me to do so.
