Tìm kiếm tập lệnh với "scalp"
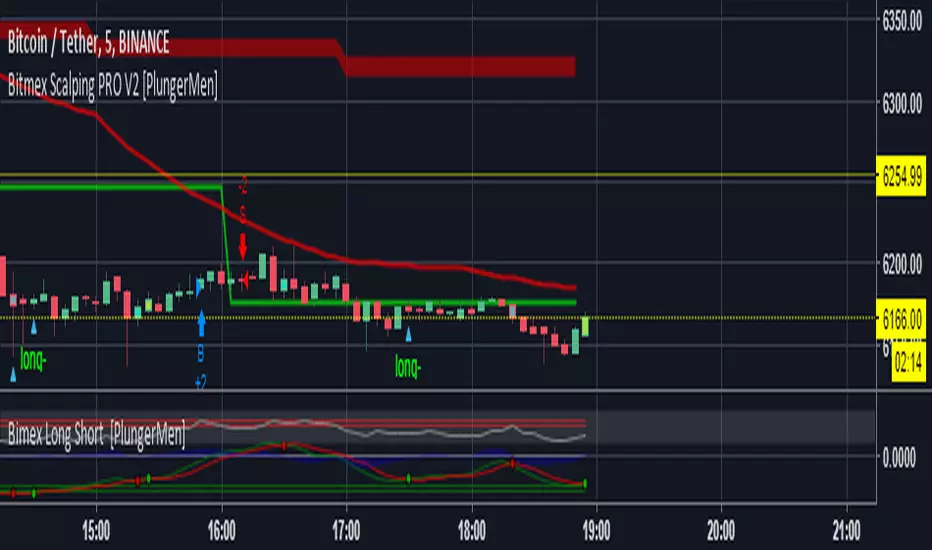
Bitmex Scalping PRO V2 [PlungerMen]Hello!
Bitmex Scalping PRO V2 is a upgrade version of a Bitmex Scalping Pro
BitMex Scalping PRO V2 can use for every coin
BitMex Scalping PRO V2 is available for all frames
This Script is perfectly functional and works well by me and the best way to use this script is to use it with “Bitmex Long Short" script, both compliment for each other. the "Bitmex Long Short" script is Free, you can find it by searching “Bimex”
If you want to be more accurate and more efficient, more comfortable when you do not want to see too many other indicators, you can register for our Professional edition.
- The Professional Edition supports Level 1 and Level 2 commands ( display at chart : LONG+, long-, SHORT,+,short- ), which are very effective in allocating funds and optimizing your profits
Besides that,You will be supported by personal preferences, profit maximization
- Register for a Professional version will be used 2 Script, Bitcoin -3.33% -3.27% Scalping Pro and Bitmex Long Short Pro
- We will invite you to the signal channel Telgram with the announcement of the bottom and the peak of the BTC -3.33% -3.27% 0.60% -0.13% ,the big variable variable has exists
**We hope you enjoy this script. Your support will help us develop more good quality scripts in the future to serve the community **
**Remember, Like this script and posivite feedback if you are satisfied**
if you have any questions, post a comment ... below here
*********** Guide:
+ option for all frames : Click setting and input high and low for time inteval
+ hide wave trend : Click setting -> click Style --> Up trend Fill or Down trend fill
******
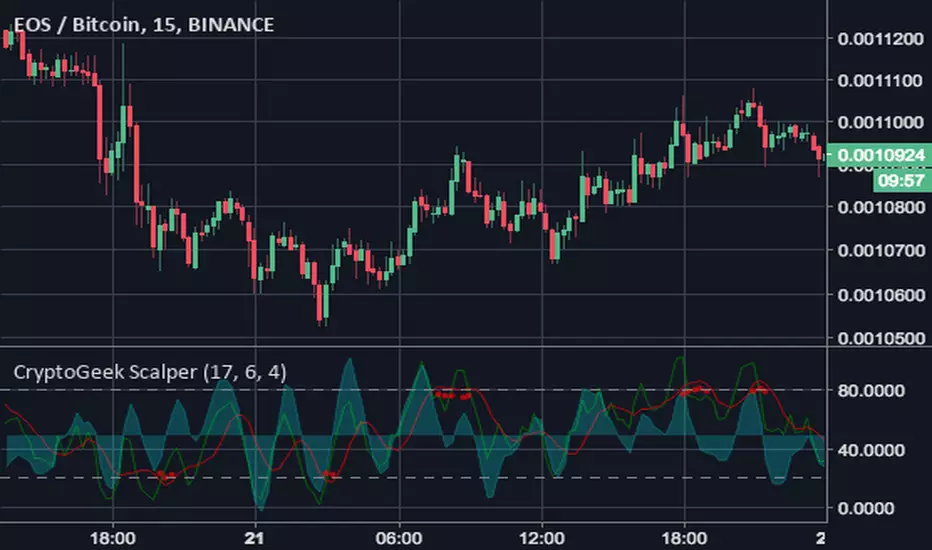
New features: this time we add two lines that can help traders trader safer. When the red line cross above the green line means we are in the downtrend and when the green line cross above the red line, which means we are in a uptrend. This new features will help traders do a safer trade at small time frame.
We have the Script free for the user pass, search keyword " Bitmex Scalping PlungerMen"
-->> 0.2 eth/1 month will be used 2 Script: Bitmex Scalping Pro and Bitmex Long Short Pro <--
Bitcoin Scalping PRO [PlungerMen] Hello!
Bitcoin Scalping PRO can use for every coin
Bitcoin Scalping PRO is available for all frames
Bitcoin Scalping PRO is a upgrade version of a Bitmex Scalping Pro
This Script is perfectly functional and works well by me and the best way to use this script is to use it with “Bitmex Long Short" script, both compliment for each other. the "Bitmex Long Short" script is Free, you can find it by searching “Bimex”
If you want to be more accurate and more efficient, more comfortable when you do not want to see too many other indicators, you can register for our Professional edition.
- The Professional Edition supports Level 1 and Level 2 commands ( display at chart : LONG+, long-, SHORT,+,short- ), which are very effective in allocating funds and optimizing your profits
Besides that,You will be supported by personal preferences, profit maximization
- Register for a Professional version will be used 2 Script, Bitcoin Scalping Pro and Bitmex Long Short Pro
- We will invite you to the signal channel Telgram with the announcement of the bottom and the peak of the BTC 0.60% -0.13% ,the big variable variable has exists
**We hope you enjoy this script. Your support will help us develop more good quality scripts in the future to serve the community **
**Remember, Like this script and posivite feedback if you are satisfied**
if you have any questions, post a comment ... below here
*********** Guide:
+ option for all frames : Click setting and input high and low for time inteval
+ hide wave trend : Click setting -> click Style --> Up trend Fill or Down trend fill
******
New features: this time we add two lines that can help traders trader safer. When the red line cross above the green line means we are in the downtrend and when the green line cross above the red line, which means we are in a uptrend. This new features will help traders do a safer trade at small time frame.
We have the Script free for the user pass, search keyword " Bitmex Scalping PlungerMen"
-->> 0.2 eth/1 month will be used 2 Script: Bitcoin Scalping Pro and Bitmex Long Short Pro <--

Crypto Scalper by CryptoTradeSignalsThe Crypto Scalper Signal makes day trading easier. This signal automatically identifies when to “buy” and “sell” your crypto, allowing you to advantage of the volatility in the market to make profits.

Crypto Scalper by CryptoTradingSignalsThe Crypto Scalper Signal makes day trading easier. This signal automatically identifies when to “buy” and “sell” your crypto, allowing you to advantage of the volatility in the market to make profits.

(Alerts+Strategy)Noro's Bands Scalper Strategy v1.6Alerts for @noro strategy
Using with autoview.with.pink

Bitra BB Squeeze ScalperMost traders take a decision to place the trade based on a combination of algorithms such as bollinger bands, keltner channels, and ichimoku cloud etc. Bitra BB Squeeze Scalper provides clear buy and sell signals with squeeze (purple color) in the chart of bollinger bands. The bands are color coded to show up and down trends.

yuthavithi BB Scalper 2 strategyIf you are searching a high win rate strategy with good profit factor ratio strategy. this one may be your choice.
Designed to be used with BTC or LTC. with 5 minute time frame or less. This BB strategy achieve win rate over 50% easily, with some tuning you can get even 60%+.

Gold M5 Scalping [Fixed Timezone]This is the M5 Scalping using Inside / Outside Bar
Only for Timezone +8 (8am - 12pm)
Scalping for king >o<

Gemini Scalping Strategy [Pro Dash]Description: Gemini Scalping Strategy is a comprehensive monitoring system designed for high-frequency trading and scalping on lower timeframes (1m to 15m). This tool combines a fast-response Trailing Stop based on Average True Range (ATR) with a professional, real-time multi-factor Dashboard to provide a complete view of market structure and momentum.
Key Features:
Reactive ATR Trailing Stop: Provides immediate Buy/Sell signals based on volatility expansion and price breakouts. The trail line dynamically changes color to reflect volatility health.
Contextual Dashboard:
Choppiness Index (Corrected): Identifies whether the market is in a Trending phase (below 38.2) or a Sideways phase (above 61.8), helping to avoid "noise" in flat markets.
RSI Control Logic: Uses the 50-level pivot to define market control (Bull Control vs. Bear Control) instead of simple overbought/oversold levels.
ADX Strength: Measures trend intensity to filter out weak breakouts.
ATR Expansion: Monitors whether current volatility is above its average to confirm entry momentum.
How to use:
Entry: Primary signals are generated by the ATR triangles.
Confirmation: Use the Dashboard to verify market quality. High-probability trades occur when ATR signals align with "TREND" status on the CHOP and "BULL/BEAR CONTROL" on the RSI.
Customization: All dashboard elements (position, size, transparency, and theme) are fully customizable via the settings menu.
Disclaimer: This indicator is for educational and analytical purposes only. Trading involves significant risk, and past performance is not indicative of future results.

UMA Scalping Level 2025UMA Scalping Level 2025は、「直近で市場が意識している高値・安値ライン」と
「短期トレンドの勢い(EMAクロス)」を同時に捉えるスキャルピング特化型インジケーターです。
"UMA Scalping Level 2025" is a scalping-focused indicator that simultaneously captures the recent key swing highs and lows that the market is reacting to, and the short-term momentum identified by EMA crossovers.

BEM Scalping & Trend Continuation ToolThe BEM Scalping & Trend Continuation Tool highlights 3-candle pullback structures into moving averages and visualizes potential continuation areas within ongoing trends. The script includes two pullback detectors using configurable moving averages, a trend-direction average, VWAP, signal markers, and dynamic swing-level tracking. These elements are designed to support visual analysis of short-term momentum, pullbacks, and structural behavior across different markets and timeframes.
How It Works:
The script identifies descending 3-bar patterns (for bullish pullbacks) and ascending 3-bar patterns (for bearish pullbacks). Pullbacks are highlighted when they interact with a selected moving average and meet additional structural criteria. Optional markers plot when such patterns occur.
Swing levels are detected using pivots, extended forward, and removed when invalidated.
Intended Use:
This tool supports discretionary and rule-assisted chart analysis by highlighting pullbacks, trend context, and market structure. It does not generate predictions or financial advice, and its signals do not imply performance or outcomes.
⭐ Core Features
1️⃣ Highlighted Pullback Bars (Fast + Deep Retracements)
The tool uses two customizable moving averages:
MA1 (default 9) → Fast trend pullback
MA2 (default 45) → Deeper retracement pullback
The script highlights candles when the price creates a structured 3-bar pullback into either moving average. Colors automatically reflect bullish or bearish continuation conditions.
2️⃣ Trend Direction Filter
A longer moving average (default 102) provides directional bias.
This helps traders visually stay aligned with the dominant trend.
3️⃣ VWAP Integration
VWAP is included as a dynamic institutional support/resistance level.
Useful for intraday bias, mean reversion, and trend continuation confluence.
4️⃣ Automated Pullback Signals
Triangle signals appear when a pullback meets all conditions:
Bullish/Short-term long
Bearish/Short-term short
Deep Bullish pullback (MA45)
Deep Bearish pullback (MA45)
These optional markers provide clear visual confirmation.
5️⃣ Smart Swing Lines (Auto-Structure Tracking)
Swing highs and lows are automatically detected and projected forward.
Broken levels self-remove to keep the chart clean.
Great for structure trading, liquidity analysis, and break-of-structure confirmation. To help identify the best possible scenario for the trend continuation pullback work A+.
🔍 How the Pullback Logic Works
The BEM Scalping & Trend Continuation Tool uses a 3-bar structural pattern:
Bullish Pullback Pattern
The High of the first candle needs to be higher than the second one, and the high of the second needs to be higher than the third, moving down in a pullback to the moving average.
Price wicks into MA
Open above MA (rejection)
Continuation expected upward
Bearish Pullback Pattern
The Low of the first candle needs to be lower than the second one, and the low of the second one needs to be lower than the third one, moving upward to the moving average.
Price wicks into MA
Open below MA (rejection)
Continuation expected downward
Bars are highlighted in different colors based on MA1(fast) or MA2(slow and deeper) pullback.
📘 How to Trade the System (Optional Use Case)
(Not predictive; for discretionary workflow support.)
LONG Scenario
Price above Trend MA
Price above VWAP (optional confluence)
Gold (MA9) or Blue (MA45) bullish pullback highlight
Bullish triangle plotted
Entry: candle close or break of signal candle high
Stop: below MA or swing low
Target: next liquidity level, swing high, or trail with MA9
SHORT Scenario
Price below Trend MA
Price below VWAP
Purple (MA9) or Deep Violet (MA45) bearish pullback highlight
Bearish triangle plotted
Entry: candle close or break of signal candle low
Stop: above MA or swing high
Target: next swing low or break structure
*
This tool is for charting and better visualization of pullback and trend continuation only.
It does not guarantee profits.
Always combine with proper risk management.

VWAP + EMA9 + RSI Scalping (Edu)VWAP + EMA9 + RSI Scalping (Edu) is an intraday scalping indicator combining VWAP, EMA9 and RSI to identify high-probability long and short entries. Designed for low timeframes (1m–5m), it aligns micro-trend and momentum to generate clean and fast setups. Works on stocks, indices, forex and crypto.

1MN Profitcosmos Gold Scalping📈 Profitcosmos Gold Scalping Indicator (1MN)
The Profitcosmos Gold Scalping Indicator is a high-precision scalping system designed specifically for XAUUSD (Gold) on the 1-minute timeframe. It blends ATR-based trend logic with smart session filtering to detect only the most actionable trading opportunities during high-liquidity market hours.
This indicator is built for traders who demand clean entries, structured risk management, and disciplined execution.
✅ Core Features
🔹 ATR Dynamic Stop System
Uses adaptive volatility-based trailing logic to detect strong directional moves.
🔹 Session-Based Trading Only
Trades are filtered to execute exclusively during high-probability sessions:
London Session
New York Session
Asian Session
🔹 Visual Trade Guidance
Every signal automatically draws:
✅ Entry level
🔴 Stop Loss (Swing-based)
🟢 Take Profit (3R risk-reward)
🔹 Clear BUY / SELL Markers
BUY below candle (arrow pointing up)
SELL above candle (arrow pointing down)
No confusion. No overtrading. Only precision.
🔹 Optional Heikin Ashi Mode
Smooth price data for cleaner trend detection.
🎯 How To Trade (Rules)
✅ Trade BUY signals only when price is trending up
✅ Trade SELL signals only when price is trending down
✅ Respect the Stop Loss and Take Profit levels
✅ Never revenge trade
✅ Focus on quality over quantity
🛡 Risk Management
Each signal follows a 3:1 reward-to-risk ratio, ensuring long-term profitability when combined with discipline and consistency.
⚠️ Disclaimer
This indicator is not financial advice. Trading involves risk. Use proper money management and test strategies on demo accounts before trading live capital.

Alzeerr Scalping StrategyAlzeerr Scalping Strategy
A high-precision intraday scalping strategy that combines VWAP, support/resistance levels, volume confirmation, RSI momentum shifts, and reversal candlestick patterns to identify low-risk, high-accuracy trade entries. The strategy only trades in the direction of the trend relative to VWAP, focuses on high-probability pullback entries, and uses tight stop-losses with small, consistent profit targets. Designed to maximize accuracy and minimize drawdown during high-liquidity market sessions.
Trend Pulse Algo (LTM)Trend Pulse Algo LTM Indicator Description
Overview
Trend Pulse Algo LTM is an advanced multi layer technical indicator designed for TradingView that combines moving average MA crossovers confirmation signals pivot based structure analysis imbalance zone detection and overextension warnings to identify potential trend shifts continuations and reversal points. It aims to provide traders with reliable entry and exit signals in trending markets while highlighting areas of market inefficiency imbalances and overextended price moves that could signal exhaustion.
This indicator operates on a pulse concept where it detects rhythmic shifts in market momentum through layered MAs a quick MA for short term sensitivity a mid MA for intermediate confirmation and a long MA as a baseline trend filter. Signals are generated based on alignments and crosses between these MAs but with added layers of confirmation to reduce false positives such as requiring consecutive bars above below the long MA and breaks of prior pivot highs lows. It incorporates higher timeframe HTF analysis for imbalance zones to capture broader market context making it suitable for swing trading trend following or scalping on lower timeframes when combined with the overextension detector.
Unlike simple MA crossover systems for example standard dual EMA strategies this algo uses adaptive MA types based on timeframe pivot deviation for structural breaks and a tally based confirmation to filter noise. Imbalance zones identify fair value gaps or inefficiencies between candle bodies and wicks where price may retrace to fill. Overextension is calculated relative to the mid MA using a rolling mean absolute deviation MAD ratio highlighting potential tops bottoms in strong trends. The result is a visually clean or detailed based on mode overlay that colors bars backgrounds plots labels for signals and pivots and draws zones to guide decision making.
How It Works
MA Layers and Signal Generation
Three MAs quick mid long are computed using either SMA or EMA selected dynamically based on the charts timeframe for optimal responsiveness for example EMA on lower TFs for faster signals.
Early Signals A crossover of the quick MA above the mid MA while above the long MA triggers a Possible Bull label indicating early momentum shifts. A crossunder below triggers Possible Bear.
Confirmed Signals Bullish confirmation requires a set number of bars closing above the long MA plus alignment quick greater than mid and a break above the prior pivot high. Bearish requires bars below the long MA and a break below the prior pivot low. This uses a counter mechanism to ensure persistence reducing whipsaws. Breaks are detected via crossovers under of close versus prior highs lows.
State persistence tracks the current regime bull bear warn early coloring the chart accordingly until a new signal overrides it.
Pivot Detection and Structure
Pivots are identified by scanning for highs lows separated by a minimum bar depth with a percentage deviation threshold to confirm validity. This follows a zigzag like approach but with deviation filtering for robustness.
Labels like HH Higher High HL Higher Low LH Lower High LL Lower Low highlight market structure helping identify trends for example HH HL for uptrends or breakdowns. These are used internally to validate signal breaks.
Imbalance Zones
Zones detect imbalances or gaps between candle bodies and prior highs lows where unfilled inefficiencies attract price.
For bullish zones If open greater than close and high minus low two less than zero a zone is drawn from calculated top bottom limits. Bearish similarly for close greater than open.
Supports current TF HTF or both. Zones extend rightward until filled price touches the opposite side or mid line if enabled then either delete or shorten based on settings. Mid lines can act as fill triggers for partial closures.
HTF data is fetched via security for broader context resetting on new HTF bars.
Overextension Indicator
Measures price deviation from the mid MA relative to a rolling average RMA of relative deviations over a length.
Multipliers define tiers mild for example two times avg deviation moderate three times extreme four times. Circles plot above below bars in bull bear states when thresholds are exceeded signaling potential reversals for example red for extreme tops in uptrends. This is akin to a Bollinger Band squeeze expansion but normalized to MA distance for trend specific warnings.
Chart Coloring and Visuals
Background or candle coloring reflects the state green for bull red for bear orange for warn blue for early.
Modes control clutter Clean hides MAs zones pivots Balanced shows essentials Detailed includes all.
How to Use It
Setup Add to your chart via TradingViews indicator search. Adjust inputs based on asset timeframe for example shorter MA periods for volatile cryptos longer for stocks.
Trading Strategy Ideas
Trend Following Enter long on Confirmed Bull labels exit on Confirmed Bear or extreme overextension circles. Use imbalance zones as support resistance for stops targets for example buy dips to unfilled bullish zones.
Reversal Scalping Watch for Possible Bull Bear near pivot labels for example HL LL and overextension in the opposite direction. Confirm with zone fills.
Multi TF Analysis Set HTF to D for daily context on hourly charts zones from HTF often act as magnets.
Risk Management Place stops below prior lows in bulls or above highs in bears. Target zone edges or MA crosses. Avoid trading against strong states without confirmation.
Alerts Set up via TradingView for Early Up Down or Up Down Confirm to notify on signal edges.
Limitations Best in trending markets may lag in ranges. Test on historical data no indicator is foolproof combine with volume price action.
Detailed Input Settings
Below is a comprehensive breakdown of all user adjustable inputs from the settings panel grouped as in the script. Each explains what it controls its effect on the indicators logic and usage tips. Defaults are provided for reference.
Chart Mode
Chart Mode default Detailed Mode options Clean Mode Balanced Mode Detailed Mode
Controls visual detail level. Clean Mode hides MAs imbalance zones and pivots for a minimal overlay focused on signals and coloring. Balanced Mode shows MAs and signals but omits zones pivots. Detailed Mode displays everything for in depth analysis. Use Clean for live trading to reduce clutter Detailed for backtesting structure review.
Display Settings
Color Style default Candles options Background Candles
Determines how states bull bear warn early are visualized. Background colors the chart area for example green shading for bull. Candles colors bar bodies wicks directly. Background is subtler for multi indicator setups Candles emphasizes signals on naked charts.
Imbalance Zone HTF Config
Higher TF Period default D
Sets the higher timeframe for imbalance detection for example D for daily four H for four hour. This fetches broader data to identify significant zones. Use a TF four to five times your current for context for example daily on one H charts avoid very high TFs like W on intraday for relevance.
TF Mode default Current TF options Current TF Current plus HTF HTF Only
Defines timeframe handling for zones. Current TF uses only your charts TF. Current plus HTF combines both for layered zones. HTF Only ignores current TF. Current plus HTF is ideal for multi TF confluence HTF Only simplifies for swing traders.
Shift default ten min zero max five hundred
Horizontal offset in bars for current TF zone labels. Higher values shift labels rightward to avoid overlap. Adjust if labels crowd the chart.
HTF Shift default twenty min zero max five hundred
Similar to Shift but for HTF zone labels. Use larger offsets for HTF to distinguish them visually.
Imbalance Zone Core Options
Mid Line Fill default false
Enables a midpoint line in each zone zones fill close short when price touches this mid line instead of the far edge. Activates partial fill logic for more conservative zone closure. Enable for tighter risk in volatile markets.
Remove Filled Zones default true
If true completely deletes filled zones if false shortens them to the fill point keeping history. True clears clutter false retains context for review.
Display TF on Zone default false
Shows the timeframe for example D IZ on zone labels. Useful for distinguishing current versus HTF zones in combined mode.
Max Upward Zones default twenty min one max fifty
Limits displayed bullish upward zones removes oldest when exceeded. Lower for cleaner charts higher for historical depth.
Max Downward Zones default twenty min one max fifty
Same as above but for bearish downward zones.
Imbalance Zone Visuals
Upward Zone color green at ninety percent transparency
Color for current TF upward imbalance zones. Adjust opacity for visibility.
HTF Upward Zone color lime at eighty percent transparency
Color for higher timeframe upward imbalance zones. Differentiate from current for example lighter shade.
Downward Zone color red at ninety percent transparency
Color for current TF downward imbalance zones.
HTF Downward Zone color maroon at eighty percent transparency
Color for higher timeframe downward imbalance zones.
Mid Line Color color white at eighty five percent transparency
Color for the optional midpoint line in zones.
Text Color color white
Color for text labels on zones.
MA Layers
Quick MA Period default ten min one
Length for the fastest moving average sensitive to short term price. Shorter for example five for scalping longer for example fifteen for less noise.
Mid MA Period default twenty min one
Intermediate MA length used for crossovers and overextension base. Typically two times quick for balance.
Long MA Period default fifty min one
Baseline trend filter length. Longer for example one hundred for major trends shorter for active trading.
MA Variants by Period
Under one H default EMA options SMA EMA
MA type for timeframes under one hour for example EMA for faster response.
One H to less than five H default EMA options SMA EMA
MA type for one to five hour timeframes.
Five H to less than one D default EMA options SMA EMA
MA type for five hour to one day timeframes.
One D plus default EMA options SMA EMA
MA type for daily and higher timeframes. Adapt to market EMA for trends SMA for mean reversion.
Signal Confirmation
Bull Confirm Bars default one min zero
Consecutive bars needed above long MA for bull confirmation. Zero for instant higher for example three filters noise but delays entries.
Bear Confirm Bars default two min zero
Same for bear below long MA. Asymmetrical default higher for bears assumes uptrend bias.
Pivot Detection
Pivot Depth default six min one
Min bars between pivots. Higher reduces minor swings lower captures more structure.
Pivot Deviation percent default one point zero min zero point one
Percent change required for new pivot. Higher ignores small moves for example two percent for stocks zero point five percent for forex.
Display HH and HL default true
Shows labels for Higher Highs Lows bullish structure.
Display LH and LL default true
Shows labels for Lower Highs Lows bearish structure.
Overextension Indicator
Show Overextension Circles Potential Tops default true
Enables circles above bars in bull states for potential tops.
Show Overextension Circles Potential Bottoms default true
Enables below bars in bear states for bottoms.
Overextension Length default fourteen min one
Period for rolling relative deviation average. Matches RSI STOCH defaults for alignment.
Mild Multiplier default two point zero min zero point zero
Threshold for mild overextension yellow circle. Zero disables tier.
Moderate Multiplier default three point zero min zero point zero
For moderate orange.
Extreme Multiplier default four point zero min zero point zero
For extreme red. Tune lower for sensitive warnings in ranging markets.

UMA Scalping Level 2025UMA Scalping Level 2025は、「直近で市場が意識している高値・安値ライン」と
「短期トレンドの勢い(EMAクロス)」を同時に捉えるスキャルピング特化型インジケーターです。
"UMA Scalping Level 2025" is a scalping-focused indicator that simultaneously captures the recent key swing highs and lows that the market is reacting to, and the short-term momentum identified by EMA crossovers.

4-Hour Range Scalping [v6.3]User Guide: 4-Hour Range Scalping Strategy
Hello! Here is the guide for the Pine Script strategy. Please read it carefully to get the best results.
📈 This script automates the "4-Hour Range Scalping Strategy" from the video.
The main idea is that the first four hours of a major trading day (like New York) set up a "trap zone." The strategy waits for the price to break out of this zone and then fail, giving us a signal that the breakout was false and the price is likely to reverse.
Here’s the simple logic:
Define the Range: It precisely calculates the highest high and lowest low during the first four hours of the selected trading session (e.g., 00:00 to 04:00 New York Time).
Wait for a Breakout: It then monitors the 5-minute chart for a price breakout where a candle fully closes outside of this established range.
Identify the Reversal: The trade trigger occurs when the price fails to continue its breakout and a subsequent 5-minute candle closes back inside the range. This signals a potential reversal or "failed breakout."
Execute the Trade:
]A Short (Sell) trade is triggered after a failed breakout above the range high.
A Long (Buy) trade is triggered after a failed breakout below the range low.
Manage the Risk: The Stop Loss is automatically placed at the peak (for shorts) or trough (for longs) of the breakout move, and the Take Profit is set to a default 2:1 Risk/Reward Ratio.
How to Use the Script (Step-by-Step) ⚙️
Follow these instructions to get it running perfectly.
1. Set Your Chart Timeframe This is the most important step. The strategy is designed to run on a 5-minute (5m) chart. Open your TradingView chart and make sure the timeframe is set to "5m".
2. Add the Script to Your Chart Open the Pine Editor tab at the bottom of TradingView, paste the entire script, and click the "Add to chart" button.
3. Configure the Settings On your chart, find the strategy's name (e.g., "4-Hour Range Scalping ") and click the gear icon ⚙️ to open its settings.
Trading Session: Choose the session for the range. New York is the default and the one from the video.
Risk/Reward Ratio: The default is 2.0, meaning your potential profit is twice your potential loss. You can adjust this to test other targets.
Backtesting Period: To see how the strategy performed on all historical data, go to the "Strategy Tester" panel, click its own gear icon ⚙️, and uncheck the boxes for "Start Date" and "End Date."
4. Understand the Visuals on Your Chart
Blue Background Area: This is the 4-hour calculation window. The script is identifying the day's high and low during this time. No trades will ever happen here.
Red Line (Range High): The highest price of the 4-hour window. This is the upper boundary of the "trap zone."
Green Line (Range Low): The lowest price of the 4-hour window. This is the lower boundary.
Green Triangle (▲): Shows where a Long (Buy) trade was entered.
Red Triangle (▼): Shows where a Short (Sell) trade was entered.
A Very Important Note on Timezones 🕒
This is critical for you in the Philippines (PHT).
The script is based on the New York session, which is 12 hours behind you. Your TradingView chart will still show your local time, but the script works on NY time in the background.
The New York "day" begins at 12:00 PM (Noon) your time.
The script's blue calculation window will be from 12:00 PM to 4:00 PM your local time.
The red and green range lines will appear on your chart only after 4:00 PM your time.
So, if you look at your chart in the morning or early afternoon, you will not see today's range yet. This is normal! The script is just waiting for the New York session to start.
How to Set Up Trade Alerts 🔔
You can have TradingView send you a notification whenever the script enters a trade.
Click the "Alert" button (looks like a clock) in the right-hand toolbar of TradingView.
In the "Condition" dropdown, select the name of the script (e.g., "4-Hour Range Scalping...").
You will then see two options: "Long Signal" and "Short Signal".
Select one (e.g., "Long Signal") and configure how you want to be notified (e.g., "Notify on app").
Click "Create". Repeat the process to create an alert for the other signal.
⚠️ Important Disclosure
For Educational and Research Purposes Only.
This script and all accompanying information are provided for educational and research purposes only. The strategy demonstrated is a technical concept and should not be misconstrued as financial, investment, legal, or tax advice.
Trading financial markets involves substantial risk and is not suitable for every investor. There is a possibility that you could sustain a loss of some or all of your initial investment. Therefore, you should not invest money that you cannot afford to lose.
Past performance is not indicative of future results. The backtesting results shown by this script are historical and do not guarantee future performance. Market conditions are constantly changing.
By using this script, you acknowledge that you are solely responsible for any and all trading decisions you make. You should conduct your own thorough research and, if necessary, seek advice from an independent financial advisor before making any investment decisions. The creators of this script assume no liability for any of your trading results.

Bollinger Adaptive Trend Navigator [QuantAlgo]🟢 Overview
The Bollinger Adaptive Trend Navigator synthesizes volatility channel analysis with variable smoothing mechanics to generate trend identification signals. It uses price positioning within Bollinger Band structures to modify moving average responsiveness, while incorporating ATR calculations to establish trend line boundaries that constrain movement during volatile periods. The adaptive nature makes this indicator particularly valuable for traders and investors working across various asset classes including stocks, forex, commodities, and cryptocurrencies, with effectiveness spanning multiple timeframes from intraday scalping to longer-term position analysis.
🟢 How It Works
The core mechanism calculates price position within Bollinger Bands and uses this positioning to create an adaptive smoothing factor:
bbPosition = bbUpper != bbLower ? (source - bbLower) / (bbUpper - bbLower) : 0.5
adaptiveFactor = (bbPosition - 0.5) * 2 * adaptiveMultiplier * bandWidthRatio
alpha = math.max(0.01, math.min(0.5, 2.0 / (bbPeriod + 1) * (1 + math.abs(adaptiveFactor))))
This adaptive coefficient drives an exponential moving average that responds more aggressively when price approaches Bollinger Band extremes:
var float adaptiveTrend = source
adaptiveTrend := alpha * source + (1 - alpha) * nz(adaptiveTrend , source)
finalTrend = 0.7 * adaptiveTrend + 0.3 * smoothedCenter
ATR-based volatility boundaries constrain the final trend line to prevent excessive movement during volatile periods:
volatility = ta.atr(volatilityPeriod)
upperBound = bollingerTrendValue + (volatility * volatilityMultiplier)
lowerBound = bollingerTrendValue - (volatility * volatilityMultiplier)
The trend line direction determines bullish or bearish states through simple slope comparison, with the final output displaying color-coded signals based on the synthesis of Bollinger positioning, adaptive smoothing, and volatility constraints (green = long/buy, red = short/sell).
🟢 Signal Interpretation
Rising Trend Line (Green): Indicates upward direction based on Bollinger positioning and adaptive smoothing = Potential long/buy opportunity
Falling Trend Line (Red): Indicates downward direction based on Bollinger positioning and adaptive smoothing = Potential short/sell opportunity
Built-in Alert System: Automated notifications trigger when bullish or bearish states change, allowing you to act on significant development without constantly monitoring the charts
Candle Coloring: Optional feature applies trend colors to price bars for visual consistency
Configuration Presets: Three parameter sets available - Default (standard settings), Scalping (faster response), and Swing Trading (slower response)

ZigZag+4 EMA89 Trend Candles + BUY/SELL SCALPThis script combines ZigZag patterns, EMA89 trend detection, and custom buy/sell scalp signals. It helps identify trend direction and potential entry points in trending markets.
Features:
- ZigZag structure points
- EMA89 as dynamic trend filter
- Buy/Sell scalp markers
- HL/HH swing labels
- Works best on 15m–4h timeframes

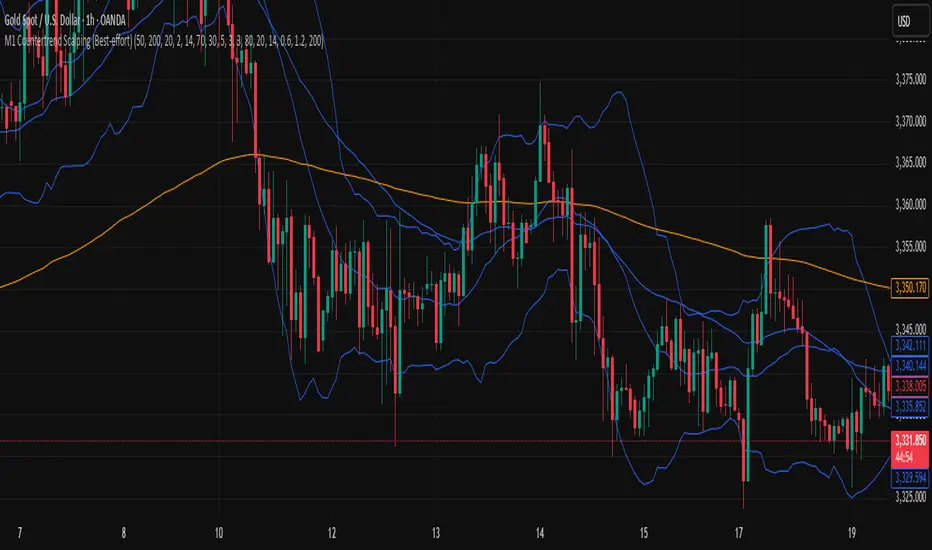
M1 Countertrend Scalping (Best-effort)M1 Countertrend Scalping (Best-effort)
M1 Countertrend Scalping (Best-effort)
Supercharged Scalping Indicator v1 No repaintSupercharged Scalping Indicator with:
✅ Buy/Sell arrows (no repaint).
✅ EMA50, EMA200, VWAP, ATR bands plotted for context.
✅ Momentum + volume confirmation.
✅ Color-coded background when confluence is strong.
⚡ How It Works
Trend filter: EMA50 vs EMA200 decides bullish/bearish bias.
VWAP + ATR bands: Confirms pullback zones for scalping entries.
Momentum: RSI > 50 & MACD > 0 for longs, RSI < 50 & MACD < 0 for shorts.
Volume: Only fire signals when above average volume → avoids dead zones.
Candle confirmation: Requires strong-bodied candle (no tiny indecision bars).
Non-repaint: All signals confirmed on bar close.

HF Crypto Scalping BotHigh-Frequency Crypto Scalping Bot for ETHUSDT
This bot is designed for scalping ETHUSDT on a 1-minute chart using a blend of technical indicators and market structure logic.
🔍 Strategy Highlights:
Range Mode: Uses RSI and MFI to identify overbought/oversold zones near support/resistance.
Trend Mode: Detects MACD momentum combined with confirmed S/R breakouts.
Smart Risk Management: Dynamic stop loss and take profit based on risk:reward ratio.
Adaptive Market Logic: Automatically switches between trend and range conditions.
Real-Time Table: Displays RSI, MFI, MACD trend, market mode, entry/exit prices, and stop/target levels.
Visual Cues: Buy/Sell/Exit signals plotted directly on the chart with color-coded levels.
Alerts: Integrated long/short entry and exit alerts with live price and indicator values.
Customize the input parameters to fit your risk profile and asset volatility. Ideal for fast-paced scalping with dynamic conditions.
