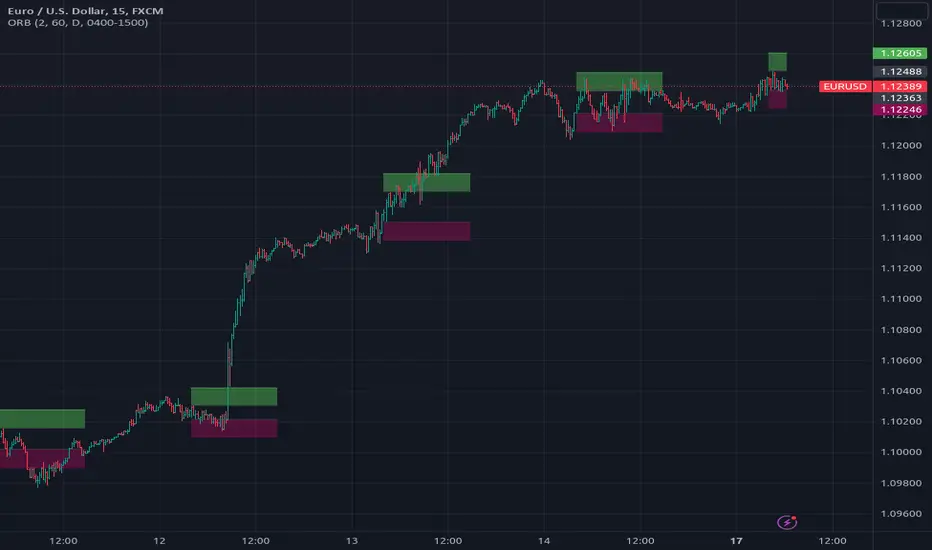
15 Zaman Kutusu ve 10 Zaman Acilisi15 Range Boxes & 10 Open Lines
This indicator is a comprehensive technical analysis tool designed to track specific time intervals (Sessions, Killzones) and critical opening prices on your chart.
Key Features:
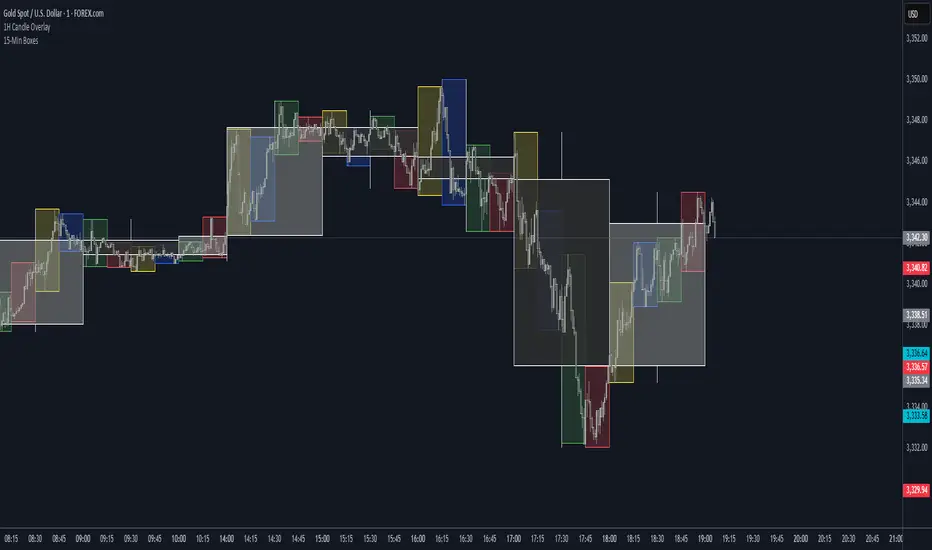
15 Custom Range Boxes: Individual settings for color, time, and labels.
10 Open Price Lines: Track daily, weekly, or session opens.
Smart History Limit: "Son X Kutuyu Goster" feature preventing lag and flickering.
Pips Display: Automatically calculates and displays the range width in pips.
Minimalist Mode: Hides details when "Cok Kucuk" label size is selected.
Language: Fully Turkish menu settings.
Note: Inspired by Nephew Sam's concept, coded from scratch with performance optimizations and additional features.
DISCLAIMER This indicator is for educational purposes only. It does not constitute financial advice or trading signals. Use at your own risk.
Tìm kiếm tập lệnh với "session"

Night Session Background V1.0This script can achieve the following functions:
Select a specified time period, such as the U.S. trading session, and mark this period on the background of the candlestick chart.
The purpose of doing this:
It allows you to more intuitively observe the candlestick patterns during specific time periods, such as the U.S. trading session.
OTT Volatility [RunRox]📊 OTT Volatility is an indicator developed by the RunRox team to pinpoint the most optimal time to trade across different markets.
OTT stands for Optimal Trade Time Volatility and is designed primarily for markets without a fixed trading session, such as cryptocurrencies that trade 24/7. At the same time, it works equally well on any other market.
🔶 The concept is straightforward. The indicator takes a specified number of historical periods (Samples) and statistically evaluates which hours of the day or which days show the highest volatility for the selected asset.
As a result, it highlights time windows with elevated volatility where traders can focus on searching for trade setups and building positions.
🔶 As the core volatility metric, the indicator uses ATR (Average True Range) to measure intraday volatility. Then it calculates the average ATR value over the last N Samples, creating a statistically stable estimate of typical volatility for the selected asset.
🔶 Statistically, during these highlighted periods the market shows higher-than-average volatility.
This means that in these time windows price is more likely to be subject to stronger moves and potential manipulation, making them attractive for active trade execution and position management.
⚠️ However, historical behavior does not guarantee future results.
These periods should be treated only as zones where volatility has a higher probability of being above normal, not as a promise of movement.
As shown in the screenshot above, the indicator also projects potential future volatility based on historical data. This helps you better plan your trading hours and align your activity with periods where volatility is statistically expected to be higher or lower.
🔶 Current Volatility – as shown in the screenshot above, you can also monitor the real-time volatility of the market without any statistical averaging.
On top of that, you can overlay the current volatility on top of the statistical volatility levels, which makes it easy to see whether the market is now trading in a high- or low-volatility regime relative to its usual behavior.
4 display modes – you can choose any visualization style that fits your trading workflow:
Absolute – displays the raw volatility values.
Relative – shows volatility relative to its typical levels.
Average Centered – centers volatility around its average value.
Trim Low Value – filters out low-volatility noise and highlights only more significant moves.
This indicator helps you define the most effective trading hours on any market by relying on historical volatility statistics.
Use it to quickly see when your market tends to be more active and to structure your trading sessions around those periods.
✅ We hope this tool becomes a useful part of your trading toolkit and helps you improve the quality of your decisions and timing.

Heiken Ashi Buy/Sell Signals for EUR/USD European SessionUSING Heiken Ashi DURING SESSIONS EUR & USD Buy/Sell Signals for EUR/USD DURING European Session

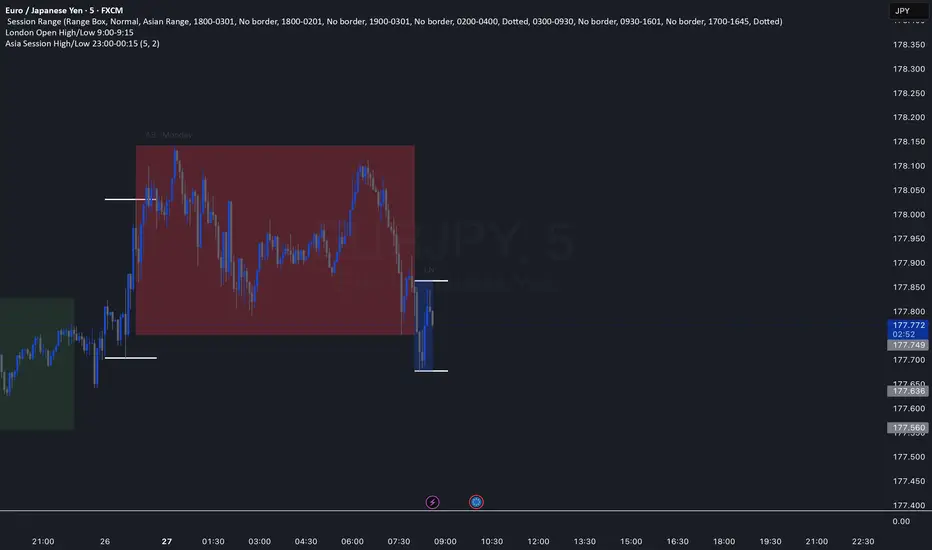
Asia Session High/Low 23:00-00:15This indicator shows highs and lows 1 hour before Asia session and the first 15min of Asia session.
NY Session Range Box with Labeled Time MarkersShows opening time ny session by timing with lines to inform traders to avoid 11:30am to 1:30pm for choppy sessions and mark early and power hour .

Forex Session HighlighterSet the session start and stop time for one single session. Allows a trader to easily see their preferred trading times at a glance. Especially helpful during bar replay.

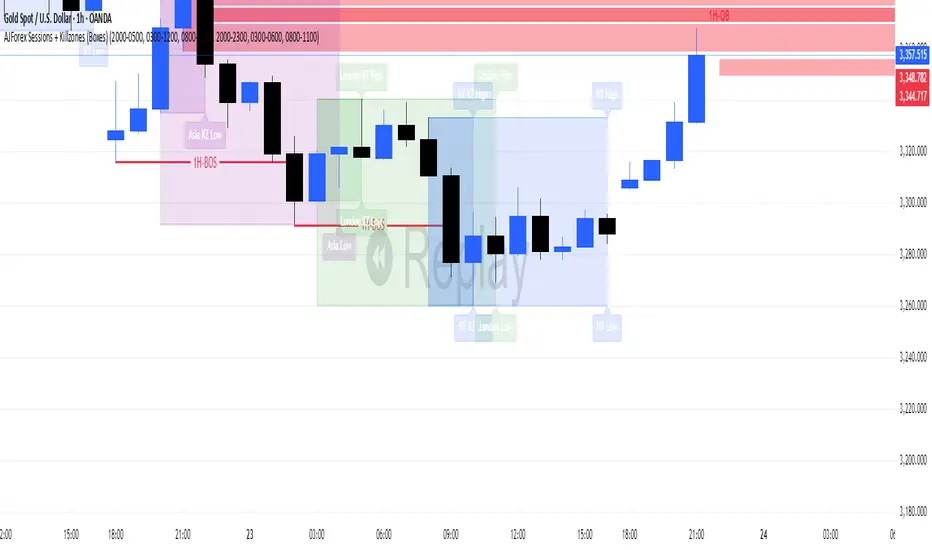
AJForex Sessions + Killzones (Boxes)use timeline UTC -4 AJForex Sessions + Killzones (Boxes)AJForex Sessions + Killzones (Boxes)AJForex Sessions + Killzones (Boxes)AJForex Sessions + Killzones (Boxes)AJForex Sessions + Killzones (Boxes)AJForex Sessions + Killzones (Boxes)AJForex Sessions + Killzones (Boxes)AJForex Sessions + Killzones (Boxes)AJForex Sessions + Killzones (Boxes)
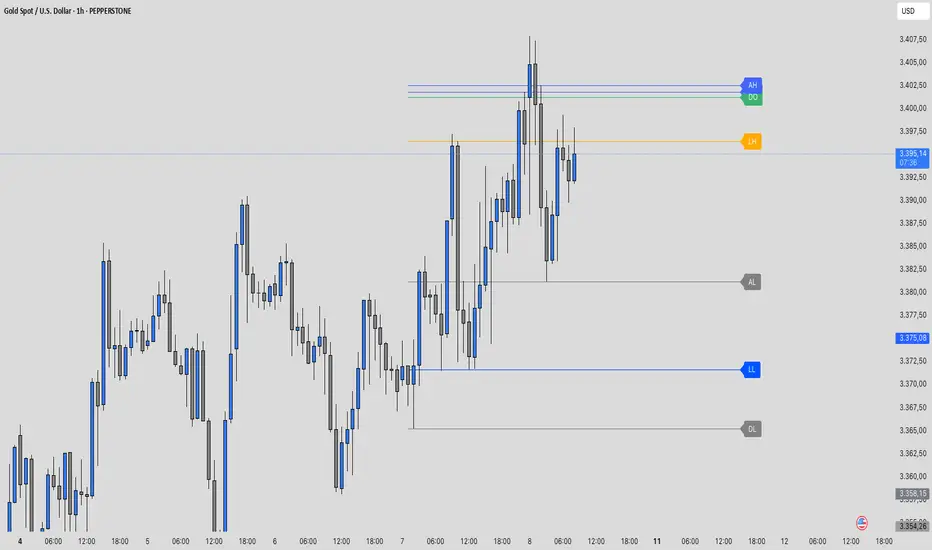
Traderei Sessions v.1This Indicator shows the daily open, the last 24h daily highs & lows and the last highs & lows of the asia session.
you can increase the lenght of the line manually !
[COG] Advanced School Run StrategyAdvanced School Run Strategy (ASRS) – Explanation
Overview: The Advanced School Run Strategy (ASRS) is an intraday trading approach designed to identify breakout opportunities based on specific time and price patterns. This script applies the concepts of the Advanced School Run Strategy as outlined in Tom Hougaard's research, adapted to work seamlessly on TradingView charts. It leverages 5-minute candlestick data to set actionable breakout levels and provides traders with visual cues and alerts to make informed decisions.
Features:
Dynamic Breakout Levels: Automatically calculates high and low levels based on the market's behavior during the initial trading minutes.
Custom Visualization: Highlights breakout zones with customizable colors and transparency, providing clear visual feedback for bullish and bearish breakouts.
Configurable Alerts: Includes alert conditions for both bullish and bearish breakouts, ensuring traders never miss a trading opportunity.
Reset Logic: Resets breakout levels daily at the market open to ensure accurate signal generation for each session.
How It Works:
The script identifies key levels (high and low) after a configurable number of minutes from the market open (default: 25 minutes).
If the price breaks above the high level or below the low level, a corresponding breakout is detected.
The script draws breakout zones on the chart and triggers alerts based on the breakout direction.
All levels and signals reset at the start of each new trading session, maintaining relevance to current market conditions.
Customization Options:
Line and box colors for bullish and bearish breakouts.
Transparency levels for breakout visualizations.
Alert settings to receive notifications for detected breakouts.
Acknowledgment: This script is inspired by Tom Hougaard's Advanced School Run Strategy. The methodology has been translated into Pine Script for TradingView users, adhering to TradingView’s policies and community guidelines. This script does not redistribute proprietary content from the original research but implements the principles for educational and analytical purposes.

ICT Times [joshu]This TradingView indicator provides a comprehensive view of ICT killzones, Silver Bullet times, and ICT Macros, enhancing your trading experience.
In those time windows price either seeks liquidity or imbalances and you often find the most energetic price moves and turning points.
Features:
Automatic Adaptation: The ICT killzones intelligently adapt to the specific chart you are using. For Forex charts, it follows the ICT Forex times:
Asia: 2000-0000
London: 0200-0500
New York: 0700-1000
London Close: 1000-1200
For other charts, it uses the following session times:
Asia: 2000-0000
London: 0200-0500
New York AM: 0830-1100
New York PM: 1330-1600
Silver Bullet Times:
0300-0400
1000-1100
1400-1500
How to Use:
Simply apply the indicator to your chart, and the session boxes and Silver Bullet times will be plotted automatically.

3GBH - ICT NY SessionThis indicator is meant to help those using ICT's methodology.
This script simply highlights the NY session with green and red zones.
The red zone can help to indicate periods you do not want to trade, for example, NY lunch session.
Timings and colors and customizable with an easy user interface.

Daily Profile (Nephew_Sam_)From getting several requests to combine many of my indicators into one, this indicator plots everything you need for a Daily Profile.
1. Session = Current session + Daily dividers + day of the week
2. Open Lines = Plot the open of the day, midnight, week and month
3. Asian Range = Plots the asian range with an option for midpoint and extending lines
4. Previous OHLC = Plot the previous day/week/month OHLC
EVERY line/label/color/size/style is fully customizable in this indicator.
Important to adjust your timezone to get the correct data


Intraday MAs for Regular/Extended SessionThis indicator will allow you to show multiple EMA/SMAs for different timeframes on your chart. In addition, it can show you indicators calculated from regular and extended sessions, independently of the session type you have selected for your chart.

Custom Session TimeZonesThis indicators show background colours to identify world timezones
You can setup five custom zones.
You can also define time interval to show/hide
Can be used to know from what time of the world they are traders awake or
to search correlations between big moves and timezones hours.
Thanks to:
www.tradingcode.net
01/06/2018

Securities day session - Opening-Range- Jayy Opening Range (OR) for regular daytime session eg NYSE 0 930hrs to 1600 hrs.
This is not for Forex sessions which is addressed in a separate script.
This script fixes two issues:
syntax error when code compiles
flaky plotting of the opening range and targets that required page reloading
Additions:
In this code there are more more opening range time period choices at the bottom of the format dialogue box
Opening Range Targets:
Opening Range Targets as per Leaf_West
Targets are set at 127% , 162%, 200 %, 262 %, 362%, 423%, 685%, 1109% and 1794% and this can be traded intraday using methods described at charts-by-leaf.com I also have some Leaf West PDFs that describe how the targets are set and how they are traded. There are others that use opening range.
See the notes in the script for more detail.
My first opening range script originated from work done by Chris Moody. This script has changed significantly but there are small remnants of Chris Moody's script lurking within.
This script is available to all.
Cheers Jayy

[RS]Open Range Breakout V3Request for DCC/coondawg71
added support for using session.
theres a issue with the session it needs to have the format inverted:
(start-end) to (end-start)
'0000-1500' to '1500-0000'
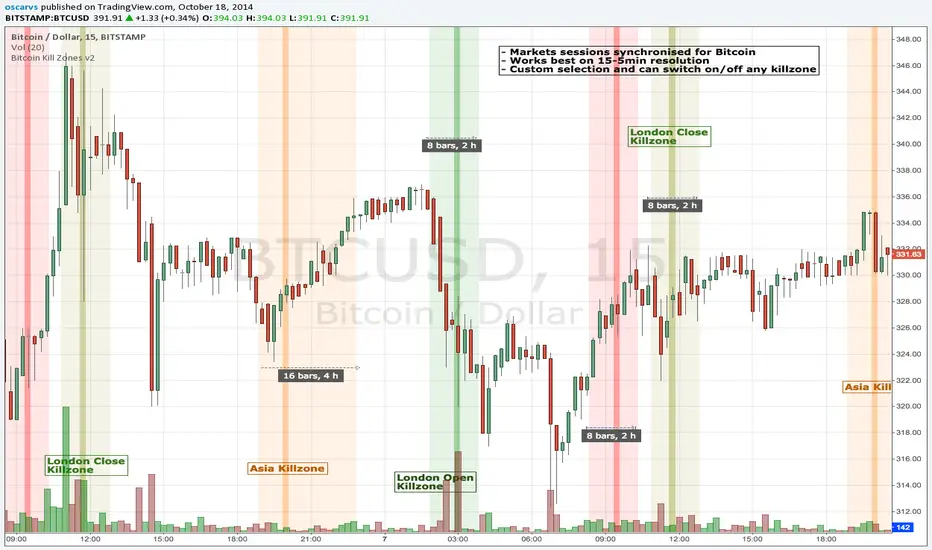
BITCOIN KILL ZONES v2Kill Zones
Kill zones are really liquidity events. Many different market participants often come together and act around these events. The activity itself may be event driven (margin calls or options exercise related activity), portfolio management driven (buy-on-close and asset allocation rebalancing orders) or institutionally driven (larger players needing liquidity to get filled in size) or a combination of any/all three. The point is, this intense cross current of activity at a very specific point in time often occurs near significant technical levels and trends established coming out of these events often persist until the next Kill Zone in approached/entered.
Specifically, there are three Kill Zones and each has its own importance/significance.
1. Asian Kill Zone (1900 - 2300 EST) Considered the "institutional" zone, this zone represents both the launch pad for new trends and also too a reloading area from the post American session. It is the start of a new day (or week) for the world and as such it makes sense this zone will often set the tone for the rest of the world's trading day. Since it is very wide (4 hours) one should pay attention to the Tokyo open (2100 EST) the Beijing open (2120 EST) and the Sydney open (0650 EST previous day).
2. London Kill Zone (0200 - 0400 EST) Considered the center of the financial universe for more than 500 years, Europe still carries a lot of influence within the banking world. Many larger players use the Euro session to establish their positions. As such, the London open often sees the most significant trend establishment activity through any given trading day. Indeed, it has been suggested 80% of all weekly trends are established through Tuesday's London Kill Zone.
3. New York Kill Zone (0830 - 1030 EST) The United States is still by far the world's largest economy and so by default New York's open carries a lot of weight and often comes with a big injection of liquidity. Indeed, most of the world's trade-able assets are priced in US dollars which gives even more significance to political and economic activity within this region. Because it comes relatively late in the globe's trading day, this Kill Zone often sees violent price swings within it's first hour leading to the time tested adage "never trust the first hour of North American trading.
Additional notes:
It has become apparent these Kill Zones are evolving over time and the course of world history. Since the end of the second world war, New York has slowly encroached on London's place as the global center for commercial banking. So much so through the later part of the 20th century New York was considered indeed, the new center of the financial universe. With the end of the cold war that leadership seems to have shifted back toward Europe and away from The United States. Additionally, Japan has slowly lost its former predominance within the global economic landscape while Beijing's has risen dramatically.
Only time will tell how these kill zones will evolve given each region's ever changing political, economic and socioeconomic influences.
Trading Notes:
If you have specific levels of interest odds are the bigger players have the same levels too. If it is indeed a solid level, look for price to trade to your level through the kill zone because the zone is a liquidity event where the bigger players can find enough size to get their big orders filled.
Try to avoid taking positions heading into Kill Zones and look for confirmation of your levels coming out of the event. For the more advanced trader, look to take positions on those level hits through the zone but understand higher time frame players often have far deeper pockets then day traders and can endure far more volatility then us little guys.
Thanks for the contribution to @CRInvestor and @ICT_MHuddleston
Daily Session DividerThis script draws vertical lines showing the new daily sessions. These will only be displayed when it's on an intraday timeframe (lower than daily timeframe).
Settings:
Line Color: Choose the color you want and change the opacity
Line Width: If you want a thicc line. Defaults to 1 (recommended setting)
Line Style: Choose between solid (default), dashed, or dotted

ICT MacrosThis script allows traders to visualize the range of time when a macro (an automated series of instructions/trades from large fund traders, executed by an algorithm) will likely occur in the market. It does this by drawing vertical lines and labels on the chart at these specific times:
(Macro Open) - 9:50 AM EST
(Macro Close) - 10:10 AM EST
(Macro Open) - 10:50 AM EST
(Macro Close) - 11:10 AM EST
(Macro Open) - 1:10 PM EST
(Macro Close) - 1:40 PM EST
(Macro Open) - 3:15 PM EST
(Macro Close) - 3:45 PM EST
The theory behind the use of these macros - is that the market will either seek buy side or sell side liquidity, or seek to rebalance price at a point of interest in between the open and close of the macro. Traders who follow this theory can use that information to anticipate how price might behave.
When a macro occurs, the script draws a vertical line on the chart using a dotted line style with a user-defined color. Additionally, a label is placed above the line to indicate whether it is a Macro Open or Macro Close event.
To preserve space, the labels are abbreviated on chart - "Macro Open" (M.O.) and "Macro Close" (M.C.) for both the morning and afternoon trading sessions. The labels may be turned on/off by the user.
The script also includes alerts that can notify traders when a macro occurs. These alerts can be set to go off once per bar close, and the alert message indicates the specific macro type and time.
This script is entirely open-source, meaning that traders can read the code and modify it as needed. Credit to the foundation of this script goes to TradingView user @rickyzcarroll for his open source Strat Assistant Hour Flip script. Important changes include the specific time changes and alert function.

Ultimate Time Filter V1The only time filter that you will ever need.
Easily filter for:
--> Start/End Dates
--> Weekdays
--> 1 or 2 Daily Trade Sessions.
This is open source on purpose so you can enjoy ease of use on your own codes. Simply copy the code and use the variable "inTime" to filter bars that fit your time constraints.
I spent a lot more time on this than I'd like to admit but so be it. Any comments for improvements, or questions on how to use the script is appreciated. Or if you wanna chat about trading / pine script hit me up on Discord.
Cheers
