EMA Envelope - Signal with Stoploss and Takeprofit LevelsDescription:
This Pine Script indicator implements the EMA Envelope strategy, which utilizes Exponential Moving Averages (EMA) to create an envelope around the price chart. The strategy generates buy and sell signals based on the crossing of the price above and below the upper and lower EMA envelopes, respectively. It also incorporates additional features such as stop-loss and take-profit levels for risk management.
Indicator Settings:
EMA Length: Specifies the period for the short-term Exponential Moving Average.
Long Term EMA Length: Defines the period for the long-term Exponential Moving Average used for signal filtering.
Take Profit Ratio: Determines the ratio for calculating the take-profit levels based on the stop-loss.
Filter Signal on Long Term EMA: Enables or disables the filtering of buy/sell signals using the long-term EMA.
Show only recent signal: When enabled, shows only the most recent buy/sell signals.
Buy and Sell Signals:
The indicator generates buy signals when the price crosses above the upper EMA envelope and the previous low was below the upper EMA envelope. Additionally, you can choose to filter buy signals based on whether the closing price is above the long-term EMA.
Conversely, sell signals are generated when the price crosses below the lower EMA envelope, and the previous high was above the lower EMA envelope. Similar to buy signals, sell signals can also be filtered using the long-term EMA.
Note: Signal works well on Higher Timeframes like Daily/8hrs/4hrs/1hr.
Stop-Loss and Take-Profit Levels:
For buy signals, the stop-loss is set at the lower EMA level, while the take-profit level is calculated by adding a specified ratio of the difference between the low and the stop-loss level to the low price.
For sell signals, the stop-loss is set at the upper EMA level, and the take-profit level is calculated by subtracting a specified ratio of the difference between the stop-loss level and the high price from the high price.
Disclaimer:
This indicator is provided for educational and informational purposes only. Trading involves significant risk, and past performance does not guarantee future results. Users are solely responsible for their trading decisions and should conduct their own research and risk management. The author shall not be held liable for any losses or damages arising from the use of this indicator.
Note: Always test the indicator thoroughly on historical data and consider paper trading before applying it to live trading environments.
Tìm kiếm tập lệnh với "signal"

Advanced Bollinger Bands Optimized - Precision SignalsThis indicator creates an advanced Bollinger Bands system with integrated ATR bands and intelligent trading signals. It features:
**Core Components:**
- Standard Bollinger Bands (20-period SMA with 1.382 standard deviations)
- ATR-based outer bands expanding on the Bollinger Bands
- Dynamic bandwidth analysis using Z-Score to measure current volatility relative to historical levels
**Market State Detection:**
Identifies five market conditions based on bandwidth Z-Score:
- Extreme Squeeze (ultra-low volatility)
- Squeeze (low volatility)
- Normal (average volatility)
- Expansion (high volatility)
- Extreme Expansion (ultra-high volatility)
**Signal System:**
Generates 5 bullish and 5 bearish signals:
*Bullish Signals:*
1. Bottom Divergence - Price makes new lows while Z-Score is relatively high
2. Width Reversal - Bandwidth rebounds from extreme squeeze
3. Extreme Squeeze Reversal - Recovery from extreme volatility compression
4. Squeeze Breakout Up - Price breaks above upper band during squeeze
5. State Transition - Market transitions from squeeze to expansion
*Bearish Signals:*
1. Top Divergence - Price makes new highs while Z-Score is relatively low
2. Width Reversal - Bandwidth declines from extreme expansion
3. Extreme Expansion Reversal - Contraction from extreme volatility expansion
4. Squeeze Breakout Down - Price breaks below lower band during squeeze
5. State Transition - Market transitions from expansion to squeeze
**Features:**
- Real-time signal table showing active signals
- Adjustable sensitivity parameters for divergence, reversal, and breakout signals
- Signal cooldown system to prevent duplicate alerts
- Clean visual display with band fills and alert markers
- No additional external indicators required
This tool helps traders identify volatility changes, trend reversals, and breakout opportunities using only price data and bandwidth analysis.

Buy Sell SignalBuy Sell Signal - EMA Crossover with Dynamic Risk Management
OVERVIEW
This indicator combines a dual EMA crossover system with ATR-based dynamic stop loss and take profit levels to provide complete trade management signals. Unlike basic EMA crossover scripts, this tool automatically calculates and displays entry points, stop losses, and take profit targets based on market volatility, offering traders a complete trading framework in a single indicator.
HOW IT WORKS
The indicator uses three core components working together:
Trend Detection: A fast EMA (default 5) and slow EMA (default 13) identify trend direction. When the fast EMA crosses above the slow EMA, it signals bullish momentum; when it crosses below, it signals bearish momentum.
Entry Validation: Optional candle confirmation filter ensures the crossover is accompanied by a bullish/bearish candle close, reducing false signals in choppy markets.
Risk Management: Uses ATR (Average True Range, default 14 periods) to calculate:
Stop Loss: Positioned below/above recent swing low/high minus ATR multiplier (default 0.5x)
Take Profit: Calculated using customizable risk-reward ratio (default 3:1)
KEY FEATURES
✅ Automatic Position Tracking: Monitors active trades and displays current position status (LONG/SHORT/No position)
✅ Visual Trade Management: Shows entry price (white dashed line), stop loss (red line), and take profit (green line) in real-time
✅ Trade Outcome Signals: Displays clear markers when TP is hit (🎯), SL is triggered (❌), or position is invalidated by opposite signal
✅ Information Dashboard: Live table showing entry price, SL, TP, and actual R:R ratio
✅ Smart Position Invalidation: Automatically closes and invalidates previous positions when opposite trend signal appears
✅ Customizable Alerts: Five alert conditions for BUY/SELL signals, TP hits, SL triggers, and invalidations
INPUTS
Fast EMA Length (default 5): Responsive to recent price action
Slow EMA Length (default 13): Defines broader trend direction
ATR Period (default 14): Volatility measurement period
SL Multiplier (default 0.5): Distance from swing point to stop loss
Risk:Reward Ratio (default 3.0): Target profit relative to risk
Candle Confirmation (default ON): Requires bullish/bearish candle on crossover
HOW TO USE
Apply the indicator to your chart (works on all timeframes)
Adjust EMA periods based on your trading style (shorter for scalping, longer for swing trading)
Set your preferred risk-reward ratio
Enable alerts for automated notifications
When a BUY/SELL signal appears, the indicator automatically calculates and displays your complete trade plan
Monitor the information table for live position updates
Exit when TP is reached or SL is triggered
TRADING METHODOLOGY
This script implements a momentum-following strategy based on exponential moving average crossovers, enhanced with volatility-adjusted risk parameters. The ATR-based stop loss adapts to market conditions—wider stops in volatile markets, tighter stops in calm markets. The position invalidation feature prevents traders from holding outdated positions when market sentiment shifts.
BEST PRACTICES
Use on trending markets for best results
Higher timeframes (4H, Daily) produce fewer but more reliable signals.
For scalpe use 5 and 15 minutes(Risk).
Consider market context and fundamental factors alongside signals
Adjust ATR multiplier based on asset volatility
Test different EMA combinations for your preferred instruments
ORIGINALITY
While EMA crossover systems are common, this script's value lies in its complete integration of entry logic, dynamic risk management, position tracking, and automated invalidation—features typically requiring multiple separate indicators. The ATR-based stop loss calculation and automatic R:R visualization provide practical trade execution guidance that basic crossover indicators lack.
Important Notes:
This indicator does not guarantee profitable trades
Always practice proper risk management
Backtest settings on historical data before live trading
Past performance does not indicate future results

DCA Percent SignalOverview
The DCA Percent Signal Indicator generates buy and sell signals based on percentage drops from all-time highs and percentage gains from lowest lows since ATH. This indicator is designed for pyramiding strategies where each signal represents a configurable percentage of equity allocation.
Definitions
DCA (Dollar-Cost Averaging): An investment strategy where you invest a fixed amount at regular intervals, regardless of price fluctuations. This indicator generates signals for a DCA-style pyramiding approach.
Gann Bar Types: Classification system for price bars based on their relationship to the previous bar:
Up Bar: High > previous high AND low ≥ previous low
Down Bar: High ≤ previous high AND low < previous low
Inside Bar: High ≤ previous high AND low ≥ previous low
Outside Bar: High > previous high AND low < previous low
ATH (All-Time High): The highest price level reached during the entire chart period
ATL (All-Time Low): The lowest price level reached since the most recent ATH
Pyramiding: A trading strategy that adds to positions on favorable price movements
Look-Ahead Bias: Using future information that wouldn't be available in real-time trading
Default Properties
Signal Thresholds:
Buy Threshold: 10% (triggers every 10% drop from ATH)
Sell Threshold: 30% (triggers every 30% gain from lowest low since ATH)
Price Sources:
ATH Tracking: High (ATH detection)
ATL Tracking: Low (low detection)
Buy Signal Source: Low (buy signals)
Sell Signal Source: High (sell signals)
Filter Options:
Apply Gann Filter: False (disabled by default)
Buy Sets ATL: False (disabled by default)
Display Options:
Show Buy/Sell Signals: True
Show Reference Lines: True
Show Info Table: False
Show Bar Type: False
How It Works
Buy Signals: Trigger every 10% drop from the all-time highest price reached
Sell Signals: Trigger every 30% increase from the lowest low since the most recent all-time high
Smart Tracking: Uses configurable price sources for signal generation
Key Features
Configurable Thresholds: Adjustable buy/sell percentage thresholds (default: 10%/30%)
Separate Price Sources: Independent sources for ATH tracking, ATL tracking, and signal triggers
Configurable Signals: Uses low for buy signals and high for sell signals by default
Optional Gann Filter: Apply Gann bar analysis for additional signal filtering
Optional Buy Sets ATL: Option to set ATL reference point when buy signals occur
Visual Debug: Detailed labels showing signal parameters and values
Usage Instructions
Apply to Chart: Use on any timeframe (recommended: 1D or higher for better signal quality)
Risk Management: Adjust thresholds based on your risk tolerance and market volatility
Signal Analysis: Monitor debug labels for detailed signal information and validation
Signal Logic
Buy signals are blocked when ATH increases to prevent buying at peaks
Sell signals are blocked when ATL decreases to prevent selling at lows
This ensures signals only trigger on subsequent bars, not the same bar that establishes new reference points
Buy Signals:
Calculate drop percentage from ATH to buy signal source
Trigger when drop reaches threshold increments (10%, 20%, 30%, etc.)
Always blocked on ATH bars to prevent buying at peaks
Optional: Also blocked on up/outside bars when Gann filter enabled
Sell Signals:
Calculate gain percentage from lowest low to sell signal source
Trigger when gain reaches threshold increments (30%, 60%, 90%, etc.)
Always blocked when ATL decreases to prevent selling at lows
Optional: Also blocked on down bars when Gann filter enabled
Limitations
Designed for trending markets; may generate many signals in sideways/ranging markets
Requires sufficient price movement to be effective
Not suitable for scalping or very short timeframes
Implementation Notes
Signals use optimistic price sources (low for buys, high for sells), these can be configured to be more conservative
Gann filter provides additional signal filtering based on bar types
Debug information available in data window for real-time analysis
Detailed labels on each signal show ATH, lowest low, buy level, sell level, and drop/gain percentages

HTF Candle Highs and Lows with Labels + High Probability Signals█ OVERVIEW
This indicator overlays Weekly, Daily, and H4 High/Low levels directly onto your chart, allowing traders to visualize key support and resistance zones from higher timeframes. It also includes high probability breakout signals that appear one candle after a confirmed breakout above or below these levels, filtered by volume and candle strength.
Use this tool to identify breakout opportunities with greater confidence and clarity.
█ FEATURES
• Plots Weekly, Daily, and H4 High and Low levels using request.security. • Customizable line colors, widths, and label sizes. • Toggle visibility for each timeframe independently. • Signals appear one candle after a confirmed breakout: • Bullish: Close above HTF High, strong candle, high volume. • Bearish: Close below HTF Low, strong candle, high volume. • Signal shapes match the color of the broken level for visual clarity.
█ HOW TO USE
1 — Enable the timeframes you want to track using the input toggles. 2 — Watch for triangle-shaped signals: • Upward triangle = Bullish breakout. • Downward triangle = Bearish breakout. 3 — Confirm the breakout: • Candle closes beyond the HTF level by at least 0.1%. • Candle body shows momentum (close > open for bullish, close < open for bearish). • Volume exceeds 20-period average. 4 — Enter trade on the candle after the signal. 5 — Use the HTF level as a reference for stop-loss placement. 6 — Combine with other indicators (e.g., RSI, EMA) for confluence.
█ LIMITATIONS
• Signals may lag by one candle due to confirmation logic. • Not optimized for low-volume assets or illiquid markets. • Best used in trending environments; avoid during consolidation. • Does not include automatic alerts (can be added manually).
█ BEST PRACTICES
• Use on H1 or higher timeframes for cleaner signals. • Avoid trading during news events or low volatility. • Backtest thoroughly before live trading. • Adjust breakout percentage and volume filter based on asset volatility. • Maintain a trading journal to track performance.

MAxRSI Signals [KedArc Quant]Description:
MAxRSI Indicator Marks LONG/SHORT signals from a Moving Average crossover and (optionally) confirms them with RSI. Includes repaint-safe confirmation, optional higher-timeframe (HTF) smoothing, bar coloring, and alert conditions.
Why combine MA + RSI
* The MA crossover is the primary trend signal (fast trend vs slow trend).
* RSI is a gate, not a second, separate signal. A crossover only becomes a trade signal if momentum agrees (e.g., RSI ≥ level for LONG, ≤ level for SHORT). This reduces weak crosses in ranging markets.
* The parts are integrated in one rule: *Crossover AND RSI condition (if enabled)* → plot signal/alert. No duplicated outputs or unrelated indicators.
How it works (logic)
* MA types: SMA / EMA / WMA / HMA (HMA is built via WMA of `len/2` and `len`, then WMA with `sqrt(len)`).
* Signals:
* LONG when *Fast MA crosses above Slow MA* and (if enabled) *RSI ≥ Long Min*.
* SHORT when *Fast MA crosses below Slow MA* and (if enabled) *RSI ≤ Short Max*.
* Repaint-safe (optional): confirms crosses on closed bars to avoid intrabar repaint.
* HTF (optional): computes MA/RSI on a higher timeframe to smooth noise on lower charts.
* Alerts: crossover alerts + state-flip (bull↔bear) alerts.
How to use (step-by-step)
1. Add to chart. Set MA Type, Fast and Slow (keep Fast < Slow).
2. Turn Use RSI Filter ON for confirmation (default: RSI 14 with 50/50 levels).
3. (Optional) Turn Repaint-Safe ON for close-confirmed signals.
4. (Optional) Turn HTF ON (e.g., 60 = 1h) for smoother signals on low TFs.
5. Enable alerts: pick “MAxRSI Long/Short” or “Bullish/Bearish State”.
Timeframe guidance
* Intraday (1–15m): EMA 9–20 fast vs EMA 50 slow, RSI filter at 50/50.
* Swing (1h–D): EMA 20 fast vs EMA 200 slow, RSI 50/50 (55/45 for stricter).
What makes it original
* Repaint-safe cross confirmation (previous-bar check) for reliable signals/alerts.
* HTF gating (doesn’t compute both branches) for speed and clarity.
* Warning-free MA helper (precomputes SMA/EMA/WMA/HMA each bar), HMA built from built-ins only.
* State-flip alerts and optional RSI overlay on price pane.
Built-ins used
`ta.sma`, `ta.ema`, `ta.wma`, (HMA built from these), `ta.rsi`, `ta.crossover`, `ta.crossunder`, `request.security`, `plot`, `plotshape`, `barcolor`, `alertcondition`, `input.*`, `math.*`.
Note: Indicator only (no orders). Test settings per symbol. Not financial advice.
⚠️ Disclaimer
This script is provided for educational purposes only.
Past performance does not guarantee future results.
Trading involves risk, and users should exercise caution and use proper risk management when applying this strategy.

PHL Sweep Signals(1 Hour)PHL Sweep Signals (Full History)
This indicator is designed to identify high-probability reversal setups by detecting liquidity sweeps of the previous standard hour's high and low (PHL). It provides clear, actionable signals complete with visual aids and a data table to keep you in tune with the higher-timeframe context.
Key Features
Previous Hour Levels: Automatically draws the high and low of the previous standard hour as key reference lines for the current trading hour. The line colors rotate to provide a clear visual separation.
Bearish Sweep Signal: Identifies a specific bearish pattern: a green (bullish) candle that wicks above the previous hour's high but fails to hold, with its body remaining entirely below the line.
Bullish Sweep Signal: Identifies the opposite bullish pattern: a red (bearish) candle that wicks below the previous hour's low but is absorbed, with its body remaining entirely above the line.
Clear Visual Signals: When a signal is confirmed, the indicator provides a multi-faceted alert:
Plots a "Buy" or "Sell" arrow on the chart.
Draws a colored box around the signal candle for easy identification.
Displays a label with the potential Stop Loss size (calculated from the size of the signal candle).
Informative Display Table: Includes a convenient table in the corner showing the Open and Close data for the last 3 hours, helping you stay aware of the broader market context without leaving your chart.
Built-in Alerts: Triggers an alert for every confirmed Buy and Sell signal so you never miss a potential setup.
How to Use
This indicator helps you spot potential exhaustion and reversals at key hourly levels.
A "Sell" signal suggests a failed breakout to the upside, indicating potential weakness and a possible entry for shorts.
A "Buy" signal suggests a failed breakdown to the downside, indicating potential strength and a possible entry for longs.
As with any tool, these signals are most powerful when used as part of a comprehensive trading strategy and combined with your own analysis for confirmation.
Optimal Settings:
Timeframe: 5-Minute
Time Zone: UTC-4 (New York Time)
-ratheeshinv

THF Crossover and Trend Signals Golden & Death Cross with VolumeScript Overview:
This Pine Script is designed to assist traders in identifying key buy/sell signals and major trend changes on the chart using Exponential Moving Averages (EMA) and Simple Moving Averages (SMA), as well as visualizing Golden Cross and Death Cross events. The script also includes a volume indicator to highlight the volume trading activity in relation to the price movements.
Key Features:
1. Moving Averages:
EMA 21: Exponential Moving Average over a 21-period, shown in green.
EMA 50: Exponential Moving Average over a 50-period, shown in yellow.
SMA 50: Simple Moving Average over a 50-period, shown in red.
SMA 200: Simple Moving Average over a 200-period, shown in blue.
2. Signals:
Buy Signal: Generated when EMA 21 crosses above SMA 50, indicating a potential upward trend. Displayed with a green label below the price bar.
Sell Signal: Generated when EMA 21 crosses below SMA 50, indicating a potential downward trend. Displayed with a red label above the price bar.
3. Golden Cross (Bullish Trend):
A Golden Cross occurs when EMA 50 crosses above SMA 200, which often signals the start of a long-term upward trend. The signal is displayed with a yellow label below the price bar.
4. Death Cross (Bearish Trend):
A Death Cross occurs when EMA 50 crosses below SMA 200, which often signals the start of a long-term downward trend. The signal is displayed with a blue label above the price bar.
5. Volume Indicator:
The volume is plotted as colored columns. Green indicates higher volume than the 20-period moving average, and red indicates lower volume.
A Volume Moving Average (SMA 20) is also plotted to compare volume changes over time.
How the Script Works:
1. The EMA and SMA lines are plotted on the chart, providing a visual representation of the short- and long-term trends.
2. Buy/Sell signals are triggered based on the crossover between EMA 21 and SMA 50, helping to identify potential entry and exit points.
3. The Golden Cross and Death Cross indicators highlight major trend reversals based on the crossover between EMA 50 and SMA 200, providing clear visual cues for long-term trend changes.
4. Volume is displayed alongside price movements, offering insight into the strength or weakness of a trend.
Key Customizations:
Moving Average Periods: Users can modify the lengths of the EMAs and SMAs for customized analysis.
Volume Moving Average Period: The script allows for adjustment of the volume moving average period to suit different market conditions.
Signal Visibility: The size and color of the buy, sell, Golden Cross, and Death Cross signals can be easily customized to make them more prominent on the chart.
Conclusion:
This script is ideal for traders looking to combine price action with volume analysis, using key technical indicators such as EMA, SMA, Golden Cross, and Death Cross to make informed decisions in trending markets.
---
This explanation covers all aspects of the script and provides a clear understanding of its functionality, which is helpful for sharing the script or using it as an educational resource.

Multi-Mode MACD Signals v2Multi-Mode MACD Signals v2
Signal Types Explained ⚙️
You can now choose your preferred signal from a dropdown menu in the indicator's settings:
Pullback (Default): The original, high-probability strategy. It identifies "buy the dip" and "sell the rally" opportunities within an established trend.
Buy: Triggers on a bullish MACD/Signal line cross above the zero line.
Sell: Triggers on a bearish MACD/Signal line cross below the zero line.
Standard Crossover: The most common MACD signal. It's a pure momentum signal that triggers whenever the MACD line crosses the signal line, regardless of the trend.
Buy: MACD line crosses above the Signal line.
Sell: MACD line crosses below the Signal line.
Zero Line Cross: A trend-change signal. It identifies when the overall momentum shifts from bullish to bearish or vice-versa.
Buy: MACD line crosses above the Zero line.
Sell: MACD line crosses below the Zero line.
How Signals Are Displayed (Real-time vs. Confirmed)
This indicator addresses your request to have signals "display as it occurs" automatically. Here is how it works:
Real-time Alert (As it Occurs): On a live, developing candle, a "BUY" or "SELL" label may appear the instant the MACD conditions are met. This gives you the earliest possible warning.
Signal Repainting: Because the price is still moving within the live candle, the signal may appear and later disappear if the conditions are no longer met by the time the candle closes. This is known as "repainting".
Confirmed Signal: Once the candle closes, the signal is locked in and will never change. This is the confirmed, non-repainting signal.
To create alerts based on these signals, right-click a label on the chart, select "Add alert on Multi-Mode MACD Signals," and choose "Once Per Bar Close" for a confirmed signal or "Once Per Bar" for an earlier, real-time alert.
Williams Fractals with Buy/Sell Signals🧠 Concept:
This indicator is based on the concept of fractal swing highs and lows, commonly used in Bill Williams’ trading methods. A fractal forms when a candle’s high or low is higher/lower than a set number of candles on both sides. This structure helps identify local market turning points.
⚙️ Inputs:
Fractal Sensitivity (swingSensitivity):
Number of candles required on each side of the central bar to validate a fractal.
For example, if set to 2, a swing high is detected when a bar’s high is higher than the previous 2 bars and the next 2 bars.
✅ Features:
Fractal Detection:
Plots white triangles above swing highs (down fractals).
Plots white triangles below swing lows (up fractals).
Buy/Sell Signals:
Buy Signal: Triggered when the candle closes above the most recent down fractal.
Sell Signal: Triggered when the candle closes below the most recent up fractal.
Signals alternate — a Buy must follow a Sell and vice versa to reduce noise.
Signal Labels:
"BUY" label appears below the candle in green.
"SELL" label appears above the candle in red.
Alerts:
Real-time alerts are available for both Buy and Sell signals via alertcondition().
📌 Use Case:
This indicator can help you:
Detect short-term reversals.
Confirm breakouts or structure shifts.
Time entries with clear logic based on price action.
OpenAI Signal Generator - Enhanced Accuracy# AI-Powered Trading Signal Generator Guide
## Overview
This is an advanced trading signal generator that combines multiple technical indicators using AI-enhanced logic to generate high-accuracy trading signals. The indicator uses a sophisticated combination of RSI, MACD, Bollinger Bands, EMAs, ADX, and volume analysis to provide reliable buy/sell signals with comprehensive market analysis.
## Key Features
### 1. Multi-Indicator Analysis
- **RSI (Relative Strength Index)**
- Length: 14 periods (default)
- Overbought: 70 (default)
- Oversold: 30 (default)
- Used for identifying overbought/oversold conditions
- **MACD (Moving Average Convergence Divergence)**
- Fast Length: 12 (default)
- Slow Length: 26 (default)
- Signal Length: 9 (default)
- Identifies trend direction and momentum
- **Bollinger Bands**
- Length: 20 periods (default)
- Multiplier: 2.0 (default)
- Measures volatility and potential reversal points
- **EMAs (Exponential Moving Averages)**
- Fast EMA: 9 periods (default)
- Slow EMA: 21 periods (default)
- Used for trend confirmation
- **ADX (Average Directional Index)**
- Length: 14 periods (default)
- Threshold: 25 (default)
- Measures trend strength
- **Volume Analysis**
- MA Length: 20 periods (default)
- Threshold: 1.5x average (default)
- Confirms signal strength
### 2. Advanced Features
- **Customizable Signal Frequency**
- Daily
- Weekly
- 4-Hour
- Hourly
- On Every Close
- **Enhanced Filtering**
- EMA crossover confirmation
- ADX trend strength filter
- Volume confirmation
- ATR-based volatility filter
- **Comprehensive Alert System**
- JSON-formatted alerts
- Detailed technical analysis
- Multiple timeframe analysis
- Customizable alert frequency
## How to Use
### 1. Initial Setup
1. Open TradingView and create a new chart
2. Select your preferred trading pair
3. Choose an appropriate timeframe
4. Apply the indicator to your chart
### 2. Configuration
#### Basic Settings
- **Signal Frequency**: Choose how often signals are generated
- Daily: Signals at the start of each day
- Weekly: Signals at the start of each week
- 4-Hour: Signals every 4 hours
- Hourly: Signals every hour
- On Every Close: Signals on every candle close
- **Enable Signals**: Toggle signal generation on/off
- **Include Volume**: Toggle volume analysis on/off
#### Technical Parameters
##### RSI Settings
- Adjust `rsi_length` (default: 14)
- Modify `rsi_overbought` (default: 70)
- Modify `rsi_oversold` (default: 30)
##### EMA Settings
- Fast EMA Length (default: 9)
- Slow EMA Length (default: 21)
##### MACD Settings
- Fast Length (default: 12)
- Slow Length (default: 26)
- Signal Length (default: 9)
##### Bollinger Bands
- Length (default: 20)
- Multiplier (default: 2.0)
##### Enhanced Filters
- ADX Length (default: 14)
- ADX Threshold (default: 25)
- Volume MA Length (default: 20)
- Volume Threshold (default: 1.5)
- ATR Length (default: 14)
- ATR Multiplier (default: 1.5)
### 3. Signal Interpretation
#### Buy Signal Requirements
1. RSI crosses above oversold level (30)
2. Price below lower Bollinger Band
3. MACD histogram increasing
4. Fast EMA above Slow EMA
5. ADX above threshold (25)
6. Volume above threshold (if enabled)
7. Market volatility check (if enabled)
#### Sell Signal Requirements
1. RSI crosses below overbought level (70)
2. Price above upper Bollinger Band
3. MACD histogram decreasing
4. Fast EMA below Slow EMA
5. ADX above threshold (25)
6. Volume above threshold (if enabled)
7. Market volatility check (if enabled)
### 4. Visual Indicators
#### Chart Elements
- **Moving Averages**
- SMA (Blue line)
- Fast EMA (Yellow line)
- Slow EMA (Purple line)
- **Bollinger Bands**
- Upper Band (Green line)
- Middle Band (Orange line)
- Lower Band (Green line)
- **Signal Markers**
- Buy Signals: Green triangles below bars
- Sell Signals: Red triangles above bars
- **Background Colors**
- Light green: Buy signal period
- Light red: Sell signal period
### 5. Alert System
#### Alert Types
1. **Signal Alerts**
- Generated when buy/sell conditions are met
- Includes comprehensive technical analysis
- JSON-formatted for easy integration
2. **Frequency-Based Alerts**
- Daily/Weekly/4-Hour/Hourly/Every Close
- Includes current market conditions
- Technical indicator values
#### Alert Message Format
```json
{
"symbol": "TICKER",
"side": "BUY/SELL/NONE",
"rsi": "value",
"macd": "value",
"signal": "value",
"adx": "value",
"bb_upper": "value",
"bb_middle": "value",
"bb_lower": "value",
"ema_fast": "value",
"ema_slow": "value",
"volume": "value",
"vol_ma": "value",
"atr": "value",
"leverage": 10,
"stop_loss_percent": 2,
"take_profit_percent": 5
}
```
## Best Practices
### 1. Signal Confirmation
- Wait for multiple confirmations
- Consider market conditions
- Check volume confirmation
- Verify trend strength with ADX
### 2. Risk Management
- Use appropriate position sizing
- Implement stop losses (default 2%)
- Set take profit levels (default 5%)
- Monitor market volatility
### 3. Optimization
- Adjust parameters based on:
- Trading pair volatility
- Market conditions
- Timeframe
- Trading style
### 4. Common Mistakes to Avoid
1. Trading without volume confirmation
2. Ignoring ADX trend strength
3. Trading against the trend
4. Not considering market volatility
5. Overtrading on weak signals
## Performance Monitoring
Regularly review:
1. Signal accuracy
2. Win rate
3. Average profit per trade
4. False signal frequency
5. Performance in different market conditions
## Disclaimer
This indicator is for educational purposes only. Past performance is not indicative of future results. Always use proper risk management and trade responsibly. Trading involves significant risk of loss and is not suitable for all investors.

MFI + RSI + EMA Dynamic SignalsThe MFI + RSI + EMA Dynamic Signals is a designed to combine with widened criteria to capture more trading opportunities, it balances momentum, trend, and flexibility, making it suitable for trading on timeframes like 15-minute to 4-hour charts.
How It Works
The indicator uses three technical components with relaxed criteria to produce signals:
Money Flow Index (MFI) for Momentum Extremes:
The MFI, calculated over a 14-period length, measures buying and selling pressure using price and volume. A buy signal can trigger when MFI crosses above the oversold level (default: 30, widened from 20), indicating potential buying pressure, while a sell signal can occur when MFI crosses below the overbought level (default: 70, widened from 80), suggesting selling pressure.
Relative Strength Index (RSI) for Momentum Confirmation:
The RSI, calculated over a 14-period length, confirms momentum strength. Bullish momentum is confirmed when RSI is above a buy threshold (default: 45, relaxed from 50), and bearish momentum when below a sell threshold (default: 55, relaxed from 50), allowing more signals near neutral momentum levels.
Exponential Moving Average (EMA) for Trend Sensitivity:
The indicator uses a fast EMA (default: 9 periods) and a slow EMA (default: 21 periods) to detect trend direction and crossovers. Signals can trigger when the fast EMA crosses the slow EMA, or when the fast EMA is within a proximity threshold (default: 0.5%) of the slow EMA, capturing early trend changes and increasing signal frequency.
Signal Generation
Signals are generated using the previous bar’s values to prevent repainting, with widened criteria for more frequent triggers:
Buy Signal: Either the MFI crosses above the oversold level or the fast EMA crosses above the slow EMA, and either RSI confirms bullish momentum (above 45) or the EMAs are near a crossover (within 0.5%). Displayed as a green upward triangle below the bar.
Sell Signal: Either the MFI crosses below the overbought level or the fast EMA crosses below the slow EMA, and either RSI confirms bearish momentum (below 55) or the EMAs are near a crossover (within 0.5%). Displayed as a red downward triangle above the bar.

Dynamic Volume Clusters with Retest Signals (Zeiierman)█ Overview
The Dynamic Volume Clusters with Retest Signals indicator is designed to detect key Volume Clusters and provide Retest Signals. This tool is specifically engineered for traders looking to capitalize on volume-based trends, reversals, and key price retest points.
The indicator seamlessly combines volume analysis, dynamic cluster calculations, and retest signal logic to present a comprehensive trading framework. It adapts to market conditions, identifying clusters of volume activity and signaling when the price retests critical zones.
█ How It Works
⚪ Volume Cluster Detection
The indicator dynamically calculates volume clusters by analyzing the highest and lowest price points within a specified lookback period.
Cluster Logic:
Bright Lines (Strong Red/Green):
These indicate that the price has frequently revisited these levels, creating a dense cluster.
Such areas serve as support or resistance, where significant historical trading has occurred, often acting as barriers to price movement.
Traders should consider these levels as potential reversal zones or consolidation points.
Faded or Darker Lines:
These lines indicate areas where the price has less historical activity, suggesting weaker clustering.
These zones have less market memory and are more likely to break, supporting trend continuation and rapid price movement.
⚪ Candle Color Logic (Market Memory)
Blue Candles (High Cluster Density):
Candles turn blue when the price has revisited a particular area many times.
This signals a highly clustered zone, likely to act as a barrier, creating consolidation or range phases.
These areas indicate strong market memory, potentially rejecting price attempts to break through.
Green or Red Candles (Low Cluster Density):
Once the price breaks out of these dense clusters, the candles turn green (bullish) or red (bearish).
This suggests the price has moved into a less clustered territory, where the path forward is clearer and trends are likely to extend without immediate resistance.
⚪ Retest Signal Logic
The indicator identifies critical retest points where the price crosses a cluster boundary and then reverses. These points are essential for traders looking to catch continuation or reversal setups.
⚪ Dynamic Price Clustering
The indicator dynamically adapts the clustering logic based on price movement and volume shifts.
Uses a dynamic moving average (VPMA) to maintain adaptive cluster levels.
Integrates a Kalman Filter for smoothing, reducing noise, and improving trend clarity.
Automatically updates as new data is received, keeping the clusters relevant in real-time.
█ How to Use
⚪ Trend Following & Reversal Detection
Use Retest signals to identify potential trend continuation or reversal points.
⚪ Trading Volume Clusters and Market Memory
Identify Key Zones:
Focus on bright, saturated cluster lines (strong red or green) as they indicate high market memory, where price has spent significant time in the past.
These zones are likely to exhibit a more choppy market. Apply range or mean reversion strategies.
Spot Potential Breakouts:
Faded or darker cluster lines indicate areas of low market memory, where the price has moved quickly and spent less time.
Use these areas to identify possible trend setups, as they represent lower resistance to price movement.
⚪ Interpreting Candle Colors for Market Phases
Blue Candles (High Cluster Density):
When candles turn blue, it signals that the price has revisited this area multiple times, creating a dense cluster.
These zones often trap price movement, leading to consolidations or range phases.
Use these areas as caution zones, where price can slow down or reverse.
Green or Red Candles (Low Cluster Density):
Once the price breaks out of these clustered zones, the candles turn green (bullish) or red (bearish), indicating lower market memory.
This signals a trend initiation with less immediate resistance, ideal for momentum and breakout trades.
Use these signals to identify emerging trends and ride the momentum.
█ Settings
Range Lookback Period: Sets the number of bars for calculating the range.
Zone Width (% of Range): Determines how wide the volume clusters are relative to the calculated range.
Volume Line Colors: Customize the appearance of bullish and bearish lines.
Retest Signals: Toggle the appearance of Triangle Up/Down retest markers.
Minimum Bars for Retest: Define the minimum number of bars required before a retest is valid.
Maximum Bars for Retest: Set the maximum number of bars within which a retest can occur.
Price Cluster Period: Adjusts the sensitivity of the dynamic clustering logic.
Cluster Confirmation: Controls how tightly the clusters respond to price action.
Price Cluster Start/Peak: Sets the minimum and maximum touches required to fully form a cluster.
-----------------
Disclaimer
The content provided in my scripts, indicators, ideas, algorithms, and systems is for educational and informational purposes only. It does not constitute financial advice, investment recommendations, or a solicitation to buy or sell any financial instruments. I will not accept liability for any loss or damage, including without limitation any loss of profit, which may arise directly or indirectly from the use of or reliance on such information.
All investments involve risk, and the past performance of a security, industry, sector, market, financial product, trading strategy, backtest, or individual's trading does not guarantee future results or returns. Investors are fully responsible for any investment decisions they make. Such decisions should be based solely on an evaluation of their financial circumstances, investment objectives, risk tolerance, and liquidity needs.

US30 HMA Signal v2.8Indicator Description – US30 HMA Signal v2.8
Overview:
The US30 HMA Signal indicator is designed to generate Buy and Sell signals based on the crossover of three Hull Moving Averages (HMAs). The indicator focuses on identifying momentum shifts and directional bias using the 9, 21, and 50 HMA structures, optimised for the US30 (Dow Jones) index.
⸻
Indicator Components:
1. Hull Moving Averages (HMAs):
• 9 HMA (Green): Fastest HMA, responds quickly to price changes.
• 21 HMA (Amber): Medium-term HMA, acts as a transitional filter.
• 50 HMA (Red): Slowest HMA, defines the broader trend direction.
⸻
Logic and Signal Conditions:
1. Session Filter:
• Signals are only generated during the US session, defined as starting at 13:30 BST.
2. Directional Bias:
• Bullish Bias: Occurs when both the 9 HMA and 21 HMA are above the 50 HMA.
• Bearish Bias: Occurs when both the 9 HMA and 21 HMA are below the 50 HMA.
3. Crossover Logic:
• Buy Signal: Prints when the 9 HMA crosses above the 21 HMA while the directional bias is bullish.
• Sell Signal: Prints when the 9 HMA crosses below the 21 HMA while the directional bias is bearish.
4. Minimum Bar Spacing:
• To avoid signal clustering, a minimum bar spacing of 5 bars is implemented between consecutive signals.
⸻
Plotting:
• Buy Signal: Displays as a green label below the candle with the text “BUY.”
• Sell Signal: Displays as a red label above the candle with the text “SELL.”
⸻
Purpose and Usage:
• The indicator is designed for traders looking to capture momentum shifts in the US30 index using HMA crossovers.
• It is best applied on the 5-minute timeframe to balance signal frequency and reliability.
• The strict session filter ensures signals are only generated during the most volatile period, aligning with US market activity.
Trading-Focused RSI with Quality SignalsOverview
Transforms the classic Relative Strength Index into a comprehensive trading system that delivers clear, high-quality signals. Unlike basic RSI indicators that leave interpretation to the trader, TraderRSI filters out noise and highlights only the most promising trading opportunities.
Key Features
Signal Quality Over Quantity
Smart Divergence Detection that identifies only significant, tradable divergences (not every minor oscillation)
Automated Signal Confirmation requiring persistence for multiple bars to eliminate false signals
Clear BUY/SELL Labels appear only on high-probability setups where multiple conditions align
Enhanced Visualization
Color-Coded RSI Line instantly communicates bullish/bearish momentum
Signal Line Crossovers to confirm trend changes early
Trend-Based Background Coloring providing immediate market context
Uncluttered Chart designed specifically for day traders and swing traders
Integrated Market Context
Optional Trend Filter using a 50-period moving average for directional bias
Overbought/Oversold Zones with subtle background highlighting
Divergence Strength Filtering ensures only meaningful divergences are displayed
Trading Applications
For Day Traders
Find precise entry and exit points with clear visual signals. Divergence signals combined with RSI crossovers provide powerful intraday setups.
For Swing Traders
The quality-focused signal system identifies only high-probability trend reversals, perfect for multi-day positions. Background coloring provides immediate trend context.
For Investors
Easily identify overbought or oversold conditions in your watchlist. The trend filter helps distinguish between temporary pullbacks and major reversals.
How to Use
Strong Buy Signal: When a green "BUY" label appears, RSI has crossed above the oversold level with bullish divergence confirmation and (optional) trend alignment
Strong Sell Signal: When a red "SELL" label appears, RSI has crossed below the overbought level with bearish divergence confirmation and (optional) trend alignment
Alert System: Set alerts on any of the eight customizable conditions to never miss a quality trade setup

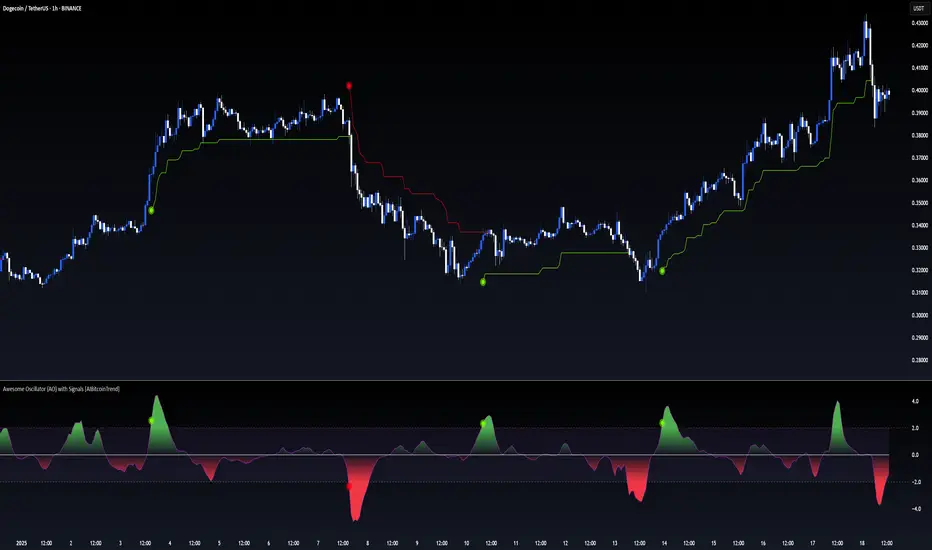
Awesome Oscillator (AO) with Signals [AIBitcoinTrend]👽 Multi-Scale Awesome Oscillator (AO) with Signals (AIBitcoinTrend)
The Multi-Scale Awesome Oscillator transforms the traditional Awesome Oscillator (AO) by integrating multi-scale wavelet filtering, enhancing its ability to detect momentum shifts while maintaining responsiveness across different market conditions.
Unlike conventional AO calculations, this advanced version refines trend structures using high-frequency, medium-frequency, and low-frequency wavelet components, providing traders with superior clarity and adaptability.
Additionally, it features real-time divergence detection and an ATR-based dynamic trailing stop, making it a powerful tool for momentum analysis, reversals, and breakout strategies.
👽 What Makes the Multi-Scale AO – Wavelet-Enhanced Momentum Unique?
Unlike traditional AO indicators, this enhanced version leverages wavelet-based decomposition and volatility-adjusted normalization, ensuring improved signal consistency across various timeframes and assets.
✅ Wavelet Smoothing – Multi-Scale Extraction – Captures short-term fluctuations while preserving broader trend structures.
✅ Frequency-Based Detail Weights – Separates high, medium, and low-frequency components to reduce noise and improve trend clarity.
✅ Real-Time Divergence Detection – Identifies bullish and bearish divergences for early trend reversals.
✅ Crossovers & ATR-Based Trailing Stops – Implements intelligent trade management with adaptive stop-loss levels.
👽 The Math Behind the Indicator
👾 Wavelet-Based AO Smoothing
The indicator applies multi-scale wavelet decomposition to extract high-frequency, medium-frequency, and low-frequency trend components, ensuring an optimal balance between reactivity and smoothness.
sma1 = ta.sma(signal, waveletPeriod1)
sma2 = ta.sma(signal, waveletPeriod2)
sma3 = ta.sma(signal, waveletPeriod3)
detail1 = signal - sma1 // High-frequency detail
detail2 = sma1 - sma2 // Intermediate detail
detail3 = sma2 - sma3 // Low-frequency detail
advancedAO = weightDetail1 * detail1 + weightDetail2 * detail2 + weightDetail3 * detail3
Why It Works:
Short-Term Smoothing: Captures rapid fluctuations while minimizing noise.
Medium-Term Smoothing: Balances short-term and long-term trends.
Long-Term Smoothing: Enhances trend stability and reduces false signals.
👾 Z-Score Normalization
To ensure consistency across different markets, the Awesome Oscillator is normalized using a Z-score transformation, making overbought and oversold levels stable across all assets.
normFactor = ta.stdev(advancedAO, normPeriod)
normalizedAO = advancedAO / nz(normFactor, 1)
Why It Works:
Standardizes AO values for comparison across assets.
Enhances signal reliability, preventing misleading spikes.
👽 How Traders Can Use This Indicator
👾 Divergence Trading Strategy
Bullish Divergence
Price makes a lower low, while AO forms a higher low.
A buy signal is confirmed when AO starts rising.
Bearish Divergence
Price makes a higher high, while AO forms a lower high.
A sell signal is confirmed when AO starts declining.
👾 Buy & Sell Signals with Trailing Stop
Bullish Setup:
✅AO crosses above the bullish trigger level → Buy Signal.
✅Trailing stop placed at Low - (ATR × Multiplier).
✅Exit if price crosses below the stop.
Bearish Setup:
✅AO crosses below the bearish trigger level → Sell Signal.
✅Trailing stop placed at High + (ATR × Multiplier).
✅Exit if price crosses above the stop.
👽 Why It’s Useful for Traders
Wavelet-Enhanced Filtering – Retains essential trend details while eliminating excessive noise.
Multi-Scale Momentum Analysis – Separates different trend frequencies for enhanced clarity.
Real-Time Divergence Alerts – Identifies early reversal signals for better entries and exits.
ATR-Based Risk Management – Ensures stops dynamically adapt to market conditions.
Works Across Markets & Timeframes – Suitable for stocks, forex, crypto, and futures trading.
👽 Indicator Settings
AO Short Period – Defines the short-term moving average for AO calculation.
AO Long Period – Defines the long-term moving average for AO smoothing.
Wavelet Smoothing – Adjusts multi-scale decomposition for different market conditions.
Divergence Detection – Enables or disables real-time divergence analysis. Normalization Period – Sets the lookback period for standard deviation-based AO normalization.
Cross Signals Sensitivity – Controls crossover signal strength for buy/sell signals.
ATR Trailing Stop Multiplier – Adjusts the sensitivity of the trailing stop.
Disclaimer: This indicator is designed for educational purposes and does not constitute financial advice. Please consult a qualified financial advisor before making investment decisions.
CCI with Signals & Divergence [AIBitcoinTrend]👽 CCI with Signals & Divergence (AIBitcoinTrend)
The Hilbert Adaptive CCI with Signals & Divergence takes the traditional Commodity Channel Index (CCI) to the next level by dynamically adjusting its calculation period based on real-time market cycles using Hilbert Transform Cycle Detection. This makes it far superior to standard CCI, as it adapts to fast-moving trends and slow consolidations, filtering noise and improving signal accuracy.
Additionally, the indicator includes real-time divergence detection and an ATR-based trailing stop system, helping traders identify potential reversals and manage risk effectively.
👽 What Makes the Hilbert Adaptive CCI Unique?
Unlike the traditional CCI, which uses a fixed-length lookback period, this version automatically adjusts its lookback period using Hilbert Transform to detect the dominant cycle in the market.
✅ Hilbert Transform Adaptive Lookback – Dynamically detects cycle length to adjust CCI sensitivity.
✅ Real-Time Divergence Detection – Instantly identifies bullish and bearish divergences for early reversal signals.
✅ Implement Crossover/Crossunder signals tied to ATR-based trailing stops for risk management
👽 The Math Behind the Indicator
👾 Hilbert Transform Cycle Detection
The Hilbert Transform estimates the dominant market cycle length based on the frequency of price oscillations. It is computed using the in-phase and quadrature components of the price series:
tp = (high + low + close) / 3
smooth = (tp + 2 * tp + 2 * tp + tp ) / 6
detrender = smooth - smooth
quadrature = detrender - detrender
inPhase = detrender + quadrature
outPhase = quadrature - inPhase
instPeriod = 0.0
deltaPhase = math.abs(inPhase - inPhase ) + math.abs(outPhase - outPhase )
instPeriod := nz(3.25 / deltaPhase, instPeriod )
dominantCycle = int(math.min(math.max(instPeriod, cciMinPeriod), 500))
Where:
In-Phase & Out-Phase Components are derived from a detrended version of the price series.
Instantaneous Frequency measures the rate of cycle change, allowing the CCI period to adjust dynamically.
The result is bounded within a user-defined min/max range, ensuring stability.
👽 How Traders Can Use This Indicator
👾 Divergence Trading Strategy
Bullish Divergence Setup:
Price makes a lower low, while CCI forms a higher low.
Buy signal is confirmed when CCI shows upward momentum.
Bearish Divergence Setup:
Price makes a higher high, while CCI forms a lower high.
Sell signal is confirmed when CCI shows downward momentum.
👾 Trailing Stop & Signal-Based Trading
Bullish Setup:
✅ CCI crosses above -100 → Buy signal.
✅ A bullish trailing stop is placed at Low - (ATR × Multiplier).
✅ Exit if the price crosses below the stop.
Bearish Setup:
✅ CCI crosses below 100 → Sell signal.
✅ A bearish trailing stop is placed at High + (ATR × Multiplier).
✅ Exit if the price crosses above the stop.
👽 Why It’s Useful for Traders
Hilbert Adaptive Period Calculation – No more fixed-length periods; the indicator dynamically adapts to market conditions.
Real-Time Divergence Alerts – Helps traders anticipate market reversals before they occur.
ATR-Based Risk Management – Stops automatically adjust based on volatility.
Works Across Multiple Markets & Timeframes – Ideal for stocks, forex, crypto, and futures.
👽 Indicator Settings
Min & Max CCI Period – Defines the adaptive range for Hilbert-based lookback.
Smoothing Factor – Controls the degree of smoothing applied to CCI.
Enable Divergence Analysis – Toggles real-time divergence detection.
Lookback Period – Defines the number of bars for detecting pivot points.
Enable Crosses Signals – Turns on CCI crossover-based trade signals.
ATR Multiplier – Adjusts trailing stop sensitivity.
Disclaimer: This indicator is designed for educational purposes and does not constitute financial advice. Please consult a qualified financial advisor before making investment decisions.

TradFi Fundamentals: Momentum Trading with Macroeconomic DataIntroduction
This indicator combines traditional price momentum with key macroeconomic data. By retrieving GDP, inflation, unemployment, and interest rates using security calls, the script automatically adapts to the latest economic data. The goal is to blend technical analysis with fundamental insights to generate a more robust momentum signal.
Original Research Paper by Mohit Apte, B. Tech Scholar, Department of Computer Science and Engineering, COEP Technological University, Pune, India
Link to paper
Explanation
Price Momentum Calculation:
The indicator computes price momentum as the percentage change in price over a configurable lookback period (default is 50 days). This raw momentum is then normalized using a rolling simple moving average and standard deviation over a defined period (default 200 days) to ensure comparability with the economic indicators.
Fetching and Normalizing Economic Data:
Instead of manually inputting economic values, the script uses TradingView’s security function to retrieve:
GDP from ticker "GDP"
Inflation (CPI) from ticker "USCCPI"
Unemployment rate from ticker "UNRATE"
Interest rates from ticker "USINTR"
Each series is normalized over a configurable normalization period (default 200 days) by subtracting its moving average and dividing by its standard deviation. This standardization converts each economic indicator into a z-score for direct integration into the momentum score.
Combined Momentum Score:
The normalized price momentum and economic indicators are each multiplied by user-defined weights (default: 50% price momentum, 20% GDP, and 10% each for inflation, unemployment, and interest rates). The weighted components are then summed to form a comprehensive momentum score. A horizontal zero line is plotted for reference.
Trading Signals:
Buy signals are generated when the combined momentum score crosses above zero, and sell signals occur when it crosses below zero. Visual markers are added to the chart to assist with trade timing, and alert conditions are provided for automated notifications.
Settings
Price Momentum Lookback: Defines the period (in days) used to compute the raw price momentum.
Normalization Period for Price Momentum: Sets the window over which the price momentum is normalized.
Normalization Period for Economic Data: Sets the window over which each macroeconomic series is normalized.
Weights: Adjust the influence of each component (price momentum, GDP, inflation, unemployment, and interest rate) on the overall momentum score.
Conclusion
This implementation leverages TradingView’s economic data feeds to integrate real-time macroeconomic data into a momentum trading strategy. By normalizing and weighting both technical and economic inputs, the indicator offers traders a more holistic view of market conditions. The enhanced momentum signal provides additional context to traditional momentum analysis, potentially leading to more informed trading decisions and improved risk management.
The next script I release will be an improved version of this that I have added my own flavor to, improving the signals.

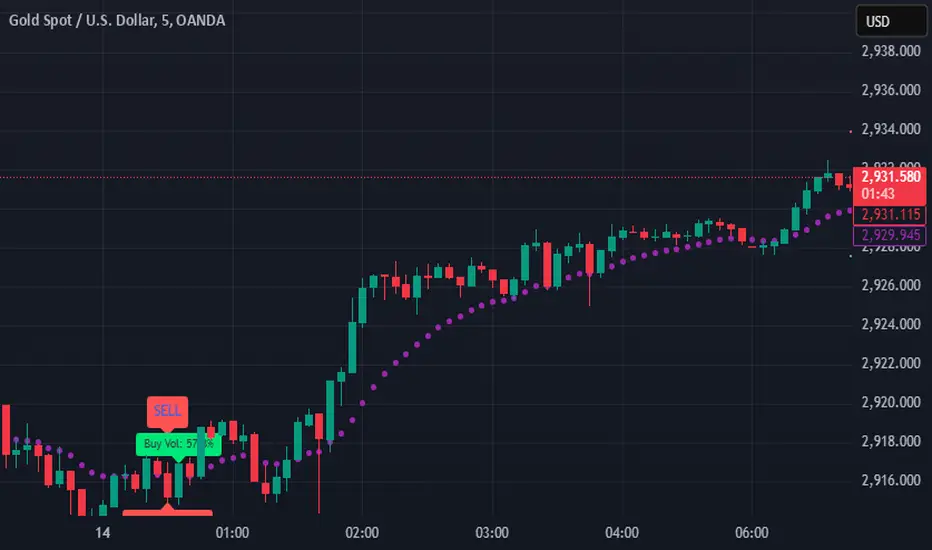
SIOVERSE EMA 15 with Buy/Sell Signals, Support & ResistanceThis Pine Script indicator is designed for TradingView and combines Exponential Moving Averages (EMAs), support and resistance levels, buy/sell signals, and volume percentage labels filtered by buy/sell conditions. It is a comprehensive tool for traders who want to analyze price trends, identify key levels, and make informed decisions based on volume and EMA crossovers.
Key Features of the Indicator
EMA 15 (Purple Dashed Line):
A 15-period Exponential Moving Average (EMA) is plotted on the chart as a dashed purple line.
This EMA helps traders identify short-term trends and potential entry/exit points.
Hidden EMA 21 and EMA 34:
The 21-period and 34-period EMAs are calculated but not displayed on the chart.
These EMAs are used to generate buy and sell signals based on crossovers.
Buy/Sell Signals:
Buy Signal: Occurs when the EMA 21 crosses above the EMA 34. A green "BUY" label is displayed below the candle.
Sell Signal: Occurs when the EMA 21 crosses below the EMA 34. A red "SELL" label is displayed above the candle.
These signals help traders identify potential trend reversals or continuations.
Support and Resistance Levels:
Support: The lowest price level over the last lookback_period candles, plotted as a green dashed horizontal line.
Resistance: The highest price level over the last lookback_period candles, plotted as a red dashed horizontal line.
These levels help traders identify key price zones for potential breakouts or reversals.
Volume Percentage Labels (Filtered by Buy/Sell Signals):
The volume percentage is calculated relative to the average volume over the last volume_lookback candles.
Buy Volume Label: When a buy signal occurs, a green label is displayed above the candle with the text "Buy Vol: X.XX%", where X.XX is the volume percentage.
Sell Volume Label: When a sell signal occurs, a red label is displayed below the candle with the text "Sell Vol: X.XX%", where X.XX is the volume percentage.
These labels help traders assess the strength of the buy/sell signals based on volume.
Alerts:
Alerts are triggered when buy or sell signals occur, notifying traders of potential trading opportunities.
Auto-Length Moving Average + Trend Signals (Zeiierman)█ Overview
The Auto-Length Moving Average + Trend Signals (Zeiierman) is an easy-to-use indicator designed to help traders dynamically adjust their moving average length based on market conditions. This tool adapts in real-time, expanding and contracting the moving average based on trend strength and momentum shifts.
The indicator smooths out price fluctuations by modifying its length while ensuring responsiveness to new trends. In addition to its adaptive length algorithm, it incorporates trend confirmation signals, helping traders identify potential trend reversals and continuations with greater confidence.
This indicator suits scalpers, swing traders, and trend-following investors who want a self-adjusting moving average that adapts to volatility, momentum, and price action dynamics.
█ How It Works
⚪ Dynamic Moving Average Length
The core feature of this indicator is its ability to automatically adjust the length of the moving average based on trend persistence and market conditions:
Expands in strong trends to reduce noise.
Contracts in choppy or reversing markets for faster reaction.
This allows for a more accurate moving average that aligns with current price dynamics.
⚪ Trend Confirmation & Signals
The indicator includes built-in trend detection logic, classifying trends based on market structure. It evaluates trend strength based on consecutive bars and smooths out transitions between bullish, bearish, and neutral conditions.
Uptrend: Price is persistently above the adjusted moving average.
Downtrend: Price remains below the adjusted moving average.
Neutral: Price fluctuates around the moving average, indicating possible consolidation.
⚪ Adaptive Trend Smoothing
A smoothing factor is applied to enhance trend readability while minimizing excessive lag. This balances reactivity with stability, making it easier to follow longer-term trends while avoiding false signals.
█ How to Use
⚪ Trend Identification
Bullish Trend: The indicator confirms an uptrend when the price consistently stays above the dynamically adjusted moving average.
Bearish Trend: A downtrend is recognized when the price remains below the moving average.
⚪ Trade Entry & Exit
Enter long when the dynamic moving average is green and a trend signal occurs. Exit when the price crosses below the dynamic moving average.
Enter short when the dynamic moving average is red and a trend signal occurs. Exit when the price crosses above the dynamic moving average.
█ Slope-Based Reset
This mode resets the trend counter when the moving average slope changes direction.
⚪ Interpretation & Insights
Best for trend-following traders who want to filter out noise and only reset when a clear shift in momentum occurs.
Higher slope length (N): More stable trends, fewer resets.
Lower slope length (N): More reactive to small price swings, frequent resets.
Useful in swing trading to track significant trend reversals.
█ RSI-Based Reset
The counter resets when the Relative Strength Index (RSI) crosses predefined overbought or oversold levels.
⚪ Interpretation & Insights
Best for reversal traders who look for extreme overbought/oversold conditions.
High RSI threshold (e.g., 80/20): Fewer resets, only extreme conditions trigger adjustments.
Lower RSI threshold (e.g., 60/40): More frequent resets, detecting smaller corrections.
Great for detecting exhaustion in trends before potential reversals.
█ Volume-Based Reset
A reset occurs when current volume significantly exceeds its moving average, signaling a shift in market participation.
⚪ Interpretation & Insights
Best for traders who follow institutional activity (high volume often means large players are active).
Higher volume SMA length: More stable trends, only resets on massive volume spikes.
Lower volume SMA length: More reactive to short-term volume shifts.
Useful in identifying breakout conditions and trend acceleration points.
█ Bollinger Band-Based Reset
A reset occurs when price closes above the upper Bollinger Band or below the lower Bollinger Band, signaling potential overextension.
⚪ Interpretation & Insights
Best for traders looking for volatility-based trend shifts.
Higher Bollinger Band multiplier (k = 2.5+): Captures only major price extremes.
Lower Bollinger Band multiplier (k = 1.5): Resets on moderate volatility changes.
Useful for detecting overextensions in strong trends before potential retracements.
█ MACD-Based Reset
A reset occurs when the MACD line crosses the signal line, indicating a momentum shift.
⚪ Interpretation & Insights
Best for momentum traders looking for trend continuation vs. exhaustion signals.
Longer MACD lengths (260, 120, 90): Captures major trend shifts.
Shorter MACD lengths (10, 5, 3): Reacts quickly to momentum changes.
Useful for detecting strong divergences and market shifts.
█ Stochastic-Based Reset
A reset occurs when Stochastic %K crosses overbought or oversold levels.
⚪ Interpretation & Insights
Best for short-term traders looking for fast momentum shifts.
Longer Stochastic length: Filters out false signals.
Shorter Stochastic length: Captures quick intraday shifts.
█ CCI-Based Reset
A reset occurs when the Commodity Channel Index (CCI) crosses predefined overbought or oversold levels. The CCI measures the price deviation from its statistical mean, making it a useful tool for detecting overextensions in price action.
⚪ Interpretation & Insights
Best for cycle traders who aim to identify overextended price deviations in trending or ranging markets.
Higher CCI threshold (e.g., ±200): Detects extreme overbought/oversold conditions before reversals.
Lower CCI threshold (e.g., ±10): More sensitive to trend shifts, useful for early signal detection.
Ideal for detecting momentum shifts before price reverts to its mean or continues trending strongly.
█ Momentum-Based Reset
A reset occurs when Momentum (Rate of Change) crosses zero, indicating a potential shift in price direction.
⚪ Interpretation & Insights
Best for trend-following traders who want to track acceleration vs. deceleration.
Higher momentum length: Captures longer-term shifts.
Lower momentum length: More responsive to short-term trend changes.
█ How to Interpret the Trend Strength Table
The Trend Strength Table provides valuable insights into the current market conditions by tracking how the dynamic moving average is adjusting based on trend persistence. Each metric in the table plays a role in understanding the strength, longevity, and stability of a trend.
⚪ Counter Value
Represents the current length of trend persistence before a reset occurs.
The higher the counter, the longer the current trend has been in place without resetting.
When this value reaches the Counter Break Threshold, the moving average resets and contracts to become more reactive.
Example:
A low counter value (e.g., 10) suggests a recent trend reset, meaning the market might be changing directions frequently.
A high counter value (e.g., 495) means the trend has been ongoing for a long time, indicating strong trend persistence.
⚪ Trend Strength
Measures how strong the current trend is based on the trend confirmation logic.
Higher values indicate stronger trends, while lower values suggest weaker trends or consolidations.
This value is dynamic and updates based on price action.
Example:
Trend Strength of 760 → Indicates a high-confidence trend.
Trend Strength of 50 → Suggests weak price action, possibly a choppy market.
⚪ Highest Trend Score
Tracks the strongest trend score recorded during the session.
Helps traders identify the most dominant trend observed in the timeframe.
This metric is useful for analyzing historical trend strength and comparing it with current conditions.
Example:
Highest Trend Score = 760 → Suggests that at some point, there was a strong trend in play.
If the current trend strength is much lower than this value, it could indicate trend exhaustion.
⚪ Average Trend Score
This is a rolling average of trend strength across the session.
Provides a bigger picture of how the trend strength fluctuates over time.
If the average trend score is high, the market has had persistent trends.
If it's low, the market may have been choppy or sideways.
Example:
Average Trend Score of 147 vs. Current Trend Strength of 760 → Indicates that the current trend is significantly stronger than the historical average, meaning a breakout might be occurring.
Average Trend Score of 700+ → Suggests a strong trending market overall.
█ Settings
⚪ Dynamic MA Controls
Base MA Length – Sets the starting length of the moving average before dynamic adjustments.
Max Dynamic Length – Defines the upper limit for how much the moving average can expand.
Trend Confirmation Length – The number of bars required to validate an uptrend or downtrend.
⚪ Reset & Adaptive Conditions
Reset Condition Type – Choose what triggers the moving average reset (Slope, RSI, Volume, MACD, etc.).
Trend Smoothing Factor – Adjusts how smoothly the moving average responds to price changes.
-----------------
Disclaimer
The content provided in my scripts, indicators, ideas, algorithms, and systems is for educational and informational purposes only. It does not constitute financial advice, investment recommendations, or a solicitation to buy or sell any financial instruments. I will not accept liability for any loss or damage, including without limitation any loss of profit, which may arise directly or indirectly from the use of or reliance on such information.
All investments involve risk, and the past performance of a security, industry, sector, market, financial product, trading strategy, backtest, or individual's trading does not guarantee future results or returns. Investors are fully responsible for any investment decisions they make. Such decisions should be based solely on an evaluation of their financial circumstances, investment objectives, risk tolerance, and liquidity needs.

Bollinger Bands Reversal Strategy Analyzer█ OVERVIEW
The Bollinger Bands Reversal Overlay is a versatile trading tool designed to help traders identify potential reversal opportunities using Bollinger Bands. It provides visual signals, performance metrics, and a detailed table to analyze the effectiveness of reversal-based strategies over a user-defined lookback period.
█ KEY FEATURES
Bollinger Bands Calculation
The indicator calculates the standard Bollinger Bands, consisting of:
A middle band (basis) as the Simple Moving Average (SMA) of the closing price.
An upper band as the basis plus a multiple of the standard deviation.
A lower band as the basis minus a multiple of the standard deviation.
Users can customize the length of the Bollinger Bands and the multiplier for the standard deviation.
Reversal Signals
The indicator identifies potential reversal signals based on the interaction between the price and the Bollinger Bands.
Two entry strategies are available:
Revert Cross: Waits for the price to close back above the lower band (for longs) or below the upper band (for shorts) after crossing it.
Cross Threshold: Triggers a signal as soon as the price crosses the lower band (for longs) or the upper band (for shorts).
Trade Direction
Users can select a trade bias:
Long: Focuses on bullish reversal signals.
Short: Focuses on bearish reversal signals.
Performance Metrics
The indicator calculates and displays the performance of trades over a user-defined lookback period ( barLookback ).
Metrics include:
Win Rate: The percentage of trades that were profitable.
Mean Return: The average return across all trades.
Median Return: The median return across all trades.
These metrics are calculated for each bar in the lookback period, providing insights into the strategy's performance over time.
Visual Signals
The indicator plots buy and sell signals on the chart:
Buy Signals: Displayed as green triangles below the price bars.
Sell Signals: Displayed as red triangles above the price bars.
Performance Table
A customizable table is displayed on the chart, showing the performance metrics for each bar in the lookback period.
The table includes:
Win Rate: Highlighted with gradient colors (green for high win rates, red for low win rates).
Mean Return: Colored based on profitability (green for positive returns, red for negative returns).
Median Return: Colored similarly to the mean return.
Time Filtering
Users can define a specific time window for the indicator to analyze trades, ensuring that performance metrics are calculated only for the desired period.
Customizable Display
The table's font size can be adjusted to suit the user's preference, with options for "Auto," "Small," "Normal," and "Large."
█ PURPOSE
The Bollinger Bands Reversal Overlay is designed to:
Help traders identify high-probability reversal opportunities using Bollinger Bands.
Provide actionable insights into the performance of reversal-based strategies.
Enable users to backtest and optimize their trading strategies by analyzing historical performance metrics.
█ IDEAL USERS
Swing Traders: Looking for reversal opportunities within a trend.
Mean Reversion Traders: Interested in trading price reversals to the mean.
Strategy Developers: Seeking to backtest and refine Bollinger Bands-based strategies.
Performance Analysts: Wanting to evaluate the effectiveness of reversal signals over time.

Buy Signal Forex & Crypto v0 ImprovedPurpose of the Script:
This script is designed to generate buy and sell signals for trading Forex and cryptocurrencies by analyzing price trends using exponential moving averages (EMAs), volatility, and volume filters. The signals are displayed as arrows on the chart.
What the Script Does
Input Settings:
The script allows the user to configure various settings, such as the lengths of EMAs, a higher timeframe for trend confirmation, and thresholds for volume and volatility (ATR - Average True Range).
Key settings:
5 EMA Length – Length of the short-term EMA.
13 EMA Length – Length of the medium-term EMA.
26 EMA Length – Length of the long-term EMA.
21 EMA Length – Used for trend confirmation on a higher timeframe.
Higher Timeframe – Lets you select a timeframe (e.g., daily) for confirming the overall trend.
ATR Threshold – Filters out signals when the market's volatility is too low.
Volume Filter – Ensures sufficient trading activity before generating signals.
Calculating EMAs (Exponential Moving Averages):
Four EMAs are calculated:
ema5 (short-term), ema13 (medium-term), ema26 (long-term), and ema21 (higher timeframe confirmation).
These EMAs help determine price trends and crossovers, which are critical for identifying buy and sell opportunities.
Trend Confirmation Using a Higher Timeframe:
The 21 EMA on the higher timeframe (e.g., daily) is used to confirm the overall direction of the market.
Defining Signal Conditions:
Buy Signal:
A buy signal is generated when:
ema5 crosses above ema13 (indicating a bullish trend).
ema5 crosses above ema26 (stronger bullish confirmation).
The closing price is above ema5, ema13, ema26, and the 21 EMA on the higher timeframe.
The market's volatility (ATR) is above the defined threshold.
The volume meets the conditions or volume filtering is disabled.
Sell Signal:
A sell signal is generated when:
ema5 crosses below ema13 (indicating a bearish trend).
ema5 crosses below ema26 (stronger bearish confirmation).
The closing price is below ema5, ema13, ema26, and the 21 EMA on the higher timeframe.
The market's volatility (ATR) is above the defined threshold.
The volume meets the conditions or volume filtering is disabled.
Volume Filtering:
Ensures there’s enough trading activity by comparing the current volume to a 20-period moving average of volume.
Persistent Variables:
These variables (crossed13 and crossed13Sell) help track whether the short-term EMA (ema5) has crossed the medium-term EMA (ema13). This prevents false or repeated signals.
Displaying Signals on the Chart:
Buy signals are displayed as green upward arrows below the price.
Sell signals are displayed as red downward arrows above the price.
How It Helps Traders:
This script provides visual cues for potential entry and exit points by combining moving average crossovers, volatility, volume, and higher timeframe trend confirmation. It works well for trending markets and ensures signals are filtered for stronger conditions to reduce noise.

ENIGMA Signals with Retests Select higher Time FrameENIGMA Signals with Retests – Script Description
The "ENIGMA Signals with Retests" script is a unique indicator designed for traders who prefer precision trading based on price action retests of key levels derived from higher timeframes. This tool is ideal for those employing multi-timeframe analysis strategies, helping them detect high-probability trade entries when the price interacts with significant support and resistance levels.
What Does This Script Do?
This indicator identifies key levels from a higher timeframe selected by the user (e.g., 4-hour or daily), then tracks price action on lower timeframes to provide actionable buy and sell signals when the price retests these levels. It visually plots the key levels on the chart and triggers alerts for potential trade opportunities when conditions are met.
How It Works
Key Level Detection:
The script uses custom functions to detect recent swing highs and swing lows on the selected higher timeframe (such as 4H or Daily). These levels represent potential areas of support and resistance where price reactions are likely to occur.
Multi-Timeframe Analysis:
The indicator leverages the request.security() function to retrieve price data from the user-defined higher timeframe and plots horizontal lines on the chart for the most recent swing highs and lows.
Retest-Based Signals:
Once the key levels are plotted, the script continuously monitors the price on the lower timeframe:
A Buy Signal is triggered when the price closes below a key high level and then moves back above it, indicating a potential bullish retest.
A Sell Signal is triggered when the price closes above a key low level and then moves back below it, indicating a potential bearish retest.
These retest signals are displayed as green and red arrows on the chart, helping traders identify optimal entry points.
Alerts for Retests:
The script includes built-in alert conditions that notify traders when a valid retest signal occurs. This allows traders to react promptly without constantly monitoring the chart.
How to Use the Script
Select Your Key Timeframe:
From the input settings, choose a higher timeframe that suits your trading style (e.g., 4H for intraday trading or Daily for swing trading).
Adjust Visual Preferences:
Customize the line style (solid, dashed, or dotted) and length of the plotted levels.
Toggle labels for the levels on or off as per your preference.
Trade Execution:
Once a retest signal appears on the lower timeframe, consider entering a trade in the direction of the signal. The buy signal suggests a potential long entry, while the sell signal indicates a potential short entry.
Set Alerts:
Use the alert conditions provided to get notified whenever a valid retest occurs. This helps in reducing screen time and improving trading efficiency.
Underlying Concepts
This script is grounded in the principles of support and resistance, retests, and breakout trading. By focusing on multi-timeframe key levels, it aligns with widely used trading concepts like:
Breakout and Retest: Entering trades after a confirmed breakout and successful retest of a significant level.
Swing Highs and Lows: Recognizing swing points to identify strong price reaction zones.
Multi-Timeframe Confluence: Enhancing trade probability by ensuring that the signals on lower timeframes correspond with key levels from higher timeframes.
Why This Script Is Unique
Unlike many generic trend-following or scalping indicators, "ENIGMA Signals with Retests" offers:
Precision Signals: It only provides signals when specific retest conditions are met, reducing false signals and noise.
Multi-Timeframe Customization: Users can tailor the higher timeframe to their strategy, making it versatile for various trading styles.
Alert Functionality: Alerts are integrated, allowing traders to stay updated without constantly monitoring the charts.
This script is perfect for traders looking for a systematic way to trade retests of key levels across multiple timeframes. Whether you're a scalper, day trader, or swing trader, "ENIGMA Signals with Retests" can help improve your precision and timing in the market.
