Bayesian Trend Indicator [ChartPrime]Bayesian Trend Indicator
Overview:
In probability theory and statistics, Bayes' theorem (alternatively Bayes' law or Bayes' rule), named after Thomas Bayes, describes the probability of an event, based on prior knowledge of conditions that might be related to the event.
The "Bayesian Trend Indicator" is a sophisticated technical analysis tool designed to assess the direction of price trends in financial markets. It combines the principles of Bayesian probability theory with moving average analysis to provide traders with a comprehensive understanding of market sentiment and potential trend reversals.
At its core, the indicator utilizes multiple moving averages, including the Exponential Moving Average (EMA), Simple Moving Average (SMA), Double Exponential Moving Average (DEMA), and Volume Weighted Moving Average (VWMA) . These moving averages are calculated based on user-defined parameters such as length and gap length, allowing traders to customize the indicator to suit their trading strategies and preferences.
The indicator begins by calculating the trend for both fast and slow moving averages using a Smoothed Gradient Signal Function. This function assigns a numerical value to each data point based on its relationship with historical data, indicating the strength and direction of the trend.
// Smoothed Gradient Signal Function
sig(float src, gap)=>
ta.ema(source >= src ? 1 :
source >= src ? 0.9 :
source >= src ? 0.8 :
source >= src ? 0.7 :
source >= src ? 0.6 :
source >= src ? 0.5 :
source >= src ? 0.4 :
source >= src ? 0.3 :
source >= src ? 0.2 :
source >= src ? 0.1 :
0, 4)
Next, the indicator calculates prior probabilities using the trend information from the slow moving averages and likelihood probabilities using the trend information from the fast moving averages . These probabilities represent the likelihood of an uptrend or downtrend based on historical data.
// Define prior probabilities using moving averages
prior_up = (ema_trend + sma_trend + dema_trend + vwma_trend) / 4
prior_down = 1 - prior_up
// Define likelihoods using faster moving averages
likelihood_up = (ema_trend_fast + sma_trend_fast + dema_trend_fast + vwma_trend_fast) / 4
likelihood_down = 1 - likelihood_up
Using Bayes' theorem , the indicator then combines the prior and likelihood probabilities to calculate posterior probabilities, which reflect the updated probability of an uptrend or downtrend given the current market conditions. These posterior probabilities serve as a key signal for traders, informing them about the prevailing market sentiment and potential trend reversals.
// Calculate posterior probabilities using Bayes' theorem
posterior_up = prior_up * likelihood_up
/
(prior_up * likelihood_up + prior_down * likelihood_down)
Key Features:
◆ The trend direction:
To visually represent the trend direction , the indicator colors the bars on the chart based on the posterior probabilities. Bars are colored green to indicate an uptrend when the posterior probability is greater than 0.5 (>50%), while bars are colored red to indicate a downtrend when the posterior probability is less than 0.5 (<50%).
◆ Dashboard on the chart
Additionally, the indicator displays a dashboard on the chart , providing traders with detailed information about the probability of an uptrend , as well as the trends for each type of moving average. This dashboard serves as a valuable reference for traders to monitor trend strength and make informed trading decisions.
◆ Probability labels and signals:
Furthermore, the indicator includes probability labels and signals , which are displayed near the corresponding bars on the chart. These labels indicate the posterior probability of a trend, while small diamonds above or below bars indicate crossover or crossunder events when the posterior probability crosses the 0.5 threshold (50%).
The posterior probability of a trend
Crossover or Crossunder events
◆ User Inputs
Source:
Description: Defines the price source for the indicator's calculations. Users can select between different price values like close, open, high, low, etc.
MA's Length:
Description: Sets the length for the moving averages used in the trend calculations. A larger length will smooth out the moving averages, making the indicator less sensitive to short-term fluctuations.
Gap Length Between Fast and Slow MA's:
Description: Determines the difference in lengths between the slow and fast moving averages. A higher gap length will increase the difference, potentially identifying stronger trend signals.
Gap Signals:
Description: Defines the gap used for the smoothed gradient signal function. This parameter affects the sensitivity of the trend signals by setting the number of bars used in the signal calculations.
In summary, the "Bayesian Trend Indicator" is a powerful tool that leverages Bayesian probability theory and moving average analysis to help traders identify trend direction, assess market sentiment, and make informed trading decisions in various financial markets.
Tìm kiếm tập lệnh với "signal"

Moving Average Momentum SignalsBest for trade execution in lower timeframe (1m,5m,15m) with momentum confirmation in higher timeframes (2h,4h,1d)
This indicator relies on three key conditions to determine buy and sell signals: the price's deviation from a short-term moving average, the change in the moving average over time (past 10 candles), and the price's deviation from a historical price (40 candles). The strategy aims to target moments where the asset's price is likely to experience a reversal or momentum shift.
Conditions
Price deviation from short-term Moving Average (MA): Current candle close minus the 10-period MA (price action past 10 candles)
Change in Moving Average over time: Current 10-period MA minus the 10-period MA from 10 candles ago (price action past 20 candles)
Price deviation from historical price: Current close minus the close from 40 candles ago (price action past 40 candles)
Signal Generation Logic
Buy Signal: Triggered when all three conditions are positive. Confirmed if the previous signal was a sell or if there were no previous signals
Sell Signal: Triggered when all three conditions are negative. Confirmed if the previous signal was a buy or if there were no previous signals
Usage and Strategy
After back testing, I observed the higher timeframes were a good indication of momentum/sentiment that you can take note of while trading intraday on the lower time frames (time intervals stated above). Background highlights are also displayed for easier visualization of bullish/bearish skew in terms of the volume of signals generated.

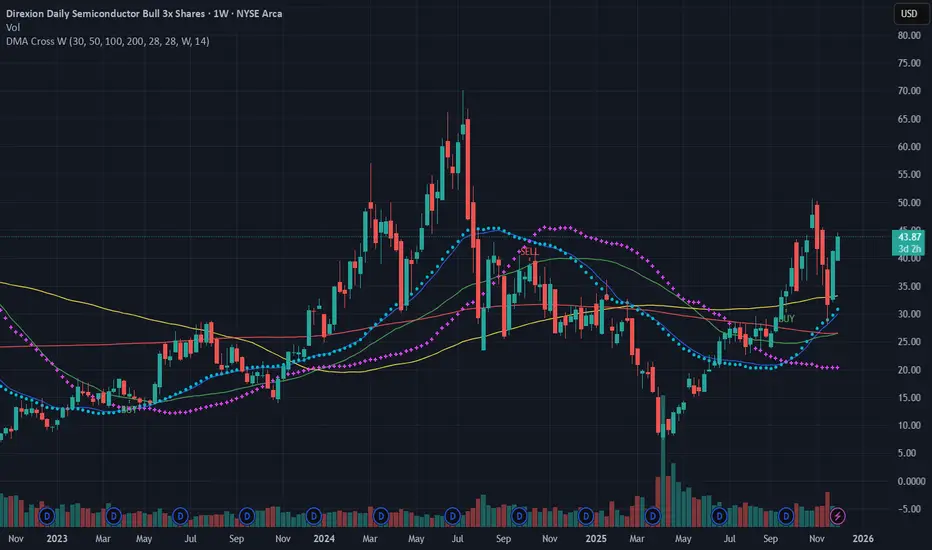
SMA DMA Crossing SignalSMA and DMA Crossing Buy Sell Signals
This script implements a Double Moving Average (DMA) strategy, a popular technical analysis technique used by traders to identify trends and potential buy/sell signals in financial markets.
**Description:**
The Double Moving Average strategy involves the calculation of two moving averages – a short-term moving average and a long-term moving average. In this script, we calculate these moving averages as follows:
1. **Short-term DMA (`dmaShort`):**
- Calculated using a 28-bar Simple Moving Average (SMA).
- Represents the shorter-term trend in the price movement.
2. **Long-term DMA (`dmaLong`):**
- Also calculated using a 28-bar SMA.
- Displaced backward by 14 bars (`dmaLong := request.security(syminfo.tickerid, "D", dmaLong )`), effectively creating a 28-bar SMA with a -14 bar displacement.
- Represents the longer-term trend in the price movement.
**Signals:**
Buy and sell signals are generated based on the crossing of the short-term DMA over or under the long-term DMA:
- **Buy Signal (`DMA BUY`):** Occurs when the short-term DMA crosses above the long-term DMA (`dmaBuySignal`).
- **Sell Signal (`DMA SELL`):** Occurs when the short-term DMA crosses below the long-term DMA (`dmaSellSignal`).
**How to Use:**
- **Buy Signal:** Consider entering a long position when the short-term DMA crosses above the long-term DMA, indicating a potential uptrend.
- **Sell Signal:** Consider exiting a long position or entering a short position when the short-term DMA crosses below the long-term DMA, indicating a potential downtrend.
This script provides a visual representation of the DMA crossover signals on the chart, helping traders identify potential entry and exit points in the market.
**Note:** It's important to combine DMA signals with other technical analysis tools and risk management strategies for informed trading decisions.
All comments are welcome..
Hull AMA SignalsThis script is a comprehensive trading indicator named "Hull AMA Signals", which combines AMA and HSO by LuxAlgo and ther video based strategy techniques to provide buy (long) and sell (short) signals. It overlays directly on the price chart, offering a dynamic and visually intuitive trading aid. The core components of this indicator are Adaptive Moving Averages (AMA), Hull Moving Average (HMA), and a unique Hull squeeze oscillator (HSO), each configured with customizable parameters for flexibility and adaptability to various market conditions.
Features and Components
Adaptive Moving Averages (AMA): This indicator employs two sets of AMAs, each with distinct lengths, multipliers, lags, and overshoot parameters. The AMAs are designed to adapt their sensitivity based on the market's volatility, making them more responsive during significant price movements and less prone to false signals during periods of consolidation.
Hull Moving Average (HMA): The HMA is calculated using a sophisticated algorithm that aims to reduce the lag commonly associated with traditional moving averages. It provides a smoother and more responsive moving average line, which helps in identifying the prevailing market trend more accurately.
Hull Squeeze Oscillator (HSO): A novel component of this indicator, the HSO, is designed to identify potential market breakouts. It does so by comparing the Hull Moving Average's direction and momentum against a dynamically calculated mean, generating bullish or bearish signals based on the crossover and divergence from this mean.
Buy (Long) and Sell (Short) Signals: The script intelligently combines signals from the AMA crossovers and the Hull squeeze oscillator to pinpoint potential buy and sell opportunities. Bullish signals are generated when there's a positive crossover in the AMAs accompanied by a bullish dot from the HSO, whereas bearish signals are indicated by a negative crossover in the AMAs along with a bearish dot from the HSO.
Customization and Style Options: Users have the ability to adjust various parameters such as the length of the moving averages, multipliers, and source data, enabling customization for different trading strategies and asset classes. Additionally, color-coded visual elements like gradients and shapes enhance the readability and instant recognition of trading signals.
Use Cases
Trend Identification: By analyzing the direction and position of the AMAs and HMA, traders can easily discern the prevailing market trend, helping them to align their trades with the market momentum.
Signal Confirmation: The combination of AMA crossovers and HSO signals provides a robust framework for confirming trade entries and exits, potentially increasing the reliability of the trading signals.
Volatility Adaptation: The adaptive nature of the AMAs and the dynamic calculation of the HSO mean allow this indicator to adjust to changing market volatility, making it suitable for a wide range of market environments.
This indicator is suitable for traders looking for a comprehensive and dynamic technical analysis tool that combines trend analysis with signal generation, offering both visual appeal and practical trading utility.

ASFX SignalsDescription:
The ASFX Signals Indicator, created by OmegaTools, is an open-source Pine Script™ code designed to provide traders with valuable signals for potential entry and exit points in the market. This script incorporates a combination of Exponential Moving Average (EMA) signals and Volume Weighted Average Price (VWAP) confluence, enhancing the precision of trading decisions.
Key Features:
Threshold Configuration: Users can customize the threshold parameter (thres) to fine-tune signal sensitivity, adapting the indicator to different market conditions.
EMA Length Customization: The script allows traders to adjust the length of the Exponential Moving Average (EMA) with the "EMA Length" input, providing flexibility in capturing various trends.
Show/Hide Options: Users have the flexibility to choose whether to display the EMA line, VWAP confluence, and VWAP upper and lower bands, tailoring the visual representation based on individual preferences.
VWAP Confluence: The indicator integrates VWAP confluence, offering additional confirmation for trading signals. Traders can choose the VWAP resolution and set the deviation parameter for enhanced accuracy.
Signal Filtering: The script intelligently filters signals based on the percentage of the candle that crosses the EMA. Long signals are filtered out if the closing price is above the VWAP or the specified threshold, and short signals are filtered out if the closing price is below the VWAP or the threshold.
Visual Signals: The indicator provides clear visual signals for long and short entries, making it easy for traders to identify potential opportunities. The signals are accompanied by arrows and labels for quick interpretation.
How to Use:
Adjust the threshold, EMA length, and VWAP parameters based on your trading preferences.
Choose whether to display the EMA line, VWAP confluence, and upper/lower bands.
Interpret long and short signals for potential entry and exit points, considering the percentage of the candle that crosses the EMA.
Consider additional confirmation provided by VWAP confluence.
Concepts and Methodology:
The ASFX Signals Indicator combines EMA signals and VWAP confluence to generate actionable trading signals. The script intelligently considers the percentage of the candle that crosses the EMA, providing a nuanced approach to signal confirmation. The EMA offers trend insights, while VWAP confluence enhances signal reliability.

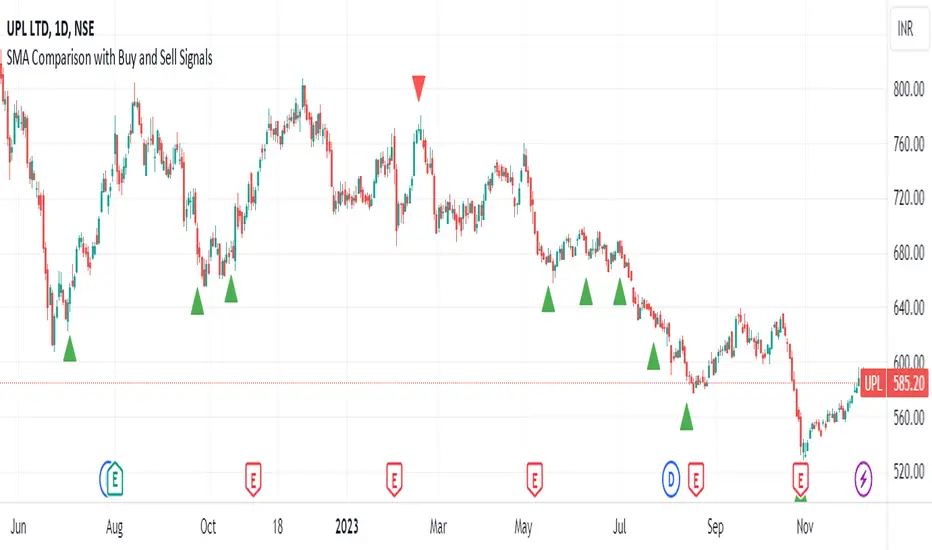
SMA Comparison with Buy and Sell Signals ShrutIndicator Name: SMA Comparison with Buy and Sell Signals
Overlay: Enabled (Indicator is displayed on the main price chart)
Description:
The "SMA Comparison with Buy and Sell Signals" indicator is designed to identify potential buying and selling opportunities in a financial instrument by comparing three Simple Moving Averages (SMAs) – the 20-day SMA, 50-day SMA, and 200-day SMA.
Features:
Simple Moving Averages (SMAs):
Calculates and displays three SMAs based on the closing price: SMA-20, SMA-50, and SMA-200.
Buy and Sell Conditions:
Buy Condition : Triggered when the 200-day SMA is greater than the 50-day SMA, the 50-day SMA is greater than the 20-day SMA, and the current closing price is lower than the 20-day SMA.
Sell Condition: Triggered when the 200-day SMA is less than the 50-day SMA, the 50-day SMA is less than the 20-day SMA, and the current closing price is higher than the 20-day SMA.
Signal Generation:
Generates buy and sell signals on the chart based on the identified conditions.
Implements a 15-day cooldown period between consecutive buy or sell signals to prevent frequent signals in volatile market conditions.
Signal Display:
Displays buy signals as green triangle shapes below the price bars.
Displays sell signals as red triangle shapes above the price bars.
Usage:
Buy Signals: Considered when the green triangle shapes (buy signals) appear below the price bars, indicating a potential buying opportunity based on the defined SMA conditions.
Sell Signals: Considered when the red triangle shapes (sell signals) appear above the price bars, indicating a potential selling opportunity based on the defined SMA conditions.
Notes:
This indicator is customizable and can be adjusted by modifying the conditions based on specific trading strategies and preferences.
Traders should consider additional analysis and risk management strategies before making trading decisions based solely on the indicator signals.
Breakout/Breakdown Indicator (30 Min Range) by InvestYourAsset👉The indicator provided here is a technical analysis indicator for TradingView users that identifies potential breakout and breakdown opportunities on the initial 30-minute range in every trading session.
👉The indicator high and low of the initial 30-minute period and plotting them as horizontal lines on the chart. The high is marked in green line and the low is marked in red line.
📈The indicator then generates buy and sell signals based on whether the current close price crosses above or below the previous 30-minute high and low, respectively.
📢The indicator also has two inputs:
👉 sessionStartHour : The hour at which the trading session begins. The default value is 9, However users can change the time according to their own trading style.
👉 sessionStartMinute : The minute at which the trading session begins. The default value is 0.
These inputs can be used to adjust the indicator to the specific trading session that you are interested in.
✅How to use the Indicator:
👉To use the 30 Minute Breakout/Breakdown Indicator, simply add it to your chart and configure the inputs to your liking. Once the indicator is added to the chart, it will plot the 30-minute high and low as horizontal lines, as well as generate buy and sell signals based on the current close price.
✅Here is a step-by-step guide:
📈Open TradingView and select the chart that you want to add the indicator to.
📈Click on the "Indicators" tab and search for "30 Minute Breakout/Breakdown Indicator by InvestYourAsset".
📈Click on the indicator to add it to your chart.
📈Configure the inputs to your liking. The default values are typically fine, but you can experiment with different values to see what works best for you.
📈Once you are satisfied with the settings, click on the "Apply" button.
📈The indicator will now be displayed on your chart. You will see two horizontal lines representing the previous 30-minute high and low, as well as triangles representing buy and sell signals.
✅How to interpret the signals:
📈Buy signal : A buy signal is generated when the current close price crosses above the previous 30-minute high. This suggests that the price is likely to continue moving higher in the short term.
📈Sell signal : A sell signal is generated when the current close price crosses below the previous 30-minute low. This suggests that the price is likely to continue moving lower in the short term.
👉Traders should remember that the present indicator is just one tool that can be used to identify potential trading opportunities. It is important to use other technical analysis tools and risk management techniques to confirm your trading signals before entering any trades.
✅Things to consider while using the indicator:
📈Look for buy signals in an uptrend and sell signals in a downtrend. This will increase the likelihood of your trades being successful.
📈Place your stop losses below the previous 30-minute low for buy signals and above the previous 30-minute high for sell signals. This will help to limit your losses if the trade goes against you.
📈Consider taking profits at key resistance and support levels. This will help you to lock in your profits and avoid giving them back to the market.
Follow us for timely updates regarding indicators that we may publish in future and give it a like if you appreciate the indicator.

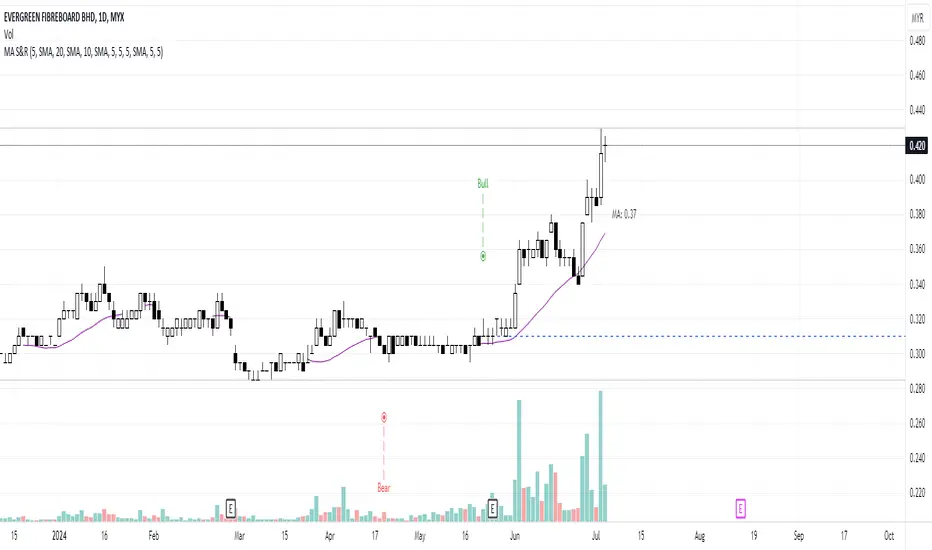
MA Support & Resistance SignalThis indicator is to show MA Support/Resistance and trend of a stock.
It contains three (3) Moving Averages that can be set to SMA or EMA:
1. Upper Line : SMA 5 (default)
2. Lower Line : SMA 20 (default)
3. Support/Resistance Line : SMA 10 (default)
Other signals:
1. Bull and Blue Dotted Line signal: Upper Line (SMA 5) crossover with Lower Line (SMA 20).
2. Bear and Red Dotted Line signal: Lower Line (SMA 20) crossover with Upper Line (SMA 5).
3. Red Triangle signal: Price closes below Support/Resistance Line (SMA 10).
4. Green Bar signal: Price breaks Support/Resistance Line (SMA 10).
The way how I use it:
- Since I don't like my chart to be crowded with a lot of moving averages, I will disable SMA 5 and SMA 10 and will only leave SMA 20 as my final support line.
- Entry when only:
1. Bull signal appeared.
2. Green bar appeared, or;
3. Price rebound on SMA 20.
I let the script open so that you guys can custom it based on your own preferences. Hope you guys enjoy it.
Enhanced Strategy (Buy/Sell Signals)The provided script is an enhanced strategy that combines multiple indicators to generate buy and sell signals. Here's a breakdown of its features and usage:
Indicators used:
1. Moving Averages (MA): It uses two moving averages, fast and slow, to identify trend direction.
2. Relative Strength Index (RSI): It measures the momentum and overbought/oversold conditions of the asset.
3. Moving Average Convergence Divergence (MACD): It indicates trend direction and potential trend reversals.
4. Stochastic Momentum Index (Stch Mtm): It identifies overbought and oversold conditions and potential reversals.
5. Awesome Oscillator: It helps to gauge the market momentum and potential trend changes.
How to use:
1. The strategy is designed to be used as a study on the TradingView platform.
2. Apply the script to your preferred chart and adjust the input parameters as desired.
3. The buy and sell signals will be plotted as green "Buy" and red "Sell" labels on the chart.
4. You can also observe the plotted indicators to gain insights into the market conditions.
Combination of indicators:
1. Buy Signal: The strategy generates a buy signal when the following conditions are met:
- The fast moving average crosses over the slow moving average (bullish crossover).
- RSI value is above the specified threshold (30 by default), indicating potential oversold conditions.
- MACD line is above the signal line, suggesting a bullish trend.
- Stch Mtm is above 50, indicating bullish momentum.
- The Awesome Oscillator is positive, implying bullish market sentiment.
2. Sell Signal: The strategy generates a sell signal when the following conditions are met:
- The fast moving average crosses under the slow moving average (bearish crossover).
- RSI value is below the specified threshold (100 - RSI threshold), indicating potential overbought conditions.
- MACD line is below the signal line, suggesting a bearish trend.
- Stch Mtm is below 50, indicating bearish momentum.
- The Awesome Oscillator is negative, implying bearish market sentiment.
Market conditions:
- The strategy aims to identify potential entry and exit points based on the combination of indicators.
- It can be used in various market conditions, but it's important to consider the overall market context, news events, and risk management principles.
- It's recommended to use this strategy as a tool for analysis and decision-making, and validate the signals with additional analysis before executing trades.
Please note that the effectiveness and profitability of any trading strategy can vary depending on various factors, including market conditions and individual trading preferences. It's always advisable to conduct thorough backtesting and consider risk management techniques before applying any strategy to live trading.

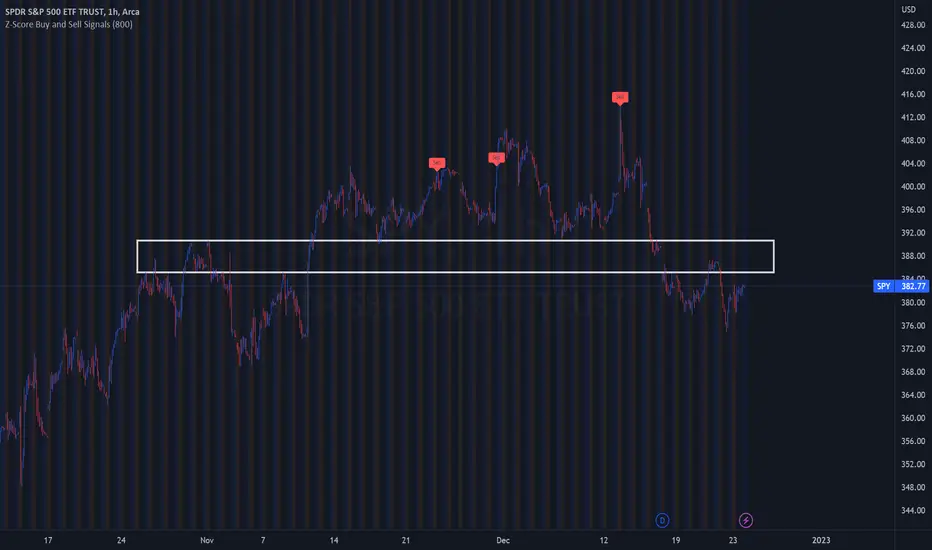
Z-Score Buy and Sell SignalsHello everyone!
Happy Holidays, Merry/Happy Christmas!
Here is my Christmas gift to you to show my appreciation of your support and engagement over the past year!
This is the Z-Score Buy and Sell Signal indicator!
How it works:
It works by looking at the Z-Score of an equities close price and looking for previous areas over reversals over the defined period of time.
It also looks at areas that are overbought or oversold (manifested by Z-Scores greater than or less than 2 Standard Deviations away) and displays them as bar colour changes.
Historic reversals are signaled with buy and/or sell signals.
Oversold is signaled with a green bar colour change (colour can be customaized).
Overbought is signaled with an orange bar colour change.
How to use it:
You can use it with support resistance or other indicators. You can use this on both the larger and small timeframes, depending on the style of trader you are.
You can modify the input length to look back on shorter or longer periods.
As a general rule from my experience using it, if you are using the shorter timeframes (i.e. 1 minute tfs), its best to look back between 50 and 75 candles for most equities.
If you are looking at the larger timeframes (i.e. Daily, 1 to 2 hour, etc.) its best to set the input value to between 500 to 800.
But, as always, you should check to ensure the indicator is providing correct signals by reviewing the previous signals to ensure that they adequate identified reversals.
It is also best not to use this alone as your sole indicator. It is meant to be supplementary to other indicators/support resistance/chart patterns you are using to guide your trades. This will not replace good TA and a good understand of the stock and its likely trajectory.
As always, please feel free to share your comments/feedback/questions and recommendations below.
As always, I do customary tutorial videos for my indicators, so please see below for an in-depth video tutorial should you want to see it in action:
Otherwise, happy holidays everyone! And all of the best over this Christmas weekend to you and your loved ones!
Filtered TEMA CrossoverFiltered Dual TEMA Crossover
This indicator is a trend-following tool based on the classic Dual Triple Exponential Moving Average (TEMA) Crossover strategy, enhanced with two robust filters: the Chop Index and the Average Directional Index (ADX).
The TEMA is known for its low lag and high responsiveness, making the crossover an effective signal for trend reversals. However, trading TEMA crossovers during sideways, choppy markets often leads to false signals. This is where the filters come in.
Key Features
▪️Dual TEMA Crossover: Plots two customizable TEMA lines (Fast and Slow) for clear visualization of the primary trend direction.
▪️Intelligent Signal Filtering: Buy and Sell signals are generated only when the market confirms it is in a trending state, thanks to two integrated filters:
➖Chop Index Filter: Blocks signals when the market is detected as sideways or consolidating (Chop Index reading above a user-defined threshold).
➖ADX Filter: Ensures signals are only taken when the trend strength is sufficient (ADX reading above a user-defined minimum threshold).
▪️Customizable Signals: Full control over the signal shapes (Arrows, Triangles, etc.), colors, text, and size.
How to Use It
Use the Filtered Dual TEMA Crossover to enter positions on trend continuation or reversal while dramatically reducing exposure to low-quality, whipsawing signals common in non-trending environments.
Before the filters:
After the filters:
Minimize Noise. Maximize Clarity. Trade the Trend.

Setup Keltner BandS MMS + RSI SIGNALS
📊 Keltner Bands with RSI Confirmation – TradingView Script
Introduction
This script combines Keltner Channel logic with Relative Strength Index (RSI) confirmation to provide traders with visual signals and alerts for potential reversals. It is designed for scalping and short-term trading strategies, where precision and quick decision-making are essential.
🔧 How It Works
• Keltner Bands (ATR-based):
• Two sets of bands are plotted around a moving average:
• Band 3 (ATR × 3) – more sensitive, suitable for aggressive entries.
• Band 5 (ATR × 5) – wider, used as a filter or confirmation zone.
• Signals are generated when the price crosses back inside the bands from outside.
• RSI Confirmation:
• RSI is calculated with a customizable period (default: 14).
• Overbought and oversold levels (default: 70/30) are used to filter signals.
• A bearish reversal is confirmed only if RSI is above the overbought level.
• A bullish reversal is confirmed only if RSI is below the oversold level.
📌 Functions and Features
• Visual Signals:
• Triangles plotted above/below candles for Keltner-only signals.
• Additional colored triangles for Keltner + RSI confirmed signals.
• Alerts:
• Configurable alerts for both Keltner-only and RSI-confirmed conditions.
• Messages include the type of reversal and the band level.
• Customizable Parameters:
• Moving average length.
• ATR multipliers (3 and 5).
• RSI length and thresholds.
• Colors for band fills and signals.
🎯 Usage
1. Apply the script to your chart in TradingView.
2. Adjust parameters to fit your trading style (scalping, intraday, swing).
3. Watch for signals:
• Red/green/orange/teal triangles → Keltner-only reversals.
• Maroon/lime/purple/blue triangles → RSI-confirmed reversals.
4. Set alerts to receive notifications when conditions are met.
5. Use RSI confirmation to filter out false signals and increase accuracy.
✅ Benefits
• Clear visualization of reversal zones.
• Dual-layer confirmation (Keltner + RSI).
• Flexible for different timeframes and trading styles.
• Ready-to-use alerts for automation or manual trading.

ONLY LONG – 4H Breakout → 1H EMA(12/21) [Signals]🔹 ONLY LONG – 4H Breakout → 1H EMA(12/21)
Author: SystemsOverFeelings
Type: Signal-only indicator (non-repainting)
Timeframe: Designed for the 1H chart
Markets: BTCUSDT perpetual& major pairs
📖 Concept
A high-timeframe confirmation model for trend-continuation longs.
It detects:
A 4-Hour breakout candle closing above recent range highs,
With very-high volume confirmation, and
Then waits for a 1-Hour pullback into the EMA(12/21) band or a Break of Structure (BOS) to re-enter.
No repainting — all 4H logic uses request.security(..., lookahead_off) for confirmed data.
🧩 Signal Logic
✅ 4H Trigger: Breakout candle with volume > SMA(20) × user multiplier.
✅ Armed Regime: Green background = system ready for 1H entries.
🟢 LONG Signal: 1H candle consolidates inside or touches the EMA band, or shows BOS confirmation.
❌ EXIT Signal: 4H EMA(12) crosses below EMA(21).
All signals are visually marked and alert-ready.
⚙️ Adjustable Parameters
4H volume multiplier
Range lookback days
Pullback strictness (inside/touch)
1H BOS pivot length & mode
Expiry time for invalidated setups
🔔 Alerts
Built-in alerts for:
4H breakout trigger
1H long entry signal
4H band exit
Use them directly via “Create Alert → Condition → This Script → Choose Signal.”
💡 Notes
Works best on BTC/ETH 1H chart.
Non-repainting, multi-timeframe logic.
Use for directional bias or entry timing — not financial advice.

NOVA Breakout Signals v2.2 (TF M30)A clean, rules-based breakout signal tool for 30-minute charts.
It detects Dow swing breakouts and filters them with RSI, MACD and Volume so you only see the higher-quality entries. The script does not place trades and does not calculate SL/TP – it only prints clear LONG/SHORT labels at the entry price.
⸻
How it works
1. Timeframe enforcement – Signals are generated only on M30. On other timeframes the script shows a notice and stays silent.
2. Breakout engine (Dow swings) – The last confirmed swing high/low (pivots) is tracked.
• Breakout Up: bar closes above the last swing high by a small buffer.
• Breakout Down: bar closes below the last swing low by a small buffer.
3. Quality filters (all must be true):
• RSI (default length 30):
• Long: RSI > threshold and rising.
• Short: RSI < threshold and falling.
• MACD (12/26/9):
• Long: histogram > 0 and line > signal.
• Short: histogram < 0 and line < signal.
• Volume: current volume > SMA(volume, 20) × multiplier.
4. Debounce / anti-spam
• Cooldown of 4 hours (8 M30 bars) after any signal.
• Minimum price distance from the previous signal to avoid clustered labels.
Signals appear once the bar closes (barstate.isconfirmed). No swing lines are drawn to keep the chart clean; only entry labels are shown.
⸻
Inputs (key)
• RSI length & thresholds for Long/Short confirmation.
• MACD uses 12/26/9 (fixed).
• Volume multiplier (relative to SMA 20).
• Breakout buffer %, Cooldown hours, Min distance %.
• Show labels (on/off).
⸻
Usage tips
• Start with gold/major FX/indices on M30; use “Once per bar close” if you attach alerts.
• Increase the breakout buffer and volume multiplier in choppy markets.
• Tighten RSI thresholds (e.g., 55/45) if you want fewer but stronger signals.
⸻
Notes & limitations
• Pivots confirm after a few bars by definition; signals themselves are printed only on confirmed bar close and do not repaint once shown.
• This is a signal indicator, not investment advice. Always manage risk.

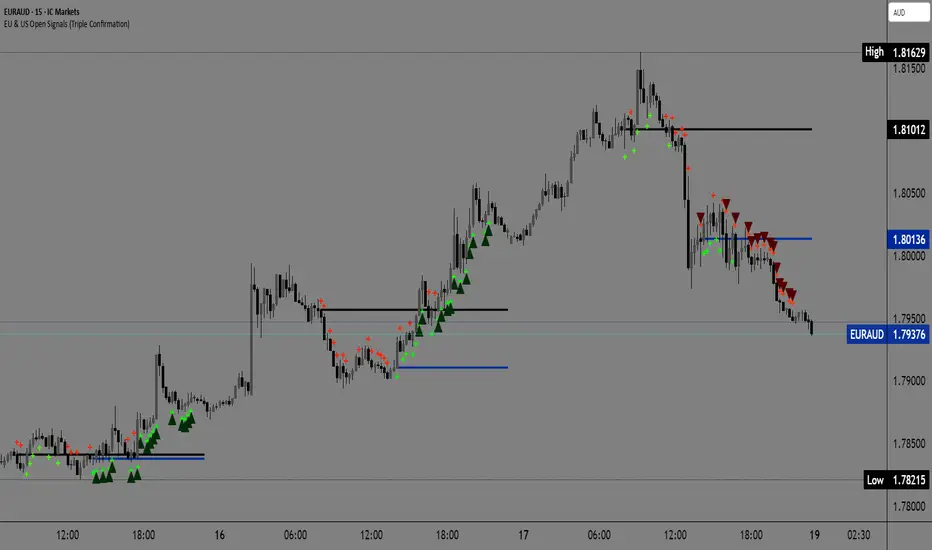
EU & US Open Signals (Triple Confirmation)🚀 EU & US Open Signals: Triple Confirmation Breakouts
💡 What This Indicator Does
This indicator plots the opening prices of the European (EU) and American (US) trading sessions as key daily support/resistance levels. Its main function is to generate three distinct levels of signals based on the breakout of these levels, strictly filtered by candlestick type.
The goal is to easily spot market momentum following the opening of the major trading sessions.
🔑 Key Features
1. Daily Session Levels
The indicator plots two crucial horizontal lines that reset daily:
EU Open (Black Line): The European session opening price (Default: 06:00 UTC).
US Open (Dark Blue Line): The American session opening price (Default: 12:00 UTC).
2. Triple Signaling Logic
All signals are only generated if the breakout candle is bullish (for Buy) or bearish (for Sell), and only within your set trading hours.
Logic I. EU Single Break
Condition: Close breaks above/below the EU Open Level + Bullish/Bearish candle.
Visual Plot: Small Cross (Green for Buy / Red for Sell).
Meaning: Early signal focused on EU session momentum.
Logic II. US Single Break
Condition: Close breaks above/below the US Open Level + Bullish/Bearish candle.
Visual Plot: Small Cross (Green for Buy / Red for Sell).
Meaning: Signal focused on US session momentum.
Logic III. Double Break (HIGH CONFIRMATION)
Condition: Close breaks above Both Levels (EU and US) for Buy, or below Both Levels for Sell + Bullish/Bearish candle.
Visual Plot: Large Triangle (Dark Green/Red).
⚠️ Crucial: This is the strongest signal, indicating strong momentum as both key daily levels have been broken.
⚙️ Simple Settings
Easily customize the indicator to fit your strategy:
EU/US Session Open Hour (UTC): Set the exact session open times.
Time Zone: Select your time zone for accurate level calculation.
Start/End Trading Hour: Define the daily window for when signals will be active.
🎯 Recommended Use
High Confidence: Focus on the Double Break (Logic III) - Large Triangle for your most confirmed entries.
Context: Use the Single Break signals (I and II) to confirm early market bias.
Risk: The Open Levels can serve as natural points for setting Stop-Loss orders.
Disclaimer: Trading carries risk. This tool is for analysis purposes only. Use it at your own discretion.
Buy Sell Signals MKSConditions for Buying is Current candle a0 LOW = OPEN, b) Has a smaller wick than the previous cabndle size. Size here means high minus low of previous candle. More importantly Buy signal is genarated if the prious candle or series of candles were red. Condition for Sell signal is completely opposite of Buy signal. Buy signal will appear only after a Sell signal was generated earlier and vice versa for Sell signal. Signals are generated on a 5 minute timeframe. Idea is solely concieived by me.
Disclaimer: Just donot blindly take trades based on signals. Analyse the chart pattern, price action on different time frames of your own...

MNQ Morning Indicator | Clean SignalsMNQ Morning Trading Indicator Summary
What It Does
This is a TradingView indicator designed for day trading MNQ (Micro Nasdaq-100 futures) during morning sessions. It generates BUY and SELL signals only when multiple technical conditions align, helping traders identify high-probability trade setups.
Core Strategy
BUY Signal Requirements (All must be true):
✅ Price above VWAP (volume-weighted average price)
✅ Fast EMA (9) above Slow EMA (21) - uptrend confirmation
✅ Price above 15-minute 50 EMA - higher timeframe confirmation
✅ MACD histogram positive - momentum confirmation
✅ RSI above 55 - strength confirmation
✅ ADX above 25 - trending market (not choppy)
✅ Volume 1.5x above average - strong participation
SELL Signal (opposite conditions)
Key Features
🎯 Risk Management
Stop Loss: 2× ATR (Average True Range)
Take Profit 1: 2× ATR (1:2 risk-reward)
Take Profit 2: 3× ATR (1:3 risk-reward)
Dollar values: Calculates P&L based on MNQ's $2/point value
⏰ Session Filter
Default: 9:30 AM - 11:30 AM ET (customizable)
Safety feature: Avoids first 15 minutes (high volatility period)
Won't generate signals outside trading hours
🛡️ Signal Quality
Rates each signal: 🔥 STRONG, ⚡ MEDIUM, or ⚠️ WEAK
Requires minimum 15 bars between signals (prevents overtrading)
📊 Visual Dashboard
Shows real-time metrics:
ATR values
ADX (trend strength)
RSI (momentum)
Market condition (TREND/CHOP)
Session status
Volume status
Signal cooldown timer
Visual Elements
📈 VWAP with standard deviation bands (1σ, 2σ, 3σ)
📉 Multiple EMAs with trend-based coloring
🟢/🔴 Buy/Sell arrows on chart
📋 Detailed trade labels showing entry, SL, TPs, and risk-reward ratios
🎨 Background highlighting for market conditions
Safety Features
Cooldown period between signals
Session restrictions (no trading outside set hours)
First 15-minute avoidance (post-open volatility)
Multi-confirmation requirement (all 7 conditions must align)
Trend filter (ADX minimum to avoid choppy markets)
Best For
Day traders focused on morning sessions
MNQ futures traders
Traders who prefer systematic, rule-based entries
Those wanting pre-calculated risk management levels
Customization
All parameters are adjustable:
EMA periods
MACD settings
RSI thresholds
ADX minimum
ATR multipliers
Session times
Visual preferences
This indicator is designed to be conservative — it waits for strong confirmation before signaling, which means fewer but potentially higher-quality trades.

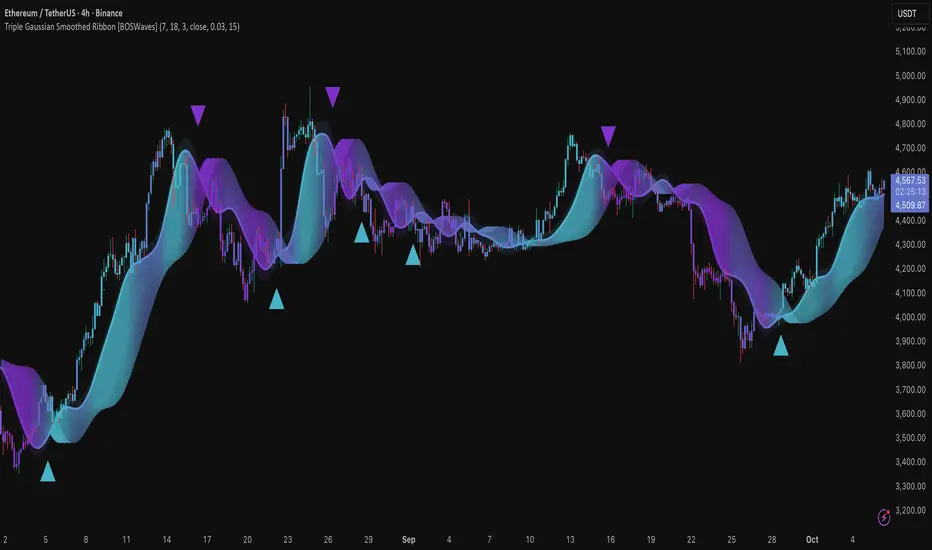
Triple Gaussian Smoothed Ribbon [BOSWaves]Triple Gaussian Smoothed Ribbon – Adaptive Gaussian Framework
Overview
The Triple Gaussian Smoothed Ribbon is a next-generation market visualization framework built on the principles of Gaussian filtering - a mathematical model from digital signal processing designed to remove noise while preserving the integrity of the underlying trend.
Unlike conventional moving averages that suffer from phase lag and overreaction to volatility spikes, Gaussian smoothing produces a symmetrical, low-lag curve that isolates meaningful directional shifts with exceptional clarity.
Developed under the Adaptive Gaussian Framework, this indicator extends the classical Gaussian model into a multi-stage smoothing and visualization system. By layering three progressive Gaussian filters and rendering their interactions as a gradient-based ribbon field, it translates market energy into a coherent, visually structured trend environment. Each ribbon layer represents a progressively smoothed component of price motion, producing a high-fidelity gradient field that evolves in sync with real-time trend strength and momentum.
The result is a uniquely fluid trend and reversal detection system - one that feels organic, adapts seamlessly across timeframes, and reveals hidden transitions in market structure long before traditional indicators confirm them.
Theoretical Foundation
The Gaussian filter, derived from the Gaussian function developed by Carl Friedrich Gauss in 1809, operates on the principle of weighted symmetry, assigning higher importance to central price data while tapering influence toward historical extremes following a bell-curve distribution. This symmetrical design minimizes phase distortion and smooths without introducing lag spikes — a stark contrast to exponential or linear filters that sacrifice temporal accuracy for responsiveness.
By cascading three Gaussian stages in sequence, the indicator creates a multi-frequency decomposition of price action:
The first stage captures immediate trend transitions.
The second absorbs mid-term volatility ripples.
The third stabilizes structural directionality.
The final composite ribbon reflects the market’s dominant frequency - a smoothed yet reactive trend spine - while an independent, heavier Gaussian smoothing serves as a reference layer to gauge whether the primary motion leads or lags relative to broader market structure.
This multi-layered Gaussian framework effectively replicates the behavior of a signal-processing filter bank: isolating meaningful cyclical movements, suppressing random noise, and revealing phase shifts with minimal delay.
How It Works
Triple Gaussian Core
Price data is passed through three successive Gaussian smoothing stages, each refining the trend further and removing higher-frequency distortions.
The result is a fluid, continuously adaptive baseline that responds naturally to directional changes without overshooting or flattening key inflection points.
Adaptive Ribbon Architecture
The indicator visualizes its internal dynamics through a five-layer gradient ribbon. Each layer represents a progressively delayed Gaussian curve, creating a color field that dynamically shifts between bullish and bearish tones.
Expanding ribbons indicate accelerating momentum and trend conviction.
Compressing ribbons reflect consolidation and volatility contraction.
The smooth color gradient provides a real-time depiction of energy buildup or dissipation within the trend, making it visually clear when the market is entering a state of expansion, transition, or exhaustion.
Momentum-Weighted Opacity
Ribbon transparency adjusts according to normalized momentum strength.
As trend force builds, colors intensify and layers become more opaque, signifying conviction.
When momentum wanes, ribbons fade - an early visual cue for potential reversals or pauses in trend continuation.
Candle Gradient Integration
Optional candle coloring ties the chart’s candles to the prevailing Gaussian gradient, allowing traders to view raw price action and smoothed wave dynamics as a unified system.
This integration produces a visually coherent chart environment that communicates directional intent instantly.
Signal Detection Logic
Directional cues emerge when the smoother, broader Gaussian curve crosses the faster-reacting Gaussian line, marking structural inflection points in the filtered trend.
Bullish shifts : short-term momentum transitions upward through the long-term baseline after a localized trough.
Bearish shifts : momentum declines through the baseline following a local peak.
To maintain integrity in choppy markets, the framework applies a trend-strength and separation filter, which blocks weak or overlapping conditions where movement lacks conviction.
Interpretation
The Triple Gaussian Smoothed Ribbon provides a layered, intuitive read on market structure:
Trend Continuation : Expanding ribbons with deep color intensity confirm directional strength.
Reversal Phases : Color gradients flip direction, indicating a phase shift or exhaustion point.
Compression Zones : Tight, pale ribbons reveal equilibrium phases often preceding breakouts.
Momentum Divergence : Fading color intensity despite continued price movement signals weakening conviction.
These transitions mirror the natural ebb and flow of market energy - captured through the Gaussian filter’s ability to represent smooth curvature without distortion.
Strategy Integration
Trend Following
Engage during strong directional expansions. When ribbons widen and color gradients intensify, the trend is accelerating with high confidence.
Reversal Identification
Monitor for full gradient inversion and fading momentum opacity. These conditions often precede transitional phases and early reversals.
Breakout Anticipation
Flat, compressed ribbons signal low volatility and energy buildup. A sudden gradient expansion with renewed opacity confirms breakout initiation.
Multi-Timeframe Alignment
Use higher timeframes to establish directional bias and lower timeframes for entry during compression-to-expansion transitions.
Technical Implementation Details
Triple Gaussian Stack : Sequential smoothing stages produce low-lag, high-purity signals.
Adaptive Ribbon Rendering : Five-layer Gaussian visualization for gradient-based trend depth.
Momentum Normalization : Opacity dynamically tied to trend strength and volatility context.
Consolidation Filter : Suppresses false signals in low-energy or range-bound conditions.
Integrated Candle Mode : Optional color synchronization with underlying gradient flow.
Alert System : Built-in notifications for bullish and bearish transitions.
This structure blends the precision of digital signal processing with the readability of visual market analysis, creating a clean but information-rich framework.
Optimal Application Parameters
Asset Recommendations
Cryptocurrency : Higher smoothing and sigma for stability under volatility.
Forex : Balanced parameters for cycle identification and reduced noise.
Equities : Moderate Gaussian length for responsive yet stable trend reads.
Indices & Futures : Longer smoothing periods for structural confirmation.
Timeframe Recommendations
Scalping (1 - 5m) : Use shorter smoothing for fast reactivity.
Intraday (15m - 1h) : Mid-length Gaussian chain for balance.
Swing (4h - 1D) : Prioritize clarity and opacity-driven trend phases.
Position (Daily - Weekly) : Longer smoothing to capture macro rhythm.
Performance Characteristics
Most Effective In :
Trending markets with recurring volatility cycles.
Transitional phases where early directional confirmation is crucial.
Less Effective In:
Ultra-low volume markets with erratic tick data.
Random, micro-chop conditions with no structural flow.
Integration Guidelines
Pair with volatility or volume expansion tools for enhanced breakout confirmation.
Use ribbon compression to anticipate volatility shifts.
Align entries with gradient expansion in the dominant color direction.
Scale position size relative to opacity strength and ribbon width.
Disclaimer
The Triple Gaussian Smoothed Ribbon – Adaptive Gaussian Framework is designed as a signal visualization and trend interpretation tool, not a standalone trading system. Its accuracy depends on appropriate parameter tuning, contextual confirmation, and disciplined risk management. It should be applied as part of a comprehensive technical or algorithmic trading strategy.
Volume-Confirmed Reversal Engine [AlgoPoint]Volume-Confirmed Reversal Engine v2.0
Overview
A price pattern alone is not enough to signal a high-probability reversal. True market turning points—moments of capitulation or euphoria—are almost always confirmed by a significant spike in volume.
The Volume-Confirmed Reversal Engine is designed to identify these exact moments. It filters out low-conviction price movements and focuses only on reversal patterns that are backed by meaningful volume activity.
How It Works
The indicator's logic is based on a sequential confirmation process:
- High-Volume Anchor Candle: The engine first scans for an "Anchor Candle"—a candle that makes a new high or low over a user-defined look_back period. Critically, this candle's volume must also be significantly higher than the recent average. Low-volume breakouts are ignored.
- Setup Activation & Visualization: When a valid Anchor Candle is detected, the indicator enters a "setup" phase. It visually marks this on your chart by drawing a Setup Box around the high and low of the Anchor Candle, extending it forward for the duration of the confirm_in window.
- Confirmation & Signal: A final signal is only triggered if the price breaks out of the opposite side of the Setup Box within the confirmation window. This action, combined with the initial volume spike, confirms the reversal.
- Setup Box Visualization: See exactly which candle the indicator is watching and the key price levels (the box boundaries) that need to be broken for a signal.
Signal Strength Score (1-4): Every signal now comes with a score, providing insight into its quality based on four factors:
- The base price pattern is met.
- The initial Anchor Candle had high volume.
- The final Confirmation Candle also had high volume.
- The signal is aligned with the long-term macro trend (e.g., a BUY signal above the 200 EMA).
Status Dashboard: A simple panel on your chart tells you what the indicator is doing in real-time ("Scanning for Setups," "Watching Bullish Setup," etc.) and displays a countdown for how many bars are left for a confirmation.
How to Interpret & Use
- The Box: When a colored box appears, it's an early warning that a reversal setup is active. Watch the boundaries of the box for a potential breakout.
- The Score: Use the score to gauge the quality of a signal. A 3/4 or 4/4 score represents a very high-conviction setup where multiple technical factors are aligned.
- The Dashboard: Use the panel to understand the indicator's current state and the time-sensitivity of an active setup.
- The BUY/SELL Labels: These are the final, actionable triggers, appearing only after the full price and volume confirmation process is complete.

Multi-Timeframe MACD with Color Mix (Nikko)Multi-Timeframe MACD with Color Mix (Nikko) Indicator
This documentation explains the benefits of the "Multi-Timeframe MACD with Color Mix (Nikko)" indicator for traders and provides easy-to-follow steps on how to use it. Written as of 05:06 AM +07 on Saturday, October 04, 2025, this guide focuses on helping you, as a trader, get the most out of this tool with clear, practical advice before diving into the technical details.
Benefits for Traders
1. Multi-Timeframe Insight
This indicator lets you see momentum trends across 15-minute, 1-hour, 1-day, and 1-week timeframes all on one chart. This big-picture view helps you catch both quick market moves and long-term trends without flipping between charts, saving you time and giving you a fuller understanding of the market.
2. Visual Momentum Representation
The background changes from red to green based on short-term (15m) momentum, giving you a quick, easy-to-see signal—red means bearish (prices might drop), and green means bullish (prices might rise). The histogram uses a mix of red, green, and blue colors to show the combined strength of the 1-hour, 1-day, and 1-week timeframes, helping you spot strong trends at a glance (e.g., a bright mix for strong momentum, darker for weaker).
3. Enhanced Decision-Making
The background and histogram colors work together to confirm trends across different timeframes, making it less likely you’ll act on a false signal. This helps you feel more confident when deciding when to buy, sell, or hold.
4. Proactive Alert System
You can set alerts to notify you when the percentage of bullish timeframes hits your chosen levels (e.g., below 10% for bearish, above 90% for bullish). This keeps you in the loop on big momentum shifts without needing to watch the chart all day—perfect for when you’re busy.
5. Flexibility and Efficiency
You can turn timeframes on or off, adjust settings like speed of the moving averages, and tweak transparency to fit your trading style—whether you’re a fast scalper or a patient swing trader. Everything is shown on one chart, saving you effort, and the colors make it simple to read, even if you’re new to trading.
How to Use It
Getting Started
Add the Indicator: Load the "Multi-Timeframe MACD with Color Mix (Nikko)" onto your TradingView chart using the Pine Script editor or indicator library.
Pick Your Timeframes: Turn on the timeframes that match your trading—use 15m and 1h for quick trades, or 1d and 1w for longer holds—using the enable_15m, enable_1h, enable_1d, enable_1w, and enable_background options.
Reading the Colors
Background Gradient: Watch for red to signal bearish 15m momentum and green for bullish momentum. Adjust the Background_transparency (default 75%, or 25% opacity) if the chart feels too busy—try lowering it to 50 for clearer candlesticks in fast markets.
Histogram and EMA Colors:
The histogram and its Exponential Moving Average (EMA) line show a mix of red (1-week), green (1-day), and blue (1-hour) based on how strong the momentum is in each timeframe.
Brighter colors mean stronger momentum—white (all bright) shows all timeframes are pushing up hard, while darker shades (like gray or black) mean weaker or mixed momentum.
Turn off a timeframe (e.g., enable_1h = false) to see how it changes the color mix and focus on what matters to you.
Setting Alerts
Set Your Levels: Choose a threshold_low (default 10%) and threshold_high (default 90%) based on your comfort zone or past market patterns to catch big turns.
Get Notifications: Use TradingView alerts to get pings when the market hits your set levels, so you can act without staring at the screen.
Practical Tips
Pair with Other Tools: Use it with support/resistance lines or the RSI to double-check your moves and build a solid plan.
Tweak Settings: Adjust fast_length, slow_length, and signal_smoothing to match your asset’s speed, and bump up the lookback (default 50) for steadier trends in wild markets.
Practice First: Test different timeframe combos on a demo account to find what works best for you.
Understanding the Colors (Simple Explanation)
How Colors Work
The histogram and its EMA line use a color mix based on a simple idea from color theory, like mixing paints with red, green, and blue (RGB):
Red comes from the 1-week timeframe, green from 1-day, and blue from 1-hour.
When all three timeframes show strong upward momentum, they blend into bright white—the brightest color, like a super-bright light telling you the market’s roaring up.
If some timeframes are weak or pulling down, the mix gets darker (like gray or black), warning you the momentum might not be solid.
Brighter is Better
Bright Colors = Strong Opportunity: The brighter the histogram and EMA (closer to white), the more all your chosen timeframes are in agreement that prices are rising. This is your signal to think about buying or holding, as it points to a powerful trend you can ride.
Dark Colors = Caution: A darker mix (toward black) means some timeframes are lagging or bearish, suggesting you might wait or consider selling. It’s like a dim light saying, “Hold on, check again.”
Benefit in Practice: Watching the brightness helps you jump on the best trades fast. For example, a bright white histogram on a green background is like a green traffic light—go for it! A dark gray on red is like a red light—pause and rethink. This quick color check can save you from bad moves and boost your profits when the trend is strong.
Why It Helps
These colors are your fast friend in trading. A bright histogram means all your timeframes are cheering for an uptrend, giving you the confidence to act. A dull one tells you to be careful, helping you avoid traps. It’s like having a color-coded guide to pick the hottest market moments!
Technical Details
Input Parameters
Fast Length (default: 12): Short-term moving average speed.
Slow Length (default: 26): Long-term moving average speed.
Source (default: close): Price data used.
Signal Smoothing (default: 9): Smooths the signal line.
MA Type (default: EMA): Choose EMA or SMA.
Timeframe and Scaling
Timeframes: 15m, 1h, 1d, 1w, with on/off switches.
Lookback Period (default: 50): Sets the data window for trends.
Background Transparency (default: 75%): Controls background see-through level.
MACD Calculation
Per Timeframe: Uses request.security():
MACD Line: ta.ema(src, fast_length) - ta.ema(src, slow_length).
Signal Line: ta.ema(MACD, signal_length).
Histogram: (macd - signal) / 3.0.
Background Gradient
15m Normalization: norm_value = (hist_15m - hist_15m_min) / max(hist_15m_range, 1e-10), limited to 0-1.
RGB Mix: Red drops from 255 to 0, green rises from 0 to 255, blue stays 0.
Apply: color.new(color.rgb(r_val, g_val, b_val), Background_transparency).
Histogram and EMA Colors
Color Assignment:
1h: Blue (#0000FF) if hist_1h >= 0, else black.
1d: Green (#00FF00) if hist_1d >= 0, else black.
1w: Red (#FF0000) if hist_1w >= 0, else black.
Final Color: final_color = color.rgb(min(r, 255), min(g, 255), min(b, 255)).
Plotting: Histogram and EMA use final_color; MACD (#2962FF), signal (#FF6D00).
Alerts
Bullish Percentage: bullish_pct = (bullish_count / bullish_total) * 100, counting hist >= 0.
Triggers: Below threshold_low or above threshold_high.
--------------------------------------------------------------------
Conclusion
The "Multi-Timeframe MACD with Color Mix (Nikko)" is your all-in-one tool to spot trends, confirm moves, and trade smarter with its bright, easy-to-read colors. By using it wisely, you can sharpen your market edge and trade with more confidence.
This README is tailored for traders and reflects the indicator's practical value as of 05:06 AM +07 on October 04, 2025.

Pairs Trading Scanner [BackQuant]Pairs Trading Scanner
What it is
This scanner analyzes the relationship between your chart symbol and a chosen pair symbol in real time. It builds a normalized “spread” between them, tracks how tightly they move together (correlation), converts the spread into a Z-Score (how far from typical it is), and then prints clear LONG / SHORT / EXIT prompts plus an at-a-glance dashboard with the numbers that matter.
Why pairs at all?
Markets co-move. When two assets are statistically related, their relationship (the spread) tends to oscillate around a mean.
Pairs trading doesn’t require calling overall market direction you trade the relative mispricing between two instruments.
This scanner gives you a robust, visual way to find those dislocations, size their significance, and structure the trade.
How it works (plain English)
Step 1 Pick a partner: Select the Pair Symbol to compare against your chart symbol. The tool fetches synchronized prices for both.
Step 2 Build a spread: Choose a Spread Method that defines “relative value” (e.g., Log Spread, Price Ratio, Return Difference, Price Difference). Each lens highlights a different flavor of divergence.
Step 3 Validate relationship: A rolling Correlation checks if the pair is moving together enough to be tradable. If correlation is weak, the scanner stands down.
Step 4 Standardize & score: The spread is normalized (mean & variability over a lookback) to form a Z-Score . Large absolute Z means “stretched,” small means “near fair.”
Step 5 Signals: When the Z-Score crosses user-defined thresholds with sufficient correlation , entries print:
LONG = long chart symbol / short pair symbol,
SHORT = short chart symbol / long pair symbol,
EXIT = mean reversion into the exit zone or correlation failure.
Core concepts (the three pillars)
Spread Method Your definition of “distance” between the two series.
Guidance:
Log Spread: Focuses on proportional differences; robust when prices live on different scales.
Price Ratio: Classic relative value; good when you care about “X per Y.”
Return Difference: Emphasizes recent performance gaps; nimble for momentum-to-mean plays.
Price Difference: Straight subtraction; intuitive for similar-scale assets (e.g., two ETFs).
Correlation A rolling score of co-movement. The scanner requires it to be above your Min Correlation before acting, so you’re not trading random divergence.
Z-Score “How abnormal is today’s spread?” Positive = chart richer than pair; negative = cheaper. Thresholds define entries/exits with transparent, statistical context.
What you’ll see on the chart
Correlation plot (blue line) with a dashed Min Correlation guide. Above the line = green zone for signals; below = hands off.
Z-Score plot (white line) with colored, dashed Entry bands and dotted Exit bands. Zero line for mean.
Normalized spread (yellow) for a quick “shape read” of recent divergence swings.
Signal markers :
LONG (green label) when Z < –Entry and corr OK,
SHORT (red label) when Z > +Entry and corr OK,
EXIT (gray label) when Z returns inside the Exit band or correlation drops below the floor.
Background tint for active state (faint green for long-spread stance, faint red for short-spread stance).
The two built-in dashboards
Statistics Table (top-right)
Pair Symbol Your chosen partner.
Correlation Live value vs. your minimum.
Z-Score How stretched the spread is now.
Current / Pair Prices Real-time anchors.
Signal State NEUTRAL / LONG / SHORT.
Price Ratio Context for ratio-style setups.
Analysis Table (bottom-right)
Avg Correlation Typical co-movement level over your window.
Max |Z| The recent extremes of dislocation.
Spread Volatility How “lively” the spread has been.
Trade Signal A human-readable prompt (e.g., “LONG A / SHORT B” or “NO TRADE” / “LOW CORRELATION”).
Risk Level LOW / MEDIUM / HIGH based on current stretch (absolute Z).
Signals logic (plain English)
Entry (LONG): The spread is unusually negative (chart cheaper vs pair) and correlation is healthy. Expect mean reversion upward in the spread: long chart, short pair.
Entry (SHORT): The spread is unusually positive (chart richer vs pair) and correlation is healthy. Expect mean reversion downward in the spread: short chart, long pair.
Exit: The spread relaxes back toward normal (inside your exit band), or correlation deteriorates (relationship no longer trusted).
A quick, repeatable workflow
1) Choose your pair in context (same sector/theme or known macro link). Think: “Do these two plausibly co-move?”
2) Pick a spread lens that matches your narrative (ratio for relative value, returns for short-term performance gaps, etc.).
3) Confirm correlation is above your floor no corr, no trade.
4) Wait for a stretch (Z beyond Entry band) and a printed LONG / SHORT .
5) Manage to the mean (EXIT band) or correlation failure; let the scanners’ state/labels keep you honest.
Settings that matter (and why)
Spread Method Defines the “mispricing” you care about.
Correlation Period Longer = steadier regime read, shorter = snappier to regime change.
Z-Score Period The window that defines “normal” for the spread; it sets the yardstick.
Use Percentage Returns Normalizes series when using return-based logic; keep on for mixed-scale assets.
Entry / Exit Thresholds Set your stretch and your target reversion zone. Wider entries = rarer but stronger signals.
Minimum Correlation The gatekeeper. Raising it favors quality over quantity.
Choosing pairs (practical cheat sheet)
Same family: two index ETFs, two oil-linked names, two gold miners, two L1 tokens.
Hedge & proxy: stock vs. sector ETF, BTC vs. BTC index, WTI vs. energy ETF.
Cross-venue or cross-listing: instruments that are functionally the same exposure but price differently intraday.
Reading the cues like a pro
Divergence shape: The yellow normalized spread helps you see rhythm fast spike and snap-back versus slow grind.
Corr-first discipline: Don’t fight the “Min Correlation” line. Good pairs trading starts with a relationship you can trust.
Exit humility: When Z re-centers, let the EXIT do its job. The edge is the journey to the mean, not overstaying it.
Frequently asked (quick answers)
“Long/Short means what exactly?”
LONG = long the chart symbol and short the pair symbol.
SHORT = short the chart symbol and long the pair symbol.
“Do I need same price scales?” No. The spread methods normalize in different ways; choose the one that fits your use case (log/ratio are great for mixed scales).
“What if correlation falls mid-trade?” The scanner will neutralize the state and print EXIT . Relationship first; trade second.
Field notes & patterns
Snap-back days: After a one-sided session, return-difference spreads often flag cleaner intraday mean reversions.
Macro rotations: Ratio spreads shine during sector re-weights (e.g., value vs. growth ETFs); look for steady corr + elevated |Z|.
Event bleed-through: If one symbol reacts to news and its partner lags, Z often flags a high-quality, short-horizon re-centering.
Display controls at a glance
Show Statistics Table Live state & key numbers, top-right.
Show Analysis Table Context/risk read, bottom-right.
Show Correlation / Spread / Z-Score Toggle the sub-charts you want visible.
Show Entry/Exit Signals Turn markers on/off as needed.
Coloring Adjust Long/Short/Neutral and correlation line colors to match your theme.
Alerts (ready to route to your workflow)
Pairs Long Entry Z falls through the long threshold with correlation above minimum.
Pairs Short Entry Z rises through the short threshold with correlation above minimum.
Pairs Trade Exit Z returns to neutral or the relationship fails your correlation floor.
Correlation Breakdown Rolling correlation crosses your minimum; relationship caution.
Final notes
The scanner is designed to keep you systematic: require relationship (correlation), quantify dislocation (Z-Score), act when stretched, stand down when it normalizes or the relationship degrades. It’s a full, visual loop for relative-value trading that stays out of your way when it should and gets loud only when the numbers line up.

Continuous Partial Buying Signals v7.1🇬🇧 English Description: Continuous Partial Buying Signals v7.1
This indicator is built on a long-term accumulation philosophy , not a traditional buy-sell strategy. Its main purpose is to systematically increase your position in an asset you believe in by identifying significant price drops as buying opportunities. It is a tool designed for long-term investors who want to automate the "buy the dip" or "Dollar Cost Averaging (DCA)" mindset.
How It Works
The logic follows a simple but powerful cycle: Find a Peak -> Wait for a Drop -> Signal a Buy -> Wait for a New Peak.
1. Identifies a Significant Peak: Instead of reacting to minor price spikes, the indicator looks back over a user-defined period (e.g., the last 200 candles) to find the highest price. This stable peak (marked with an orange circle) becomes the reference point for the current cycle.
2. Waits for a Pullback: The indicator then calculates the percentage drop from this locked-in peak.
3. Generates Buy Signals: When the price drops by the percentages you define (e.g., -5% and -10%), it plots a "BUY" signal on the chart. It will only signal once per level within the same cycle.
4. Resets the Cycle: This is the key. If the price recovers and establishes a new significant peak higher than the previous one, the entire cycle resets. The new peak becomes the new reference, and the buy signals are re-armed, allowing the indicator to perpetually find new buying opportunities in a rising market.
How to Get the Most Out of This Indicator
* Timeframe: It is highly recommended to use this on higher timeframes (4H, Daily, Weekly) to align with its long-term accumulation philosophy.
* Peak Lookback Period:
* Higher values (200, 300): Create more stable and less frequent signals. Ideal for long-term, patient investors.
* Lower values (50, 100): More sensitive to recent price action, resulting in more frequent cycles.
* Drop Percentages: Adjust these based on the asset's volatility.
* Volatile assets (Crypto): Consider larger percentages like 10%, 20%.
* Less volatile assets (Stocks, Indices): Smaller percentages like 3%, 5%, 8% might be more appropriate.
This indicator is a tool for disciplined, emotion-free accumulation. It does not provide sell signals.

Momentum Index [BigBeluga]The Momentum Index is an innovative indicator designed to measure the momentum of price action by analyzing the distribution of positive and negative momentum values over a defined period. By incorporating delta-based calculations and smoothing techniques, it provides traders with a clear and actionable representation of market momentum dynamics.
🔵 Key Features:
Delta-Based Momentum Analysis:
Calculates the momentum of price by comparing its current state to its value from a defined number of bars back.
Inside a loop, it evaluates whether momentum values are above or below zero, producing a delta value that reflects the net momentum direction and intensity.
Double EMA Smoothing:
Smooths the raw delta-based momentum values with a double EMA filter, reducing noise and providing a clearer trend signal.
tmi(len) =>
sum = 0.0
sum1 = 0.0
above = 0.0
below = 0.0
src_ = src - src
for i = 0 to len
sum := sum + (src_ > nz(src_ ) ? 1 : -1)
sum1 := sum1 + (sum > 0 ? 1 : -1)
sum1 := emaEma(sum1, 10)
for i = 1 to len
above := above + (sum1 > 0 ? 1 : 0)
below := below + (sum1 > 0 ? 0 : 1)
Directional Momentum Signals:
Generates momentum shift signals and displays them on both the oscillator and the main chart:
- △ Aqua Triangles: Represent upward momentum shifts.
- ▽ Red Triangles: Represent downward momentum shifts.
Dynamic Gradient Display:
Highlights momentum zones with gradient fills:
- Aqua shades for positive momentum (above zero).
- Red shades for negative momentum (below zero).
Dashboard Display:
A dashboard summarizing the count of momentum values above and below zero for the defined period (Sentiment Length e.g. 100), helping traders assess market sentiment at a glance.
🔵 How It Works:
The indicator takes price momentum as its source and evaluates the number of momentum values above and below zero within a defined period.
The delta calculation aggregates this information, providing a net representation of the prevailing market momentum.
A double EMA filter is applied to the delta values, smoothing the momentum line and enhancing signal clarity.
Momentum shifts are highlighted with visual signals on the oscillator and price chart, while the gradient display provides a visual representation of intensity.
🔵 Use Cases:
Momentum Tracking: Identify whether market momentum is predominantly bullish or bearish.
Signal Confirmation: Use chart-based signals to confirm potential trend reversals or continuation.
Analyze Market Strength: Leverage the dashboard to quickly assess the distribution of momentum over the chosen period.
Overbought/Oversold Conditions: Utilize gradient zones to detect areas of momentum extremes and possible price exhaustion.
Momentum Index offers a refined approach to analyzing momentum dynamics, combining delta-based calculations with smoothing techniques and intuitive visuals, making it an essential tool for traders looking to anticipate market movements effectively.
