FVG Reversal Sentinel🔵 FVG Reversal Sentinel – Multi-Timeframe Fair Value Gap Indicator
The FVG Reversal Sentinel is a powerful TradingView indicator designed to help traders identify and track Fair Value Gaps (FVGs) across multiple timeframes, all within a single chart.
This tool allows you to select up to five separate timeframes, ensuring you never miss key market shifts, whether you are scalping, day trading, or swing trading. You can use this indicator in any asset (Cryptos, Futures, Indices, Forex Pairs, etc.).
🔵 - Key Features -
Multi-Timeframe FVG Tracking – Select and display up to five different timeframes on one chart, providing a comprehensive view of market structure.
Customizable Colors – Adjust bullish and bearish FVG colors to match your chart theme for a seamless trading experience.
Enhanced Market Context – Quickly identify key liquidity zones and refine your entries and exits with precision.
Hide the lower timeframes FVGs to get a clear view in a custom timeframe.
Show or hide mitigated FVGs to declutter the chart.
FVGs boxes are going to be displayed only when the candle bar closes
FVGs are going to be mitigated only when the body of the candle closes above or below the FVG area.
No repainting
Whether you're looking to fine-tune your entries or gain a broader market perspective, the FVG Reversal Sentinel indicator ensures you have the tools to stay ahead of price action and capitalize on market inefficiencies.
🔵 - Customization-
You can change the indicator settings as you see fit to achieve the best results for your use case.
TIMEFRAMES
This indicator provides the ability to select up to 5 timeframes. These timeframes are based on the trader's timeframes including any custom timeframes.
Select the desired timeframe from the options list.
Add the label text you would like to show for the selected timeframe.
Check or uncheck the box to display or hide the timeframe from your chart.
FVG SETTINGS
Length of boxes: allows you to select the length of the box that is going to be displayed for the FVGs.
Delete boxes after fill?: allows you to show or hide mitigated FVGs on your chart.
Hide FVGs lower than enabled timeframes?: allows you to show or hide lower timeframe FVGs on your chart. Example - You are in a 15 minutes timeframe chart, if you choose to hide lower timeframe FVGs you will not be able to see 5 minutes FVG defined in your Timeframes Settings, only 15 minutes or higher timeframe FVGs will be displayed on your chart.
BOX VISUALS
Bullish FVG box color: the color and opacity of the box for the bullish FVGs.
Bearish FVG box color: the color and opacity of the box for the bearish FVGs.
LABELS VISUALS
Bullish FVG labels color: the color for bullish labels.
Bearish FVG labels color: the color for bearish labels.
Labels size: the size of the text displayed in the labels.
Labels position: the position of the label inside the FVGs boxes (right, left or center).
BORDER VISUALS
Border width: the width of the border (the thickness).
Bullish FVG border color: the color and the opacity of the bullish box border.
Bearish FVG border color: the color and the opacity of the bearish box border.
🔵 - How to use the indicator -
Just add the indicator in your chart and click in the settings option to customize it.
Make sure you select the desired timeframes and set the colors and opacity for the FVGs boxes.
This indicator can be used in many trading strategies, such as:
SILVER BULLET
iFVG
iFVG RETEST
These strategies are based on the use of FVGs, this tool can help you analyze the market and make the right decision.
🔵 - How was the indicator designed? -
I have spent a lot of time testing other open source indicators from the community. All of these indicators do a great job, but they have a problem, they not only mitigate FVGs when a candle closes above or below the FVG, they also mitigate FVGs when the candle closes exactly to the tick (not above or below the FVG). This is a problem for many strategies that rely on FVGs mitigation.
What makes this indicator different is that it focuses on just mitigating imbalances at the right time for these strategies.
I have taken ideas and some pieces of code from many community indicator developers, such as:
@twingall
@tflab
@marktools
@nacho-fx
@pmk07
... and many other people, to whom I thank for their valuable work and have allowed me to create this tool by making modifications to their source code.
🔵 - Disclaimer -
This tool is intended solely for informational and educational purposes and should not be regarded as financial, investment, or trading advice. It's not designed to predict market movements or offer specific recommendations. Users should be aware that past performance is not indicative of future results and should not rely on any indicator for financial decisions.
Tìm kiếm tập lệnh với "text"

BuyPrice TrackerDescription:
This custom indicator is designed to help traders and investors track the performance of multiple stocks relative to their specified buy prices. It offers a visual representation of price changes and percentage gains or losses, making it easier to monitor your portfolio at a glance.
Key Features:
1. Multiple Stock Tracking: Monitor up to 15 different stocks simultaneously.
2. Custom Buy Prices: Set individual buy prices for each stock you're tracking.
3. Dynamic Price Line: A yellow dotted line appears on the chart to mark your buy price.
4. Real-time Updates: The indicator updates with each new price bar, providing current information.
5. Percentage Change Display: Clearly shows the percentage change from your buy price to the current price.
6. Color-Coded Labels: Green for positive changes, red for negative, allowing for quick visual assessment.
7. Customizable Label Position: Choose between top-right or top-left corner of the chart for the information label.
8. Adjustable Text Size: Customize the size of the text in the label for better visibility.
9. Buy Price Scale Label: Displays your buy price directly on the price scale for easy reference.
How It Works:
Enter your stock symbols and corresponding buy prices in the indicator settings.
The indicator will display a yellow dotted line at your buy price for the current chart.
A label will appear showing the stock symbol, your buy price, and the current percentage change.
The label updates in real-time as prices change, allowing you to monitor performance instantly.
Benefits:
Effortlessly track multiple positions in your portfolio.
Quickly identify which stocks are performing well and which might need attention.
Make informed decisions about holding, selling, or buying more based on clear visual cues.
Customize the display to suit your trading style and chart setup.
This indicator is perfect for active traders managing multiple positions, long-term investors tracking their portfolio performance, or anyone looking to keep a close eye on specific price levels in the market.
Note: This indicator works best when applied to the specific stock charts you're tracking. Make sure to input the correct stock symbols and buy prices in the indicator settings for accurate results.

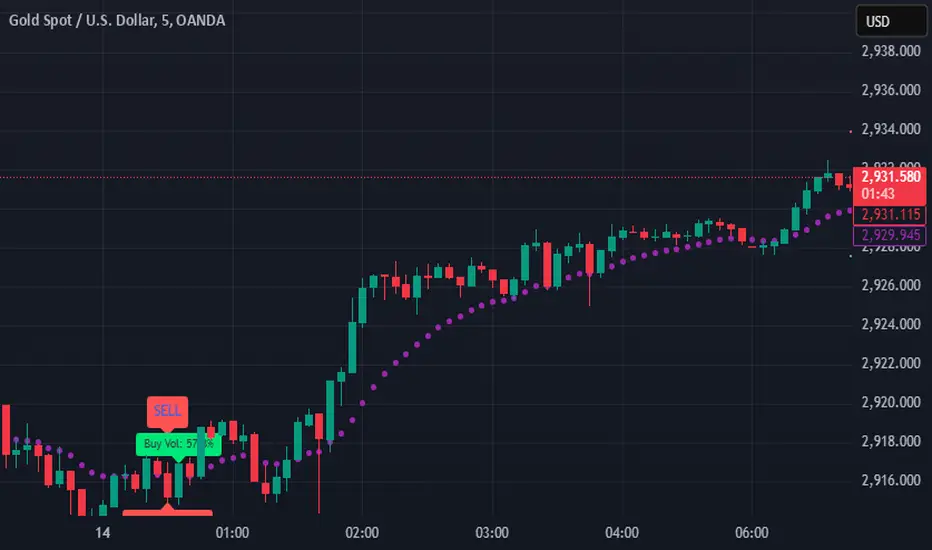
SIOVERSE EMA 15 with Buy/Sell Signals, Support & ResistanceThis Pine Script indicator is designed for TradingView and combines Exponential Moving Averages (EMAs), support and resistance levels, buy/sell signals, and volume percentage labels filtered by buy/sell conditions. It is a comprehensive tool for traders who want to analyze price trends, identify key levels, and make informed decisions based on volume and EMA crossovers.
Key Features of the Indicator
EMA 15 (Purple Dashed Line):
A 15-period Exponential Moving Average (EMA) is plotted on the chart as a dashed purple line.
This EMA helps traders identify short-term trends and potential entry/exit points.
Hidden EMA 21 and EMA 34:
The 21-period and 34-period EMAs are calculated but not displayed on the chart.
These EMAs are used to generate buy and sell signals based on crossovers.
Buy/Sell Signals:
Buy Signal: Occurs when the EMA 21 crosses above the EMA 34. A green "BUY" label is displayed below the candle.
Sell Signal: Occurs when the EMA 21 crosses below the EMA 34. A red "SELL" label is displayed above the candle.
These signals help traders identify potential trend reversals or continuations.
Support and Resistance Levels:
Support: The lowest price level over the last lookback_period candles, plotted as a green dashed horizontal line.
Resistance: The highest price level over the last lookback_period candles, plotted as a red dashed horizontal line.
These levels help traders identify key price zones for potential breakouts or reversals.
Volume Percentage Labels (Filtered by Buy/Sell Signals):
The volume percentage is calculated relative to the average volume over the last volume_lookback candles.
Buy Volume Label: When a buy signal occurs, a green label is displayed above the candle with the text "Buy Vol: X.XX%", where X.XX is the volume percentage.
Sell Volume Label: When a sell signal occurs, a red label is displayed below the candle with the text "Sell Vol: X.XX%", where X.XX is the volume percentage.
These labels help traders assess the strength of the buy/sell signals based on volume.
Alerts:
Alerts are triggered when buy or sell signals occur, notifying traders of potential trading opportunities.
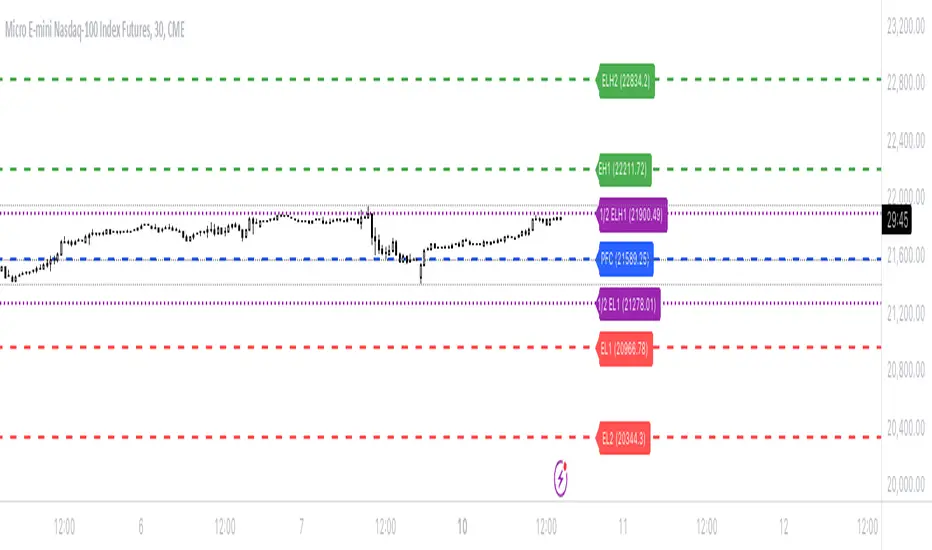
Bionic -- Expected Weekly Levels (Public)This script will draw lines for Expected Weekly Levels based upon Previous Friday Close, Implied Volatility (EOD Friday), and the square root of Days to Expire (always 7) / 365.
Script will draw 2 high and low levels:
*1st levels are 1 standard deviation from the Previous Friday Close.
* 2nd levels are 2 standard deviation from the Previous Friday Close.
There are also a 1/2 Low and 1/2 Low 1st level. These are 1/2 a standard deviation and act more as a point of interest level. 1/2 levels have 34% probability.
Configurations:
* All lines styles are individually configurable
* All lines can individually be turned on/off
* Text for all lines can be changed
* Global config allows for the
* Lines to show the price on the label
* Lines to have text in the label
* Hide or show all labels
* Lines offset from price is configurable
* Label size is configurable
BullDozz Fibo ZigZagFibo ZigZag - Advanced Fibonacci Retracement Tool 🔥
📌 Overview
The Fibo ZigZag indicator is a powerful tool for trend structure analysis using the ZigZag pattern and Fibonacci retracement levels. It automatically identifies swing highs & lows, draws ZigZag lines, and overlays Fibonacci levels with price labels at the right end for better readability.
This indicator is designed for traders who use price action, trend reversal strategies, and support/resistance analysis.
🛠 Features
✅ Automatic ZigZag detection with customizable depth, deviation, and backstep
✅ Fibonacci retracement levels (0%, 23.6%, 38.2%, 50%, 61.8%, 100%, 161.8%, 261.8%, 423.6%)
✅ Price labels at Fibonacci levels (placed at the right end of the levels)
✅ Alerts for new swing highs & lows
✅ Customizable line colors, text colors, and label sizes
✅ Lightweight and optimized for fast performance
📊 How It Works
1️⃣ The script detects ZigZag structure points based on price swings
2️⃣ It connects recent highs & lows with a ZigZag line
3️⃣ Fibonacci retracement levels are calculated and drawn between the last two significant swing points
4️⃣ Each Fibo level is labeled with its percentage & exact price, placed at the right end for clarity
5️⃣ Alerts trigger automatically when a new swing high or low is detected
⚙ Customization Options
🔹 ZigZag Settings: Adjust Depth, Deviation, BackStep, and Leg length
🔹 Fibonacci Levels: Modify line colors, label text colors, and visibility
🔹 Alerts: Enable/disable trend change alerts
📈 Best Use Cases
🚀 Identifying Trend Reversals – Detect key turning points using Fibonacci levels
📉 Support & Resistance Trading – Use retracement levels as entry/exit points
📊 Swing Trading & Scalping – Combine ZigZag with price action for effective strategies
🔔 Alert-Based Trading – Get notified when new swing highs/lows form
🚀 How to Use
📌 Add the indicator to your chart
📌 Adjust the settings to match your trading strategy
📌 Use the Fibonacci levels & ZigZag lines to analyze trend direction & key price zones
📌 Wait for alerts or manually enter trades based on price reaction to Fibo levels
📢 Final Thoughts
The Fibo ZigZag is an essential tool for traders who rely on price action, trend reversals, and Fibonacci levels. Whether you're a beginner or a pro, this indicator helps you spot high-probability trading opportunities with ease.
⚡ Try it now & enhance your trading strategy! 🚀
💬 Let us know your feedback & suggestions in the comments! Happy trading! 📊🔥

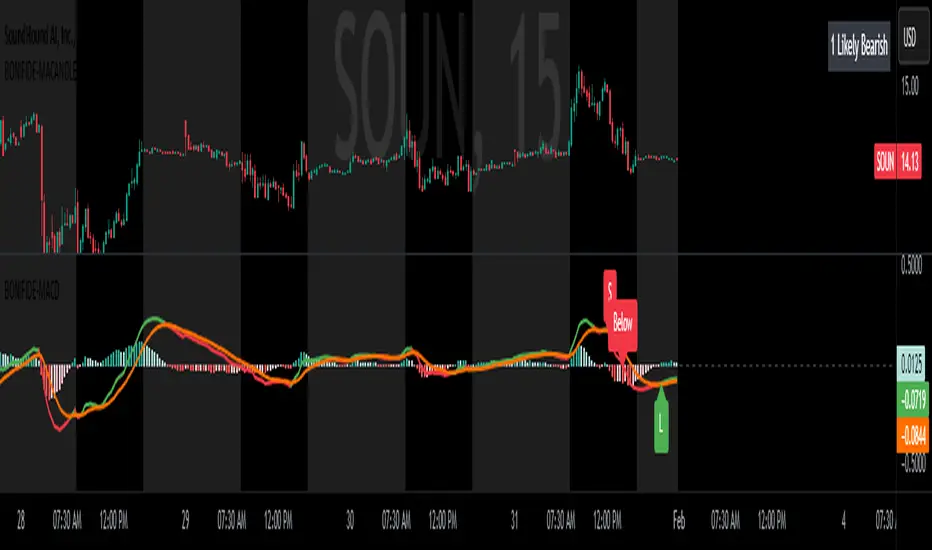
MACD with Candle DisplayMACD Calculation:
Uses user-defined Fast Length, Slow Length, and Signal Smoothing parameters to compute MACD.
Supports SMA (Simple Moving Average) or EMA (Exponential Moving Average) for the MACD line and signal line
Histogram-Based Candle Coloring:
The script categorizes histogram bars into four states:
0 (Very Bullish) → Green
1 (Likely Bearish) → Blue
2 (Likely Bullish) → Orange
3 (Very Bearish) → Red
Histogram Plot:
Displays histogram bars with distinct colors based on price momentum changes.
Market Sentiment Display in Status Line & Price Scale:
Instead of adding a label on the chart (which could obstruct candles), a text display is shown in the price scale and status line:
"0 Very Bullish"
"1 Likely Bearish"
"2 Likely Bullish"
"3 Very Bearish"
The text appears in the top-right corner with white font on a black background.
Purpose:
This indicator enhances the standard MACD by incorporating candle coloring and a cleaner sentiment display in the price scale, helping traders quickly interpret market momentum without cluttering the chart.
Displaced MAsDisplaced Moving Averages with Customizable Bands
Overview
The "Displaced Moving Averages with Customizable Bands" indicator is a powerful and versatile tool designed to provide a comprehensive view of price action in relation to various moving averages (MAs) and their volatility. It offers a high degree of customization, allowing traders to tailor the indicator to their specific needs and trading styles. The indicator features a primary moving average with multiple configurable percentage-based displacement bands. It also includes additional moving averages with standard deviation bands for a more in-depth analysis of different timeframes.
Key Features
Multiple Moving Average Types:
Choose from a wide range of popular moving average types for the primary MA calculation:
WMA (Weighted Moving Average)
EMA (Exponential Moving Average)
SMA (Simple Moving Average)
HMA (Hull Moving Average)
VWAP (Volume-Weighted Average Price)
Smoothed VWAP
Rolling VWAP
The flexibility to select the most appropriate MA type allows you to adapt the indicator to different market conditions and trading strategies.
Smoothed VWAP with Customizable Smoothing:
When "Smoothed VWAP" is selected, you can further refine it by choosing a smoothing type: SMA, EMA, WMA, or HMA.
Customize the smoothing period based on the chart's timeframe (1H, 4H, D, W) or use a default period. This feature offers fine-grained control over the responsiveness of the VWAP calculation.
Rolling VWAP with Adjustable Lookback:
The "Rolling VWAP" option calculates the VWAP over a user-defined lookback period.
Customize the lookback length for different timeframes (1H, 4H, D, W) or use a default period. This provides a dynamic VWAP calculation that adapts to the chosen timeframe.
Customizable Lookback Lengths:
Define the lookback period for the primary moving average calculation.
Tailor the lookback lengths for different timeframes (1H, 4H, D, W) or use a default value.
This allows you to adjust the sensitivity of the MA to recent price action based on the timeframe you are analyzing. Also has inputs for 5m, and 15m timeframes.
Percentage-Based Displacement Bands:
The core feature of this indicator is the ability to plot multiple displacement bands above and below the primary moving average.
These bands are calculated as a percentage offset from the MA, providing a clear visualization of price deviations.
Visibility Toggles: Independently show or hide each band (+/- 2%, 5%, 7%, 10%, 15%, 20%, 25%, 30%, 40%, 50%, 60%, 70%).
Customizable Colors: Assign unique colors to each band for easy visual identification.
Adjustable Multipliers: Fine-tune the percentage displacement for each band using individual multiplier inputs.
The bands are useful for identifying potential support and resistance levels, overbought/oversold conditions, and volatility expansions/contractions.
Labels for Displacement Bands:
The indicator displays labels next to each plotted band, clearly indicating the percentage displacement (e.g., "+7%", "-15%").
Customize the label text color for optimal visibility.
The labels can be horizontally offset by a user-defined number of bars.
Additional Moving Averages with Standard Deviation Bands:
The indicator includes three additional moving averages, each with upper and lower standard deviation bands. These are designed to provide insights into volatility on different timeframes.
Timeframe Selection: Choose the timeframes for these additional MAs (e.g., Weekly, 4-Hour, Daily).
Sigma (Standard Deviation Multiplier): Adjust the standard deviation multiplier for each MA.
MA Length: Set the lookback period for each additional MA.
Visibility Toggles: Show or hide the lower band of MA1, the middle/upper/lower bands of MA2, and the bands of MA3.
4h Bollinger Middle MA is unticked by default to provide a less cluttered chart
These additional MAs are particularly useful for multi-timeframe analysis and identifying potential trend reversals or volatility shifts.
How to Use
Add the indicator to your TradingView chart.
Customize the settings:
Select the desired Moving Average Type for the primary MA.
If using Smoothed VWAP, choose the Smoothing Type and adjust the Smoothing Period for different timeframes.
If using Rolling VWAP, adjust the Lookback Length for different timeframes.
Set the Lookback Length for the primary MA for different timeframes.
Toggle the visibility of the Displacement Bands and adjust their Colors and Multipliers.
Customize the Label Text Color and Offset.
Configure the Timeframes, Sigma, and MA Length for the additional moving averages.
Toggle the visibility of the additional MA bands.
Interpret the plotted lines and bands:
Primary MA: Represents the average price over the selected lookback period, calculated using the chosen MA type.
Displacement Bands: Indicate potential support and resistance levels, overbought/oversold conditions, and volatility ranges. Price trading outside these bands may signal significant deviations from the average.
Additional MAs with Standard Deviation Bands: Provide insights into volatility on different timeframes. Wider bands suggest higher volatility, while narrower bands indicate lower volatility.
Potential Trading Applications
Trend Identification: Use the primary MA to identify the overall trend direction.
Support and Resistance: The displacement bands can act as dynamic support and resistance levels.
Overbought/Oversold: Price reaching the outer displacement bands may suggest overbought or oversold conditions, potentially indicating a pullback or reversal.
Volatility Analysis: The standard deviation bands of the additional MAs can help assess volatility on different timeframes.
Multi-Timeframe Analysis: Combine the primary MA with the additional MAs to gain a broader perspective on price action across multiple timeframes.
Entry and Exit Signals: Use the interaction of price with the MA and bands to generate potential entry and exit signals. For example, a bounce off a lower band could be a buy signal, while a rejection from an upper band could be a sell signal.
Disclaimer
This indicator is for informational and educational purposes only and should not be considered financial advice. Trading involves risk, and past performance is not indicative of future results. Always conduct thorough research and consider your risk tolerance before making any trading decisions.
Enjoy using the "Displaced Moving Averages with Customizable Bands" indicator!

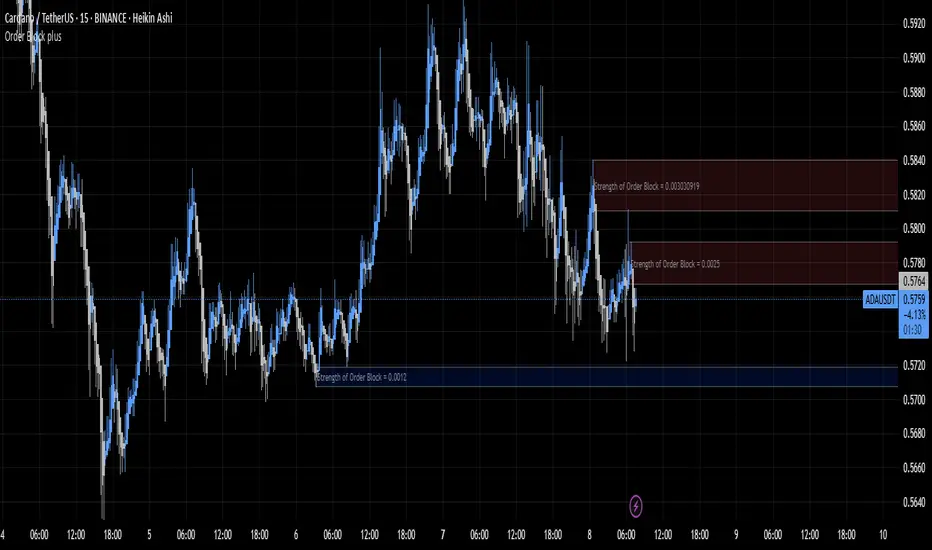
Order Block plusIndicator Description: “Order Block Plus”
This indicator is designed for traders who aim to identify the strength and position of supply and demand zones on the chart and receive key signals for entry or exit. Below is a detailed explanation of its functionality:
Features and Applications:
1. Identifying Supply and Demand Zones:
• Supply (Resistance) and Demand (Support) zones are visually displayed on the chart.
• Each zone is marked with a specific color (Yellow for supply, Blue for demand) for easy identification.
2. Breakout and Reversal Signals:
• The indicator detects Breakout and Reversal patterns and highlights them with alerts.
• Example: Detecting price breaking above or below key levels.
3. Candlestick Pattern Support:
• Identifies powerful patterns such as Bullish Engulf, Bearish Engulf, Three White Soldiers, and Three Black Crows.
4. Displaying Zone Strength:
• The indicator shows the strength of supply and demand zones using text displayed inside each zone.
5. Alerts:
• Provides alerts for zone breakouts, breakdowns, and new zone formations.
• Example: Alerts for breaking a demand or supply zone.
How to Use:
1. Adding to the Chart:
• The indicator can be applied to any time frame and is suitable for Forex, stocks, or cryptocurrency charts.
2. Identifying Trading Opportunities:
• Demand zones indicate strong support levels where prices are likely to rise.
• Supply zones indicate resistance levels where prices are likely to fall.
3. Examining Zone Strength:
• The strength of each zone is displayed with text inside the zone.
Indicator Settings:
• Zone Colors:
• The default colors for supply and demand zones are yellow and blue, but they can be customized.
• Alerts:
• Configurable alerts for breakouts or reversals.
Advantages:
• Automatic detection of key price levels.
• Accurate and timely alerts for trades.
• Customizable for professional traders.
Note: This indicator is designed for technical analysis and should be used alongside a suitable trading strategy.
RSI OB/OS Strategy Analyzer█ OVERVIEW
The RSI OB/OS Strategy Analyzer is a comprehensive trading tool designed to help traders identify and evaluate overbought/oversold reversal opportunities using the Relative Strength Index (RSI). It provides visual signals, performance metrics, and a detailed table to analyze the effectiveness of RSI-based strategies over a user-defined lookback period.
█ KEY FEATURES
RSI Calculation
Calculates RSI with customizable period (default 14)
Plots dynamic overbought (70) and oversold (30) levels
Adds background coloring for OB/OS regions
Reversal Signals
Identifies signals based on RSI crossing OB/OS levels
Two entry strategies available:
Revert Cross: Triggers when RSI exits OB/OS zone
Cross Threshold: Triggers when RSI enters OB/OS zone
Trade Direction
Users can select a trade bias:
Long: Focuses on oversold reversals (bullish signals)
Short: Focuses on overbought reversals (bearish signals)
Performance Metrics
Calculates three key statistics for each lookback period:
Win Rate: Percentage of profitable trades
Mean Return: Average return across all trades
Median Return: Median return across all trades
Metrics calculated as percentage changes from entry price
Visual Signals
Dual-layer signal display:
BUY: Green triangles + text labels below price
SELL: Red triangles + text labels above price
Semi-transparent background highlighting in OB/OS zones
Performance Table
Interactive table showing metrics for each lookback period
Color-coded visualization:
Win Rate: Gradient from red (low) to green (high)
Returns: Green for positive, red for negative
Time Filtering
Users can define a specific time window for the indicator to analyze trades, ensuring that performance metrics are calculated only for the desired period.
Customizable Display
Adjustable table font sizes: Auto/Small/Normal/Large
Toggle option for table visibility
█ PURPOSE
The RSI OB/OS Strategy Analyzer helps traders:
Identify mean-reversion opportunities through RSI extremes
Backtest entry strategy effectiveness across multiple time horizons
Optimize trade timing through visual historical performance data
Quickly assess strategy robustness with color-coded metrics
█ IDEAL USERS
Counter-Trend Traders: Looking to capitalize on RSI extremes
Systematic Traders: Needing quantitative strategy validation
Educational Users: Studying RSI behavior in different market conditions
Multi-Timeframe Analysts: Interested in forward returns analysis

Comprehensive Volume and Metrics with Pre-Market Volume Data
This script is designed for traders who want a detailed view of market activity, including regular market and pre-market volume, dollar volume, relative volume (RVOL), average daily range (ADR), average true range (ATR), relative strength index (RSI), and the QQQ’s percentage change.
The script includes customizable metrics displayed in tables on the chart for easy analysis, with the option to toggle the visibility of each metric.
Key Features:
Volume and Dollar Volume:
Displays the volume of shares traded during the current day (or pre-market, if enabled).
Includes a calculation of dollar volume, representing the total dollar amount of trades (Volume × Close Price).
Relative Volume (RVOL):
Displays RVOL Day, which is the relative volume of the current day compared to the 2-day moving average.
Shows RVOL 90D, indicating relative volume over the past 90 days.
Both RVOL metrics are calculated as percentages and display the percentage change compared to the standard (100%).
Pre-Market Data:
Includes pre-market volume (PVOL) and pre-market dollar volume (P$ VOL) which are displayed only if pre-market data is enabled.
Tracks volume and dollar volume during pre-market hours (4:00 AM to 9:30 AM Eastern Time) for more in-depth analysis.
Optionally, shows pre-market RSI based on volume-weighted close prices.
Average Daily Range (ADR):
Displays the percentage change between the highest and lowest prices over the defined ADR period (default is 20 days).
Average True Range (ATR):
Shows the ATR, a popular volatility indicator, for a given period (default is 14 bars).
RSI (Relative Strength Index):
Displays RSI for the given period (default is 14).
RSI is calculated using pre-market data when available.
QQQ:
Shows the percentage change of the QQQ ETF from the previous day’s close.
The QQQ percentage change is color-coded: green for positive, red for negative, and gray for no change.
Customizable Inputs:
Visibility Options: Toggle the visibility of each metric, such as volume, dollar volume, RVOL, ADR, ATR, RSI, and QQQ.
Pre-Market Data: Enable or disable the display of pre-market data for volume and dollar volume.
Table Positioning: Adjust the position of tables displaying the metrics either at the bottom-left or bottom-right of the chart.
Text Color and Table Background: Choose between white or black text for the tables and customize the background color.
Tables:
The script utilizes tables to display multiple metrics in an organized and easy-to-read format.
The values are updated dynamically, reflecting real-time data as the market moves.
Pre-Market Data:
The script calculates pre-market volume and dollar volume, along with other key metrics like RSI and RVOL, to help assess market sentiment before the market officially opens.
The pre-market data is accumulated from 4:00 AM to 9:30 AM ET, allowing for pre-market analysis and comparison to regular market hours.
User-Friendly and Flexible:
This script is designed to be highly customizable, giving you the ability to toggle which metrics to display and where they appear on the chart. You can easily focus on the data that matters most to your trading strategy.

StockInfo ManualScript Description:
The StockInfo Manual is designed to display detailed stock information directly on the chart for the selected symbol. It processes user-provided input data, including
stock symbols
Industries
Relative Strength (RS) values
Band information
Key Features:
1. Symbol-Specific Data Display: Displays information only for the current chart symbol.
2. Customizable Table: Adjust the table's position, text size, colors, and headers to match your preferences.
3. Low RS/Band Conditions: Highlights critical metrics (RS < 50 or Band < 6) with a red background for quick visual cues.
4. Toggle Information: Choose to show or hide RS, Band, and Industry columns based on your needs.
How to Use the Script:
1. Use any platform (ex: chartsmaze) to get Industry,RS and Band information of any Stock. Prepare the data as separate column of excel
2. Configure Inputs:
- Stock Symbols (`Stock`): Enter a comma-separated list of stock symbols (e.g.,
NSE:ABDL,
NSE:ABFRL,
NSE:ABREL,
NSE:ABSLAMC,
NSE:ACC,
NSE:ACE,
- Industries (`Industry`): Provide a comma-separated list of industries for the stocks (e.g., 103-Brewerie,
109-Retail-D,
92-Paper & ,
19-Asset Ma,
62-Cement,
58-Industri,
- Relative Strength (`RS`): Input RS values for each stock (e.g.,
83,
52,
51,
81,
23,
59,
- Band Information (`Band`): Specify Band values for each stock. Use "No Band" if 10,
No Band,
20,
20,
No Band,
20,
3. Customize the Table:
-Display Options: Toggle the visibility of `RS`, `Band`, and `Industry` using the input checkboxes.
-Position and Appearance: Choose the table's position on the chart (e.g., top-right, bottom-center). Customize text size, background colors, header display, and other visual elements.
4. Interpret the Table:
- The table will dynamically display information for the current chart symbol only.
- If the `RS` is below 50 or the Band is below 6, the corresponding row is highlighted with a red background for immediate attention.
One need to enter details at least weekly for a correct result

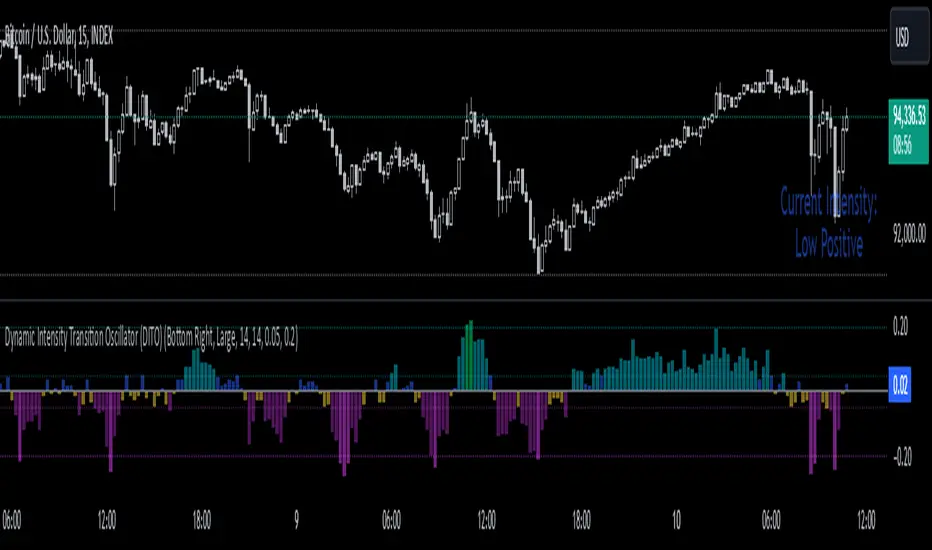
Dynamic Intensity Transition Oscillator (DITO)The Dynamic Intensity Transition Oscillator (DITO) is a comprehensive indicator designed to identify and visualize the slope of price action normalized by volatility, enabling consistent comparisons across different assets. This indicator calculates and categorizes the intensity of price movement into six states—three positive and three negative—while providing visual cues and alerts for state transitions.
Components and Functionality
1. Slope Calculation
- The slope represents the rate of change in price action over a specified period (Slope Calculation Period).
- It is calculated as the difference between the current price and the simple moving average (SMA) of the price, divided by the length of the period.
2. Normalization Using ATR
- To standardize the slope across assets with different price scales and volatilities, the slope is divided by the Average True Range (ATR).
- The ATR ensures that the slope is comparable across assets with varying price levels and volatility.
3. Intensity Levels
- The normalized slope is categorized into six distinct intensity levels:
High Positive: Strong upward momentum.
Medium Positive: Moderate upward momentum.
Low Positive: Weak upward movement or consolidation.
Low Negative: Weak downward movement or consolidation.
Medium Negative: Moderate downward momentum.
High Negative: Strong downward momentum.
4. Visual Representation
- The oscillator is displayed as a histogram, with each intensity level represented by a unique color:
High Positive: Lime green.
Medium Positive: Aqua.
Low Positive: Blue.
Low Negative: Yellow.
Medium Negative: Purple.
High Negative: Fuchsia.
Threshold levels (Low Intensity, Medium Intensity) are plotted as horizontal dotted lines for visual reference, with separate colors for positive and negative thresholds.
5. Intensity Table
- A dynamic table is displayed on the chart to show the current intensity level.
- The table's text color matches the intensity level color for easy interpretation, and its size and position are customizable.
6. Alerts for State Transitions
- The indicator includes a robust alerting system that triggers when the intensity level transitions from one state to another (e.g., from "Medium Positive" to "High Positive").
- The alert includes both the previous and current states for clarity.
Inputs and Customization
The DITO indicator offers a variety of customizable settings:
Indicator Parameters
Slope Calculation Period: Defines the period over which the slope is calculated.
ATR Calculation Period: Defines the period for the ATR used in normalization.
Low Intensity Threshold: Threshold for categorizing weak momentum.
Medium Intensity Threshold: Threshold for categorizing moderate momentum.
Intensity Table Settings
Table Position: Allows you to position the intensity table anywhere on the chart (e.g., "Bottom Right," "Top Left").
Table Size: Enables customization of table text size (e.g., "Small," "Large").
Use Cases
Trend Identification:
- Quickly assess the strength and direction of price movement with color-coded intensity levels.
Cross-Asset Comparisons:
- Use the normalized slope to compare momentum across different assets, regardless of price scale or volatility.
Dynamic Alerts:
- Receive timely alerts when the intensity transitions, helping you act on significant momentum changes.
Consolidation Detection:
- Identify periods of low intensity, signaling potential reversals or breakout opportunities.
How to Use
- Add the indicator to your chart.
- Configure the input parameters to align with your trading strategy.
Observe:
The Oscillator: Use the color-coded histogram to monitor price action intensity.
The Intensity Table: Track the current intensity level dynamically.
Alerts: Respond to state transitions as notified by the alerts.
Final Notes
The Dynamic Intensity Transition Oscillator (DITO) combines trend strength detection, cross-asset comparability, and real-time alerts to offer traders an insightful tool for analyzing market conditions. Its user-friendly visualization and comprehensive alerting make it suitable for both novice and advanced traders.
Disclaimer: This indicator is for educational purposes and is not financial advice. Always perform your own analysis before making trading decisions.
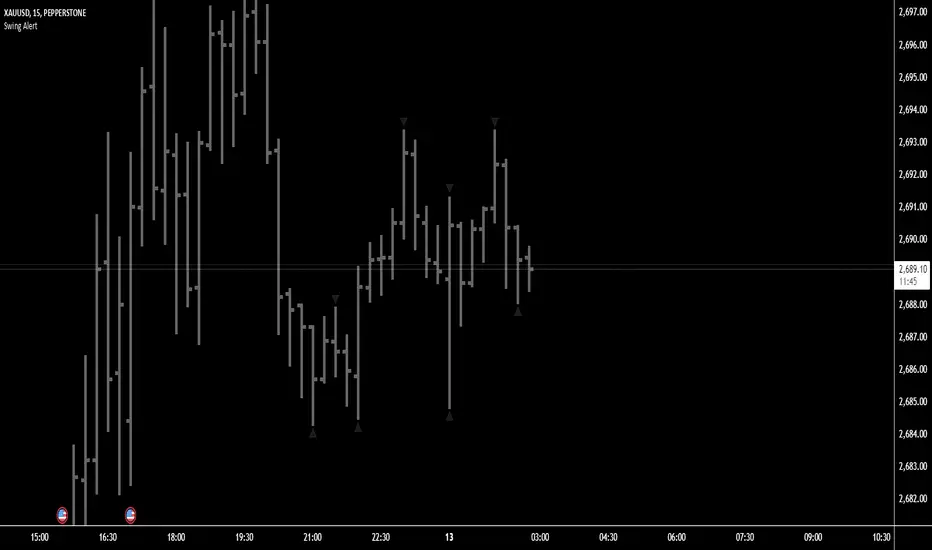
Swing Points AlertSwing Points Alert with Adjustable Delay
Description:
This script is designed to detect and alert traders about significant swing highs and lows on the chart. The script is equipped with customizable pivot detection settings and an innovative **Alert Delay** mechanism, allowing users to fine-tune their notifications to reduce noise and focus on key price movements.
Key Features:
1. **Swing High/Low Detection:**
- Identifies swing highs and lows based on user-defined pivot length.
- Visualizes these points with customizable labels for clarity.
2. **Customizable Alerts:**
- Enables real-time alerts for swing highs and lows.
- Users can adjust the delay for alerts to avoid false signals during volatile periods.
3. **Dynamic Label Management:**
- Automatically manages the number of displayed swing point labels.
- Removes crossed or outdated labels based on user preferences.
4. **Flexible Label Styling:**
- Provides multiple label styles (e.g., triangles, circles, arrows) and color customization for both swing highs and lows.
How the Alert Delay Works:
The **Alert Delay** helps filter signals by introducing a delay before triggering alerts. The delay is calculated as follows:
**Alert Delay (%) x Time Frame = Alert Delay in Time Frame Units**
For example:
- If the **Alert Delay** is set to 30% and the timeframe is **15 minutes**, the alert will be triggered after a delay of:
\
This ensures the alert is triggered only if the swing high/low condition remains valid for at least 4.5 minutes.
Important Notes:
1. **Timeframe Sensitivity:**
- This script is optimized for use across various timeframes, but users must adjust the **Alert Delay** percentage to match their trading style and timeframe.
- For example, higher timeframes may require lower delay percentages for timely alerts.
2. **Customization Options:**
- Easily customize pivot detection length, alert delay, label styles, and colors to suit your preferences.
3. **Support:**
- If you encounter any challenges or need help optimizing the script for your specific trading scenario, feel free to reach out for assistance.
Strategie Bollinger Bands buy & sellMiddle Band (Basis): Calculated using a Simple Moving Average (SMA) over a user-defined period.
Upper Band: The middle band plus the standard deviation of the price multiplied by a user-defined multiplier.
Lower Band: The middle band minus the standard deviation of the price multiplied by the same multiplier.
User Inputs:
Length: The number of periods used for the SMA and standard deviation (default: 20).
Deviation: The multiplier for the standard deviation to calculate the upper and lower bands (default: 2.0).
Buy and Sell Signals:
Buy Signal: Generated when the price crosses above the lower band, indicating a potential oversold condition.
Sell Signal: Generated when the price crosses below the upper band, indicating a potential overbought condition.
Visual Markers:
Buy Signals: Displayed below the price bars as green labels with the text "BUY."
Sell Signals: Displayed above the price bars as red labels with the text "SELL."
The Bollinger Bands (upper, middle, and lower) are plotted directly on the price chart for easy visualization.
How to Use the Script:
Customize Parameters:
Modify the length and deviation inputs to adapt to different market conditions or timeframes.
Interpret Signals:
A BUY signal indicates a possible reversal or upward movement from the lower band.
A SELL signal suggests a potential price decline from the upper band.
Combine with Other Indicators:
While effective in certain conditions, this strategy performs better when combined with other technical tools, such as RSI or MACD, to confirm trends and avoid false signals.
Limitations:
This script assumes that price will revert to the mean, which may not hold during strong trends or highly volatile conditions.
It is not a standalone trading system and should be backtested and optimized before applying to real trading.

CRT TBSThe CRT Candle Marker is a custom indicator designed to identify and highlight specific candlestick patterns on a chart. This indicator focuses on detecting candles where the body of the candlestick is larger than the combined size of its wicks (upper and lower). Such candles often indicate strong momentum in the market, making them valuable for traders who rely on price action analysis.
Features
Automatic Detection: The indicator automatically scans all candlesticks on the chart to identify CRT candles.
Visual Marking: Once a CRT candle is detected, it places a label with the text "CRT" above the candlestick for easy identification.
Customizable Design: The label is styled with a blue background and white text, ensuring it stands out clearly on the chart.
Use Case
The CRT Candle Marker is particularly useful for traders who:
Want to identify strong momentum candles that could signal potential trend continuation or reversal points.
Rely on price action strategies and need visual cues to spot significant patterns quickly.
Analyze candlestick behavior to confirm entry or exit points in their trading strategies.
How to Use
Copy the Pine Script code and paste it into the Pine Editor in TradingView.
Click Add to Chart to apply the indicator.
Look for candles marked with the "CRT" label to identify strong momentum candles.
Example Scenario
Imagine you're analyzing a chart and looking for strong bullish momentum. With the CRT Candle Marker, you can easily spot candles where the buyers dominated the session, as indicated by a large body relative to the wicks. Similarly, bearish CRT candles could indicate strong selling pressure.
Conclusion
The CRT Candle Marker is a simple yet powerful tool for traders who want to enhance their candlestick analysis. By highlighting significant momentum candles, this indicator helps traders make more informed decisions and improve their overall trading performance.
[w3ss1] Timeframe SyncThe "Timeframe Sync" indicator provides a comprehensive view of price action across multiple timeframes for a single symbol, allowing traders to analyze market conditions from a multi-timeframe perspective with ease.
Key Features:
Flexible Symbol Selection: Choose between analyzing the symbol of the current chart or select another symbol to monitor.
Customizable Timeframes: Control which timeframes you want to analyze through toggle switches. Choose from 11 different timeframes ranging from 1-minute to Monthly charts, with the ability to customize each one:
1m, 5m, 15m, 30m, 1H, 4H, 8H, 12H, 1D, 1W, 1M
Visual Feedback:
-Candle Close Color: Each timeframe's last closed candle is color-coded. Bullish closes are highlighted in green, bearish in dark shades, and inside candles in orange.
-Bias Indicator: The indicator shows whether the close is "above", "below", or "inside" the previous candle's high/low range, providing insight into the market's momentum.
Table Display: Information is presented in a clear table format:
-The first row shows the symbol being analyzed.
-The second row displays "Candle close" to indicate the relevance of the information below.
-Each subsequent row represents a different timeframe, showing its abbreviation and the bias of the last close.
Conditional Display: Timeframes are only shown if they are relevant to the current chart's timeframe. This ensures that you're not looking at outdated data when on lower timeframes.
Customization:
-Adjust text size, table position, background color, text color, and colors for different candle close scenarios.
Usage:
Ideal for traders who need a quick multi-timeframe analysis without switching charts.
Helps in confirming short-term moves with longer-term trends or spotting divergences across timeframes.
Instructions:
Add the indicator to your chart.
Customize the timeframes you wish to monitor via the toggle switches.
Optionally, select a different symbol if not analyzing the current chart's symbol.
Adjust colors and table settings to your preference.
Observe how price action behaves across different timeframes to make informed trading decisions.
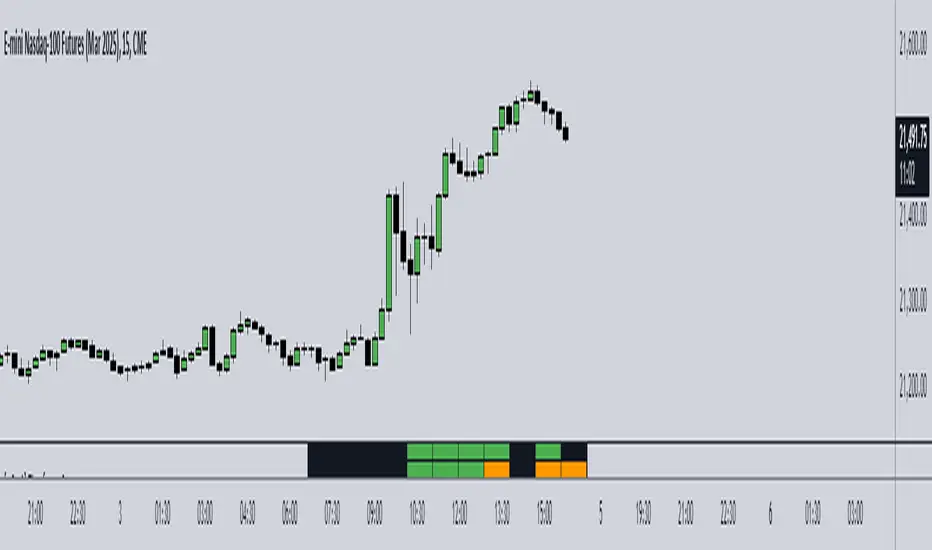
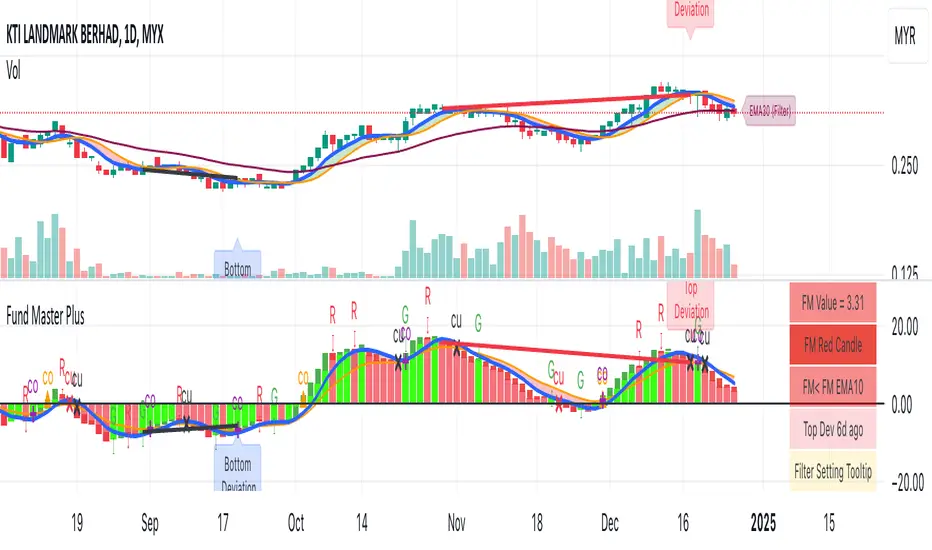
Fund Master Plus (TV Rev1, Dec2024)License: Mozilla Public License 2.0 (Open Source)
Version: Pine Script™ v6
Indicator Name: Fund Master Plus (TV Rev1, Dec2024)
Short Title: Fund Master Plus
About Fund Master Plus
Fund Master Plus indicator is an oscillating technical analysis tool designed to simulate the fund inflow and outflow trend.
Key features:
1. Fund Master Value and Candle
The candle highlights the direction of the Fund Master value.
Green candles represent an upward trend, while red candles indicate a downward trend.
When the candle crossover 0, it is a sign of the start of mid term bull, vice versa.
When the candle is above 0, it is a sign of mid-term bull, vice versa.
2. Fund Master Bar
This bar provides added visual representation of the Fund Master value.
Green bars represent and upward trend, while red bars indicate a downward trend.
3. FM EMA (Exponential Moving Average)
The Fund Master EMA (Exponential Moving Average) helps smooth out FM value fluctuations
and identify the overall trend.
When the candle crossover FM EMA, it is a sign of the start of short term bull, vice vera.
When the candle is above FM EMA, it is a sign of short term bull, vice versa.
4. EMA of FM EMA
This is an EMA of the Fund Master EMA, which can provide additional insights into the
trend's strength.
5. Candle Turn Green or Red
This feature generates alerts to signal potential trend changes.
6. Bottom Deviation & Top Deviation
Line plot and label of these deviation will show on indicator and the price chart to help user
identify potential buying and selling opportunities.
7. Alertcondition for Turn Green or Turn Red
User can set the alert using the Create Alert (the Clock Icon).
8. Table Summary
A table summary is provided to show indicator name, FM value, FM candle status,
Crossover, Crossunder, Turn Green, Turn Red status, Bar Number etc.
A tooltip for Filter Setting and a filter status check.
SOP to use the indicator:
Table (GR1):
Show Table: This option enables or disables the display of the table.
Text Size: This option allows you to set the text size for the table entries.
Width: This option sets the width of the table.
Fund Master Candle Color Setting (GR2):
FM candle will up by default.
This option enables the color setting of Fund Master candle.
Up: This option sets the color of the Fund Master candle for uptrend.
Down: This option sets the color of the Fund Master candle for downtrend.
Fund Master Bar and Color Setting (GR3):
Show Fund Master Bar: This option enables or disables the display of the Fund Master bar.
Up: This option sets the color of the Fund Master bar for uptrend.
Down: This option sets the color of the Fund Master bar for downtrend.
Fund Master EMA plots (GR4):
Show FM EMA: This option enables or disables the display of the Fund Master EMA line.
Look Back Period: This option sets the lookback period for the Fund Master EMA calculation.
EMA Color: This option sets the color of the Fund Master EMA line.
Show EMA of FM EMA: This option enables or disables the display of the EMA of the Fund Master EMA line.
Look Back Period 2: This option sets the lookback period for the EMA of the Fund Master EMA calculation.
Alerts: Fund Master Crossover & Crossunder EMA Line or 0 (GR5):
Show FM Crossover 0: This option enables or disables the display of the alert for FM crossover above the 0 line.
Show FM Crossunder 0: This option enables or disables the display of the alert for FM crossover below the 0 line.
Show FM Crossover EMA: This option enables or disables the display of the alert for FM crossover above the EMA line.
Show FM Crossunder EMA: This option enables or disables the display of the alert for FM crossover below the EMA line.
Bottom and Top Deviation (GR6):
Show Bottom Deviation: This option enables or disables the display of the bottom deviation line.
Show Top Deviation: This option enables or disables the display of the top deviation line.
Turn Green, Turn Red Alert (GR7):
Show Turn Green/Red Alerts: This option enables or disables the display of alerts for when the Fund Master value changes direction.
Current & Turn Green/Red Alerts: This option sets the number of bars to look back for the turn green/red alerts.
Band and User Input Setting (GR8):
100: This option enables or disables the display of the 100 band.
0: This option enables or disables the display of the 0 band.
-100: This option enables or disables the display of the -100 band.
User Input: This option enables or disables the display of a custom band based on user input.
Value: This option sets the value for the custom band.
Disclaimer
Attached chart is for the purpose of illustrating the use of indicator, no recommendation of buy/sell.
In this chart, all features in the setting are turned on (default and non default).
This chart is used to demonstrate the FM trend movement from mid-term bear to mid-term bull,
short-term bear and bull, bottom deviation and top deviation.
Hope this help. Merry Christmas and Happy New Year.
SnowglobeA fun Christmas publication where snowflakes fall to the bottom, as in a Snowglobe.
☃️ Shake Snowglobe
- Set the settings as desired.
Position the chart so the current real-time bar at the right is still visible; otherwise, the snowflakes will not move.
- Simple move the chart a bit, zoom, or adjust the settings if you want to start over.
'White Theme' users will experience black snow, while 'Dark Themers' will get white snow! 😄
🎄 Pine Script™
- If the 'Amount' is 500 or lower, only label.new() is used, if higher, box.new() with text comes also in play.
- The size of the text is set with numeric values, a new feature of Pine Script™ version 6!
☃️ Settings
Amount: Maximum amount of snowflakes
Moving Flakes: Maximum amount of moving snowflakes per tick move
Max Speed: Maximum speed of tumbling snowflakes
Drift: Maximum bar distance of snowflakes' drift
Happy Holidays! 🎅🏻🧑🏻🎄

Thygoo Countdown TimerThis custom Pine Script indicator displays a real-time countdown timer on your chart, showing the remaining time until the current candle closes based on the active timeframe. The timer is updated dynamically, providing a clear and easy-to-read countdown directly on the chart.
Features:
Real-Time Countdown: The indicator automatically calculates the time remaining for the current candle to close, updating in real-time.
Multiple Timeframes: It works with any active timeframe, including minute-based and multi-minute intervals, such as 3m, 5m, 15m, 1h, etc.
Dynamic Box Position: The countdown is displayed inside a resizable and repositionable box on the chart, placed above the current price action.
Visibility: The box and text are clearly visible, with customizable font sizes for better readability.
No Extra Clutter: The countdown text appears without any unnecessary border lines, keeping the display clean and unobtrusive.
How to Use:
Add this indicator to your chart to monitor the countdown of the current timeframe.
The timer will update automatically, showing the time left (minutes:seconds) until the next bar closes.
Adjust the chart's zoom level to ensure the timer box remains clearly visible in the right-hand section of your chart.
Ideal for:
Traders who want a quick and efficient way to track the time remaining on their current chart timeframe.
Anyone looking to add a countdown timer to their TradingView chart without the clutter of additional indicators.
Total Volume for Custom PeriodIndicator Description: Total Volume for Custom Period
This indicator calculates the total trading volume for a specified time period and displays the result in the top-right corner of the chart. It is designed for traders and analysts who want to see the cumulative volume over a defined range of time without needing to calculate it manually.
Features:
Customizable Time Period:
Define the start and end times of the calculation using the easy-to-use settings panel.
The indicator dynamically updates as you adjust the dates.
Accurate Volume Calculation:
Calculates the total trading volume for all candlesticks between the selected start and end dates.
Works on all assets and timeframes supported by TradingView (stocks, crypto, forex, etc.).
Fixed Display:
The result is displayed in the top-right corner of the chart inside a clear and simple table.
The value remains visible regardless of chart movement or zoom level.
Real-time Updates:
Automatically recalculates the volume when new data is added or the selected time period changes.
Customizable Design:
Black text with a transparent background ensures the display is clear and non-intrusive.
Large text size for easy readability.
Use Cases:
Volume Analysis: Quickly assess the total trading activity over a specific time period.
Historical Data Analysis: Compare volume data across different time intervals.
Custom Strategies: Use the total volume metric as part of a broader trading strategy or analysis.
How It Works:
Open the settings panel of the indicator and input the desired Start Date and End Date.
The indicator calculates the total trading volume for all candles within the selected range.
The result is displayed in the top-right corner of the chart.
This indicator is a simple yet powerful tool for traders who rely on volume analysis to make informed decisions. It enhances your ability to study market behavior during specific periods and provides insights into trading activity with ease.

Harmonic Pattern Detector (75 patterns)Harmonic Pattern Detector offers a record amount of "Harmonic Patterns" in one script, with 75 different patterns detected, together with up to 99 different swing lengths.
🔶 USAGE
Harmonic Patterns are detected from several different ZigZag lines, derived from Swings with different lengths (shorter - longer term)
Depending on the settings ' Minimum/Maximum Swing Length ', the user will see more or less patterns from shorter and/or longer-term swing points.
🔹 Fibonacci Ratio
Certain patterns have only one ratio for a specific retrace/extension instead of one upper and one lower limit. In this case, we add a ' Tolerance ', which adds a percentage tolerance below/above the ratio, creating two limits.
A higher number may show more patterns but may become less valid.
Hoovering over points B, C, and D will show a tooltip with the concerning limits; adjusted limits will be seen if applicable.
Tooltips in settings will also show which patterns the Fibonacci Ratio applies to.
🔹 Triangle Area Ratio
Using Heron's formula , the triangle area is calculated after the X-Y axis is normalized.
Users can filter patterns based on the ratio of the smallest triangle to the largest triangle.
A lower Triangle Area Ratio number leads to more symmetrical patterns but may appear less frequently.
🔶 DETAILS
Harmonic patterns are based on geometric patterns, where the retracement/extension of a swing point must be located between specific Fibonacci ratios of the previous swing/leg. Different Harmonic Patterns require unique ratios to become valid patterns.
In the above example there is a valid 'Max Butterfly' pattern where:
Point B is located between 0.618 - 0.886 retracement level of the X-A leg
Point C is located between 0.382 - 0.886 retracement level of the A-B leg
Point D is located between 1.272 - 2.618 extension level of the B-C leg
Point D is located between 1.272 - 1.618 extension level of the X-A leg
Harmonic Pattern Detector uses ZigZag lines, where swing highs and swing lows alternate. Each ZigZag line is checked for valid Harmonic Patterns . When multiple types of Harmonic Patterns are valid for the same sequence, the pattern will be named after the first one found.
Different swing lengths form different ZigZag lines.
By evaluating different ZigZag lines (up to 99!), shorter—and longer-term patterns can be drawn on the same chart.
🔹 Blocks
The patterns are organized into blocks that can be toggled on or off with a single click.
When a block is enabled, the user can still select which specific patterns within that block are enabled or disabled.
🔹 Visuals
Besides color settings, labels can show pattern names or arrows at point D of the pattern.
Note this will happen 1 bar after validation because one extra bar is needed for confirmation.
An option is included to show only arrows without the patterns.
🔹 Updated Patterns
When a Swing Low is followed by a lower low or a Swing High followed by a higher high , triggering a pattern identical to a previous one except with a different point D, the pattern will be updated. The previous C-D line will be visible as a dashed line to highlight the event. Only the last dashed line is shown when this happens more than once.
🔹 Optimization
The script only verifies the last leg in the initial phase, significantly reducing the time spent on pattern validation. If this leg doesn't align with a potential Harmonic Pattern , the pattern is immediately disregarded. In the subsequent phase, the remaining patterns are quickly scrutinized to ensure the next leg is valid. This efficient process continues, with only valid patterns progressing to the next phase until all sequences have been thoroughly examined.
This process can check up to 99 ZigZag lines for 75 different Harmonic Patterns , showcasing its high capacity and versatility.
🔹 Ratios
The following table shows the different ratios used for each Harmonic Pattern .
' min ' and ' max ' are used when only one limit is provided instead of 2. This limit is given a percentage tolerance above and below, customizable by the setting ' Tolerance - Fibonacci Ratio '.
For example a ratio of 0.618 with a tolerance of 1% would result in:
an upper limit of 0.624
a lower limit of 0.612
|-------------------|------------------------|------------------------|-----------------------|-----------------------|
| NAME PATTERN | BCD (BD) | ABC (AC) | XAB (XB) | XAD (XD) |
| | min max | min max | min max | min max |
|-------------------|------------------------|------------------------|-----------------------|-----------------------|
| 'ABCD' | 1.272 - 1.618 | 0.618 - 0.786 | | |
| '5-0' | 0.5 *min - 0.5 *max | 1.618 - 2.24 | 1.13 - 1.618 | |
| 'Max Gartley' | 1.128 - 2.236 | 0.382 - 0.886 | 0.382 - 0.618 | 0.618 - 0.786 |
| 'Gartley' | 1.272 - 1.618 | 0.382 - 0.886 | 0.618*min - 0.618*max | 0.786*min - 0.786*max |
| 'A Gartley' | 1.618*min - 1.618*max | 1.128 - 2.618 | 0.618 - 0.786 | 1.272*min - 1.272*max |
| 'NN Gartley' | 1.128 - 1.618 | 0.382 - 0.886 | 0.618*min - 0.618*max | 0.786*min - 0.786*max |
| 'NN A Gartley' | 1.618*min - 1.618*max | 1.128 - 2.618 | 0.618 - 0.786 | 1.272*min - 1.272*max |
| 'Bat' | 1.618 - 2.618 | 0.382 - 0.886 | 0.382 - 0.5 | 0.886*min - 0.886*max |
| 'Alt Bat' | 2.0 - 3.618 | 0.382 - 0.886 | 0.382*min - 0.382*max | 1.128*min - 1.128*max |
| 'A Bat' | 2.0 - 2.618 | 1.128 - 2.618 | 0.382 - 0.618 | 1.128*min - 1.128*max |
| 'Max Bat' | 1.272 - 2.618 | 0.382 - 0.886 | 0.382 - 0.618 | 0.886*min - 0.886*max |
| 'NN Bat' | 1.618 - 2.618 | 0.382 - 0.886 | 0.382 - 0.5 | 0.886*min - 0.886*max |
| 'NN Alt Bat' | 2.0 - 4.236 | 0.382 - 0.886 | 0.382*min - 0.382*max | 1.128*min - 1.128*max |
| 'NN A Bat' | 2.0 - 2.618 | 1.128 - 2.618 | 0.382 - 0.618 | 1.128*min - 1.128*max |
| 'NN A Alt Bat' | 2.618*min - 2.618*max | 1.128 - 2.618 | 0.236 - 0.5 | 0.886*min - 0.886*max |
| 'Butterfly' | 1.618 - 2.618 | 0.382 - 0.886 | 0.786*min - 0.786*max | 1.272 - 1.618 |
| 'Max Butterfly' | 1.272 - 2.618 | 0.382 - 0.886 | 0.618 - 0.886 | 1.272 - 1.618 |
| 'Butterfly 113' | 1.128 - 1.618 | 0.618 - 1.0 | 0.786 - 1.0 | 1.128*min - 1.128*max |
| 'A Butterfly' | 1.272*min - 1.272*max | 1.128 - 2.618 | 0.382 - 0.618 | 0.618 - 0.786 |
| 'Crab' | 2.24 - 3.618 | 0.382 - 0.886 | 0.382 - 0.618 | 1.618*min - 1.618*max |
| 'Deep Crab' | 2.618 - 3.618 | 0.382 - 0.886 | 0.886*min - 0.886*max | 1.618*min - 1.618*max |
| 'A Crab' | 1.618 - 2.618 | 1.128 - 2.618 | 0.276 - 0.446 | 0.618*min - 0.618*max |
| 'NN Crab' | 2.236 - 4.236 | 0.382 - 0.886 | 0.382 - 0.618 | 1.618*min - 1.618*max |
| 'NN Deep Crab' | 2.618 - 4.236 | 0.382 - 0.886 | 0.886*min - 0.886*max | 1.618*min - 1.618*max |
| 'NN A Crab' | 1.128 - 2.618 | 1.128 - 2.618 | 0.236 - 0.447 | 0.618*min - 0.618*max |
| 'NN A Deep Crab' | 1.128*min - 1.128*max | 1.128 - 2.618 | 0.236 - 0.382 | 0.618*min - 0.618*max |
| 'Cypher' | 1.272 - 2.00 | 1.13 - 1.414 | 0.382 - 0.618 | 0.786*min - 0.786*max |
| 'New Cypher' | 1.272 - 2.00 | 1.414 - 2.14 | 0.382 - 0.618 | 0.786*min - 0.786*max |
| 'Anti New Cypher' | 1.618 - 2.618 | 0.467 - 0.707 | 0.5 - 0.786 | 1.272*min - 1.272*max |
| 'Shark 1' | 1.618 - 2.236 | 1.128 - 1.618 | 0.382 - 0.618 | 0.886*min - 0.886*max |
| 'Shark 1 Alt' | 1.618 - 2.618 | 0.618 - 0.886 | 0.446 - 0.618 | 1.128*min - 1.128*max |
| 'Shark 2' | 1.618 - 2.236 | 1.128 - 1.618 | 0.382 - 0.618 | 1.128*min - 1.128*max |
| 'Shark 2 Alt' | 1.618 - 2.618 | 0.618 - 0.886 | 0.446 - 0.618 | 0.886*min - 0.886*max |
| 'Leonardo' | 1.128 - 2.618 | 0.382 - 0.886 | 0.5*min - 0.5*max | 0.786*min - 0.786*max |
| 'NN A Leonardo' | 2.0*min - 2.0*max | 1.128 - 2.618 | 0.382 - 0.886 | 1.272*min - 1.272*max |
| 'Nen Star' | 1.272 - 2.0 | 1.414 - 2.14 | 0.382 - 0.618 | 1.272*min - 1.272*max |
| 'Anti Nen Star' | 1.618 - 2.618 | 0.467 - 0.707 | 0.5 - 0.786 | 0.786*min - 0.786*max |
| '3 Drives' | 1.272 - 1.618 | 0.618 - 0.786 | 1.272 - 1.618 | 1.618 - 2.618 |
| 'A 3 Drives' | 0.618 - 0.786 | 1.272 - 1.618 | 0.618 - 0.786 | 0.13 - 0.886 |
| '121' | 0.382 - 0.786 | 1.128 - 3.618 | 0.5 - 0.786 | 0.382 - 0.786 |
| 'A 121' | 1.272 - 2.0 | 0.5 - 0.786 | 1.272 - 2.0 | 1.272 - 2.618 |
| '121 BG' | 0.618 - 0.707 | 1.128 - 1.733 | 0.5 - 0.577 | 0.447 - 0.786 |
| 'Black Swan' | 1.128 - 2.0 | 0.236 - 0.5 | 1.382 - 2.618 | 1.128 - 2.618 |
| 'White Swan' | 0.5 - 0.886 | 2.0 - 4.237 | 0.382 - 0.786 | 0.238 - 0.886 |
| 'NN White Swan' | 0.5 - 0.886 | 2.0 - 4.236 | 0.382 - 0.724 | 0.382 - 0.886 |
| 'Sea Pony' | 1.618 - 2.618 | 0.382 - 0.5 | 0.128 - 3.618 | 0.618 - 3.618 |
| 'Navarro 200' | 0.886 - 3.618 | 0.886 - 1.128 | 0.382 - 0.786 | 0.886 - 1.128 |
| 'May-00' | 0.5 - 0.618 | 1.618 - 2.236 | 1.128 - 1.618 | 0.5 - 0.618 |
| 'SNORM' | 0.9 - 1.1 | 0.9 - 1.1 | 0.9 - 1.1 | 0.618 - 1.618 |
| 'COL Poruchik' | 1.0 *min - 1.0 *max | 0.382 - 2.618 | 0.128 - 3.618 | 0.618 - 3.618 |
| 'Henry – David' | 0.618 - 0.886 | 0.44 - 0.618 | 0.128 - 2.0 | 0.618 - 1.618 |
| 'DAVID VM 1' | 1.618 - 1.618 | 0.382*min - 0.382*max | 0.128 - 1.618 | 0.618 - 3.618 |
| 'DAVID VM 2' | 1.618 - 1.618 | 0.382*min - 0.382*max | 1.618 - 3.618 | 0.618 - 7.618 |
| 'Partizan' | 1.618*min - 1.618*max | 0.382*min - 0.382*max | 0.128 - 3.618 | 0.618 - 3.618 |
| 'Partizan 2' | 1.618 - 2.236 | 1.128 - 1.618 | 0.128 - 3.618 | 1.618 - 3.618 |
| 'Partizan 2.1' | 1.618*min - 1.618*max | 1.128*min - 1.128*max | 0.128 - 3.618 | 0.618 - 3.618 |
| 'Partizan 2.2' | 2.236*min - 2.236*max | 1.128*min - 1.128*max | 0.128 - 3.618 | 0.618 - 3.618 |
| 'Partizan 2.3' | 1.618*min - 1.618*max | 0.618 - 1.618 | 0.128 - 3.618 | 0.618 - 3.618 |
| 'Partizan 2.4' | 2.236*min - 2.236*max | 1.618*min - 1.618*max | 0.128 - 3.618 | 0.618 - 3.618 |
| 'TOTAL' | 1.272 - 3.618 | 0.382 - 2.618 | 0.276 - 0.786 | 0.618 - 1.618 |
| 'TOTAL NN' | 1.272 - 4.236 | 0.382 - 2.618 | 0.236 - 0.786 | 0.618 - 1.618 |
| 'TOTAL 1' | 1.272 - 2.618 | 0.382 - 0.886 | 0.382 - 0.786 | 0.786 - 0.886 |
| 'TOTAL 2' | 1.618 - 3.618 | 0.382 - 0.886 | 0.382 - 0.786 | 1.128 - 1.618 |
| 'TOTNN 2NN' | 1.618 - 4.236 | 0.382 - 0.886 | 0.382 - 0.786 | 1.128 - 1.618 |
| 'TOTAL 3' | 1.272 - 2.618 | 1.128 - 2.618 | 0.276 - 0.618 | 0.618 - 0.886 |
| 'TOTNN 3NN' | 1.272 - 2.618 | 1.128 - 2.618 | 0.236 - 0.618 | 0.618 - 0.886 |
| 'TOTAL 4' | 1.618 - 2.618 | 1.128 - 2.618 | 0.382 - 0.786 | 1.128 - 1.272 |
| 'BG 1' | 2.618*min - 2.618*max | 0.382*min - 0.382*max | 0.128 - 0.886 | 1.0 *min - 1.0 *max |
| 'BG 2' | 2.237*min - 2.237*max | 0.447*min - 0.447*max | 0.128 - 0.886 | 1.0 *min - 1.0 *max |
| 'BG 3' | 2.0 *min - 2.0 *max | 0.5 *min - 0.5 *max | 0.128 - 0.886 | 1.0 *min - 1.0 *max |
| 'BG 4' | 1.618*min - 1.618*max | 0.618*min - 0.618*max | 0.128 - 0.886 | 1.0 *min - 1.0 *max |
| 'BG 5' | 1.414*min - 1.414*max | 0.707*min - 0.707*max | 0.128 - 0.886 | 1.0 *min - 1.0 *max |
| 'BG 6' | 1.272*min - 1.272*max | 0.786*min - 0.786*max | 0.128 - 0.886 | 1.0 *min - 1.0 *max |
| 'BG 7' | 1.171*min - 1.171*max | 0.854*min - 0.854*max | 0.128 - 0.886 | 1.0 *min - 1.0 *max |
| 'BG 8' | 1.128*min - 1.128*max | 0.886*min - 0.886*max | 0.128 - 0.886 | 1.0 *min - 1.0 *max |
|-------------------|------------------------|------------------------|-----------------------|-----------------------|
🔶 SETTINGS
🔹 Swings
Minimum Swing Length: Minimum length used for the swing detection.
Maximum Swing Length: Maximum length used for the swing detection.
🔹 Patterns
Toggle Pattern Block
Toggle separate pattern in each Pattern Block
🔹 Tolerance
Fibonacci Ratio: Adds a percentage tolerance below/above the ratio when only one ratio applies, creating two limits.
Triangle Area Ratio: Filters patterns based on the ratio of the smallest triangle to the largest triangle.
🔹 Display
Labels: Display Pattern Names, Arrows or nothing
Patterns: Display or not
Last Line: Display previous C-D line when updated
🔹 Style
Colors: Pattern Lines/Names/Arrows - background color of patterns
Text Size: Text Size of Pattern Names/Arrows
🔹 Calculation
Calculated Bars: Allows the usage of fewer bars for performance/speed improvement
Divides company with IndexOverview:
This indicator simplifies the comparison of a stock's performance against a specified index, such as the Nifty 50. By calculating and plotting the ratio between the two, it provides a clear visual representation of relative strength.
Key Features:
-Direct Comparison: Easily compare any stock against a selected index.
-Customizable Index: Choose from a dropdown menu or input a custom index symbol.
-Visual Clarity: Maximizing the chart provides a clear view of the relative performance.
-SMA Overlay: Add a Simple Moving Average (SMA) to identify trends and potential entry/exit
points.
-Customizable Appearance: Adjust background color, text color, and label size for personalized
visualization.
How to Use:
Add the Indicator: Add the indicator to your chart.
Select the Index: Choose the desired index from the dropdown menu or input a custom symbol.
Analyze the Ratio:
-A rising ratio indicates the stock is outperforming the index.
-A falling ratio suggests underperformance.
-The SMA can help identify potential trends and momentum.
Customize the Appearance: Adjust the background color, text color, and label size to suit your preferences.
Benefits:
-Improved Decision Making: Gain insights into a stock's relative strength.
-Faster Analysis: Quickly compare multiple stocks against a benchmark index.
-Enhanced Visualization: Customize the chart for better understanding.
-By leveraging this indicator, you can make informed trading decisions and gain a deeper
understanding of market dynamics.
B-Xtrender By Neal inspired from @PuppytherapyThanks to @puppytherapy for creating the original B-Xtrender indicator, available at this link: B-Xtrender by @QuantTherapy
I played around the code to have entry and exit condition. The B-Xtrender @QuantTherapy
indicator is a momentum-based tool designed to help traders identify potential trade opportunities by tracking shifts in market momentum. Using a smoothed momentum oscillator, it detects changes in trend direction and provides clear signals for entry and exit points.
Features
Momentum Detection:
Tracks market momentum using the BX-Trender Oscillator.
Green bars indicate bullish momentum, while red bars indicate bearish momentum.
Lighter shades of green/red reflect weakening momentum.
Entry and Exit Signals:
Entry Condition: A long trade is triggered when the oscillator changes from red to green .
Exit Condition: A long trade exit is triggered when the oscillator changes from green to red .
Dynamic PnL Calculation:
Automatically calculates profit or loss in percentage (%) when a trade is exited.
Positive PnL values are prefixed with `+`, and negative values are shown as `-`.
Clear Visualization:
Bar chart-style oscillator in a separate pane for better trend visualization.
Trade labels on the main price chart for clear entry and exit points.
Inputs
Short-Term Momentum Parameters:
Short - L1: Length of the first EMA for short-term momentum calculations.
Short - L2: Length of the second EMA for short-term momentum calculations.
Short - L3: RSI smoothing period applied to the short-term momentum.
Long-Term Momentum Parameters:
Long - L1: Length of the EMA for long-term momentum calculations.
Long - L2: RSI smoothing period applied to the long-term momentum.
Entry and Exit Logic
Entry Condition:
A long trade is triggered when:
The BX-Trender Oscillator changes from red to green .
This shift indicates bullish momentum.
Exit Condition:
A long trade exit is triggered when:
The BX-Trender Oscillator changes from green to red .
This shift indicates a loss of bullish momentum or the start of bearish momentum.
PnL Calculation:
When exiting a trade, the indicator calculates the profit or loss as a percentage of the entry price.
Example:
A profit is displayed as +5.67% .
A loss is displayed as -3.21% .
Visualization
Oscillator Bars:
Green Bars: Represent increasing bullish momentum.
Light Green Bars: Represent weakening bullish momentum.
Red Bars: Represent increasing bearish momentum.
Light Red Bars: Represent weakening bearish momentum.
Just make sure that you checked off the B-Xtrend oscillator off from the style so chart can be active
Trade Labels:
Entry Labels: Displayed below the candle with the text Entry, long .
Exit Labels: Displayed above the candle with the text Exit .
Bar Chart Pane:
The oscillator is displayed in a separate pane for clear trend visualization.
Default Style
Oscillator Colors:
Green for bullish momentum.
Red for bearish momentum.
Light green and light red for weaker momentum.
Trade Labels:
Green labels for entries.
Red labels for exits, with percentage PnL displayed.
Use Cases
Momentum-Based Entries:
Detects shifts in momentum from bearish to bullish for precise trade entry points.
Trend Reversal Detection:
Identifies when bullish momentum weakens, signaling an exit opportunity.
Visual Simplicity:
Offers an intuitive way to track trends with its bar chart-style oscillator and clear trade labels.
This indicator doesn't indicate that it will work perfectly. More updates on the way.
