GKD-C Larry Williams Proxy Index [Loxx]Giga Kaleidoscope Larry Williams Proxy Index is a Confirmation module included in Loxx's "Giga Kaleidoscope Modularized Trading System".
█ Giga Kaleidoscope Modularized Trading System
What is Loxx's "Giga Kaleidoscope Modularized Trading System"?
The Giga Kaleidoscope Modularized Trading System is a trading system built on the philosophy of the NNFX (No Nonsense Forex) algorithmic trading.
What is an NNFX algorithmic trading strategy?
The NNFX algorithm is built on the principles of trend, momentum, and volatility. There are six core components in the NNFX trading algorithm:
1. Volatility - price volatility; e.g., Average True Range, True Range Double, Close-to-Close, etc.
2. Baseline - a moving average to identify price trend
3. Confirmation 1 - a technical indicator used to identify trends
4. Confirmation 2 - a technical indicator used to identify trends
5. Continuation - a technical indicator used to identify trends
6. Volatility/Volume - a technical indicator used to identify volatility/volume breakouts/breakdown
7. Exit - a technical indicator used to determine when a trend is exhausted
How does Loxx's GKD (Giga Kaleidoscope Modularized Trading System) implement the NNFX algorithm outlined above?
Loxx's GKD v1.0 system has five types of modules (indicators/strategies). These modules are:
1. GKD-BT - Backtesting module (Volatility, Number 1 in the NNFX algorithm)
2. GKD-B - Baseline module (Baseline and Volatility/Volume, Numbers 1 and 2 in the NNFX algorithm)
3. GKD-C - Confirmation 1/2 and Continuation module (Confirmation 1/2 and Continuation, Numbers 3, 4, and 5 in the NNFX algorithm)
4. GKD-V - Volatility/Volume module (Confirmation 1/2, Number 6 in the NNFX algorithm)
5. GKD-E - Exit module (Exit, Number 7 in the NNFX algorithm)
(additional module types will added in future releases)
Each module interacts with every module by passing data between modules. Data is passed between each module as described below:
GKD-B => GKD-V => GKD-C(1) => GKD-C(2) => GKD-C(Continuation) => GKD-E => GKD-BT
That is, the Baseline indicator passes its data to Volatility/Volume. The Volatility/Volume indicator passes its values to the Confirmation 1 indicator. The Confirmation 1 indicator passes its values to the Confirmation 2 indicator. The Confirmation 2 indicator passes its values to the Continuation indicator. The Continuation indicator passes its values to the Exit indicator, and finally, the Exit indicator passes its values to the Backtest strategy.
This chaining of indicators requires that each module conform to Loxx's GKD protocol, therefore allowing for the testing of every possible combination of technical indicators that make up the six components of the NNFX algorithm.
What does the application of the GKD trading system look like?
Example trading system:
Backtest: Strategy with 1-3 take profits, trailing stop loss, multiple types of PnL volatility, and 2 backtesting styles
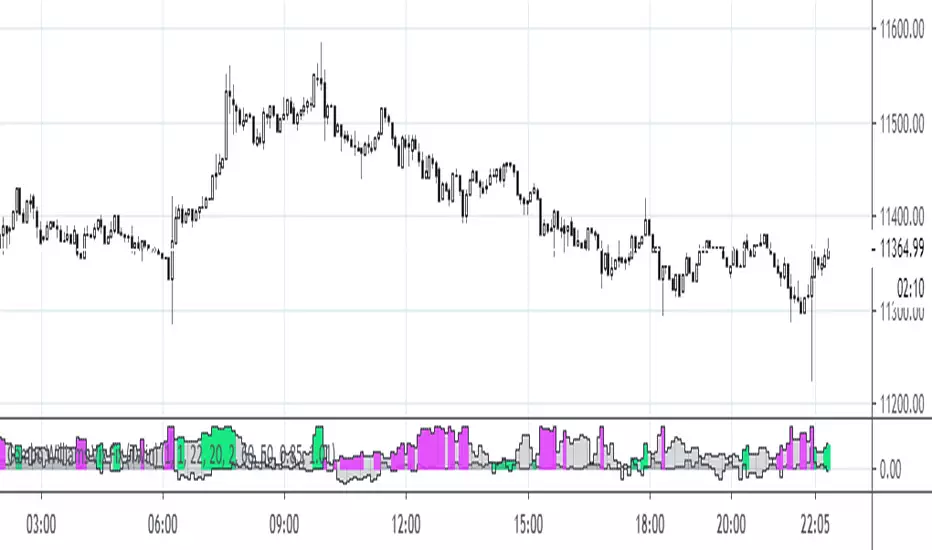
Baseline: Hull Moving Average as shown on the chart above
Volatility/Volume: Volatility Ratio as shown on the chart above
Confirmation 1: Larry Williams Proxy Index as shown on the chart above
Confirmation 2: Williams Percent Range
Continuation: Fisher Transform
Exit: Rex Oscillator
Each GKD indicator is denoted with a module identifier of either: GKD-BT, GKD-B, GKD-C, GKD-V, or GKD-E. This allows traders to understand to which module each indicator belongs and where each indicator fits into the GKD protocol chain.
Giga Kaleidoscope Modularized Trading System Signals (based on the NNFX algorithm)
Standard Entry
1. GKD-C Confirmation 1 Signal
2. GKD-B Baseline agrees
3. Price is within a range of 0.2x Volatility and 1.0x Volatility of the Goldie Locks Mean
4. GKD-C Confirmation 2 agrees
5. GKD-V Volatility/Volume agrees
Baseline Entry
1. GKD-B Baseline signal
2. GKD-C Confirmation 1 agrees
3. Price is within a range of 0.2x Volatility and 1.0x Volatility of the Goldie Locks Mean
4. GKD-C Confirmation 2 agrees
5. GKD-V Volatility/Volume agrees
6. GKD-C Confirmation 1 signal was less than 7 candles prior
Continuation Entry
1. Standard Entry, Baseline Entry, or Pullback; entry triggered previously
2. GKD-B Baseline hasn't crossed since entry signal trigger
3. GKD-C Confirmation Continuation Indicator signals
4. GKD-C Confirmation 1 agrees
5. GKD-B Baseline agrees
6. GKD-C Confirmation 2 agrees
1-Candle Rule Standard Entry
1. GKD-C Confirmation 1 signal
2. GKD-B Baseline agrees
3. Price is within a range of 0.2x Volatility and 1.0x Volatility of the Goldie Locks Mean
Next Candle:
1. Price retraced (Long: close < close or Short: close > close )
2. GKD-B Baseline agrees
3. GKD-C Confirmation 1 agrees
4. GKD-C Confirmation 2 agrees
5. GKD-V Volatility/Volume agrees
1-Candle Rule Baseline Entry
1. GKD-B Baseline signal
2. GKD-C Confirmation 1 agrees
3. Price is within a range of 0.2x Volatility and 1.0x Volatility of the Goldie Locks Mean
4. GKD-C Confirmation 1 signal was less than 7 candles prior
Next Candle:
1. Price retraced (Long: close < close or Short: close > close )
2. GKD-B Baseline agrees
3. GKD-C Confirmation 1 agrees
4. GKD-C Confirmation 2 agrees
5. GKD-V Volatility/Volume Agrees
PullBack Entry
1. GKD-B Baseline signal
2. GKD-C Confirmation 1 agrees
3. Price is beyond 1.0x Volatility of Baseline
Next Candle:
1. Price is within a range of 0.2x Volatility and 1.0x Volatility of the Goldie Locks Mean
3. GKD-C Confirmation 1 agrees
4. GKD-C Confirmation 2 agrees
5. GKD-V Volatility/Volume Agrees
█ Larry Williams Proxy Index
What is Larry Williams Proxy Index ?
Larry Williams Proxy Index also known as the Larry Williams COT (Commitment of Traders) Proxy Index. This is a popular indicator among the Forex community created by the famous trader Larry Williams . This is an inverse oscillator so the longs happen below the middle line, and shorts happen above. This is an inverse indicator. Over zeroline is short, under is long.
Requirements
Inputs
Confirmation 1 and Solo Confirmation: GKD-V Volatility / Volume indicator
Confirmation 2: GKD-C Confirmation indicator
Outputs
Confirmation 2 and Solo Confirmation: GKD-E Exit indicator
Confirmation 1: GKD-C Confirmation indicator
Continuation: GKD-E Exit indicator
Additional features will be added in future releases.
Tìm kiếm tập lệnh với "williams"

Phase Accumulation, Smoothed Williams %R Histogram [Loxx]Phase Accumulation, Smoothed Williams %R Histogram is a Williams %R indicator using dynamic inputs from Ehlers Phase Accumulation Dominant Cycle Period Algorithm. This indicator includes alerts and signals and is in a smoothed histogram form. The version of Phase Accumulation in this indicator is a modified form of of Ehlers algorithm to allow for better smoothing and cycle length selection.
What is Williams %R?
Williams %R , also known as the Williams Percent Range, is a type of momentum indicator that moves between 0 and -100 and measures overbought and oversold levels. The Williams %R may be used to find entry and exit points in the market. The indicator is very similar to the Stochastic oscillator and is used in the same way. It was developed by Larry Williams and it compares a stock’s closing price to the high-low range over a specific period, typically 14 days or periods.
What is Phase Accumulation?
The phase accumulation method of computing the dominant cycle is perhaps the easiest to comprehend. In this technique, we measure the phase at each sample by taking the arctangent of the ratio of the quadrature component to the in-phase component. A delta phase is generated by taking the difference of the phase between successive samples. At each sample we can then look backwards, adding up the delta phases.When the sum of the delta phases reaches 360 degrees, we must have passed through one full cycle, on average.The process is repeated for each new sample.
The phase accumulation method of cycle measurement always uses one full cycle’s worth of historical data.This is both an advantage and a disadvantage.The advantage is the lag in obtaining the answer scales directly with the cycle period.That is, the measurement of a short cycle period has less lag than the measurement of a longer cycle period. However, the number of samples used in making the measurement means the averaging period is variable with cycle period. longer averaging reduces the noise level compared to the signal.Therefore, shorter cycle periods necessarily have a higher out- put signal-to-noise ratio.
Included:
-Toggle on/off bar coloring
-Toggle on/off signals
-Alerts long/short
-Loxx's Expanded Source Types Library

Abacus Community Williams %R + Bollinger %B📌 Indicator Description (Professional & Clear)
Williams %R + Bollinger %B Momentum Indicator (ThinkOrSwim Style)
This custom indicator combines Williams %R and Bollinger %B into a single, unified panel to provide a powerful momentum-and-positioning view of price action. Modeled after the ThinkOrSwim version used by professional traders, it displays:
✅ Williams %R (10-period) – Yellow Line
This oscillator measures the market's position relative to recent highs and lows.
It plots on a 0% to 100% scale, where:
80–100% → Overbought region
20–0% → Oversold region
50% → Momentum equilibrium
Williams %R helps identify exhaustion, trend strength, and potential reversal zones.
✅ Bollinger %B (20, 2.0) – Turquoise Histogram Bars
%B shows where price is trading relative to the Bollinger Bands:
Above 50% → Price is in the upper half of the band (bullish pressure)
Below 50% → Price is in the lower half (bearish pressure)
Near 100% → Price pushing upper band (possible breakout)
Near 0% → Price testing lower band (possible breakdown)
The histogram visually represents momentum shifts in real time, creating a clean profile of volatility and strength.
🎯 Why This Combination Works
Together, Williams %R and Bollinger %B reveal:
Momentum direction
Overbought/oversold conditions
Volatility compression & expansion
Trend continuation vs reversal zones
High-probability inflection points
Williams %R shows oscillation and exhaustion, while %B shows pressure inside volatility bands.
The combination helps identify whether momentum supports the current trend or is weakening.
🔍 Use Cases
Detect early trend reversals
Validate breakouts and breakdowns
Spot momentum failure in price extremes
Confirm pullbacks and continuation setups
Time entries and exits with higher precision
💡 Best For
Swing traders
Momentum traders
Trend-followers
Options traders (for timing premium decay or volatility expansion)

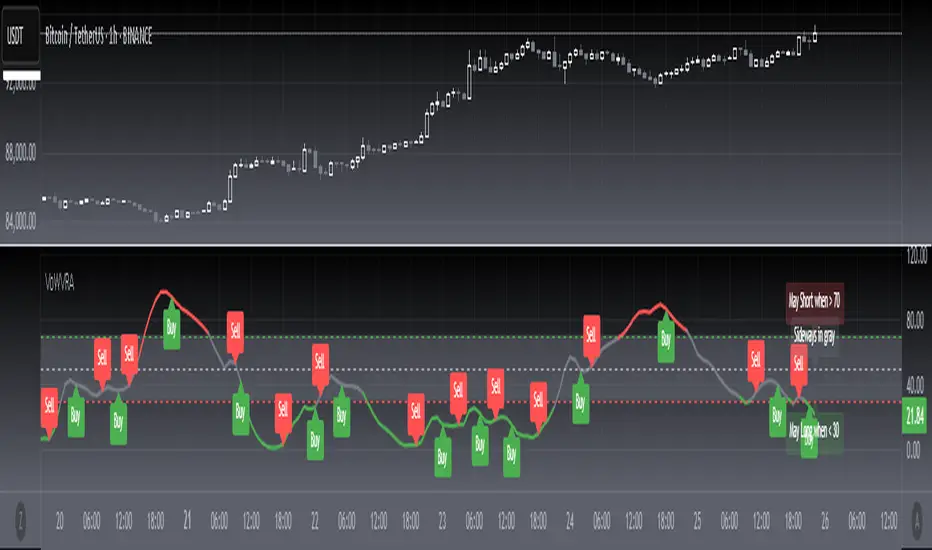
[blackcat] L2 Votatility of Williams VixFix Risk AssessmentHey there! I previously wrote an article about the Larry Williams ViX Fix technical indicator. Soon after, friends from the TradingView community told me that this indicator could be combined with the Risk Assessment indicator I wrote about earlier to determine when to go long or short. At the time, I found it a bit cumbersome to use both indicators together, so I came up with a solution: to merge them. This way, we can use one technical indicator to visually see whether we should go long or short. Isn't that cool? The indicator has a very common name: ** L2 Votatility of Williams VixFix Risk Assessment, or VoWVRA for short.**
This TradingView Pine Script is a custom indicator based on the Larry Williams ViX Fix technical indicator, designed to help traders with risk assessment and trading decisions. The Larry Williams ViX Fix indicator is derived from the volatility of the S&P 500 index and is mainly used to display changes in current market sentiment. The indicator determines market volatility by calculating the distance between the highest price, the lowest price, and the closing price. The higher the value of the indicator, the more tense the market sentiment, and the higher the market volatility; conversely, the lower the value, the more stable the market sentiment and the lower the market volatility.
The VoWVRA indicator is based on the Larry Williams ViX Fix indicator, combined with technical indicators such as Bollinger Bands and EMA, to assess market risk. The indicator can be customized with input parameters to suit different markets and investor needs. Using the VoWVRA indicator can help traders make wiser choices in risk control and trading decisions.
In addition, this TradingView Pine Script also includes a risk assessment indicator. The indicator calculates a series of values and then applies the exponential moving average (EMA) to the percentage change between the closing price and the highest and lowest prices within a certain range to determine the safety level. The safety level is then compared to different thresholds to determine the market's risk level. The risk assessment indicator can be customized with input parameters such as risk length, safety length, and EMA length to suit different market conditions and investor preferences. Using the risk assessment indicator can help traders make wiser decisions in risk management and trading strategies.
By using the VoWVRA and risk assessment indicators, traders can more accurately assess market risk and make wiser choices in trading decisions.
🔹 Williams %R x2🔹 Williams %R x2 — Dual Williams %R Oscillator (MTF)
Williams %R x2 is an enhanced version of the classic Williams Percent Range indicator, allowing you to display two independent %R lines with separate parameters and multi-timeframe (MTF) support.
This tool is ideal for precise entry timing, spotting reversals, identifying extreme zones, and confirming momentum shifts.
✨ Indicator Features
1. Two Independent Williams %R Inputs
Separate period settings
Individual price sources
Custom line colors
Configurable overbought/oversold levels
Ability to enable or disable each oscillator independently
2. Multi-Timeframe (MTF) Mode
Each %R can be calculated on:
the current chart timeframe
or any higher/lower timeframe selected by the user (from M1 to MN)
This allows flexible combinations such as:
local %R for entries
higher-timeframe %R for trend filtering
3. Built-in Levels
OB/OS levels for each oscillator
Central midpoint level at −50
Fully customizable level colors
🎯 Use Cases
Detecting short-term reversals
Assessing momentum and timing entries
Applying SMC/ICT confirmation models
Filtering signals with higher-timeframe structure
Identifying extreme price conditions
🛠️ Technical Details
Fully compatible with Pine Script® v6
No repainting
Clean and minimal oscillator without unnecessary elements

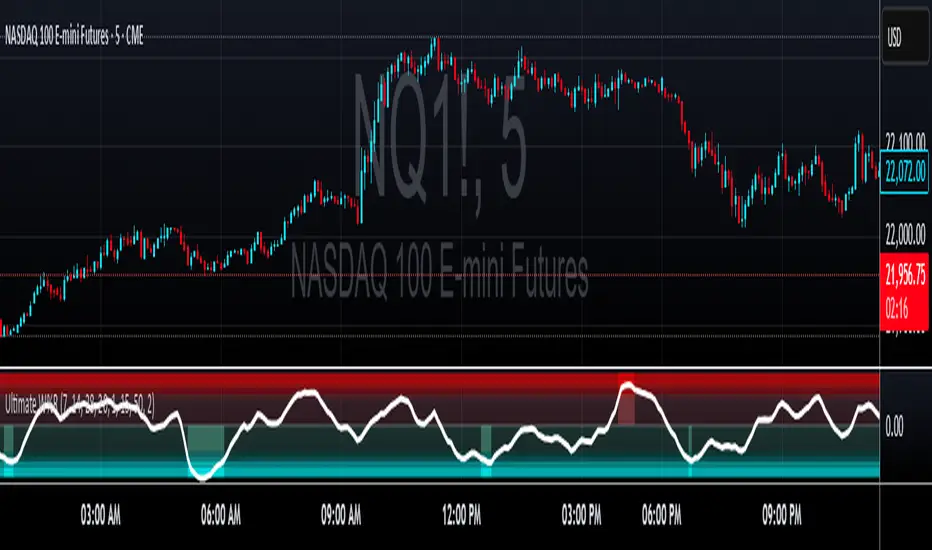
Ultimate Williams %RUltimate Williams %R
The most advanced Williams %R indicator available - featuring multi-timeframe analysis, zero-lag processing, volatility adaptivity, and intelligent extreme zone detection.
Key Improvements Over Standard Williams %R
Multi-Timeframe: Combines short, medium, and long-term Williams %R calculations with Ultimate Oscillator-style weighting for superior signal quality
Zero-Lag Implementation: Utilizes Ehler's Zero-Lag EMA with error correction, eliminating traditional oscillator lag while maintaining smoothness
Volatility Adaptive: Automatically adjusts periods based on ATR volatility analysis for optimal performance in all market conditions
Z-Score Normalization: Provides consistent, statistically-based extreme level detection across different market environments
Perfect For
Overbought/Oversold Identification: Instantly spot extreme market conditions with visual intensity that scales with signal strength
Divergence Analysis: Enhanced responsiveness and smooth operation make divergence patterns clearer and more reliable
Multi-Timeframe Confirmation: Built-in timeframe combination eliminates the need for multiple Williams %R indicators
Entry/Exit Timing: Zero-lag processing provides earlier signals without sacrificing accuracy
Customizable Settings
Timeframe Periods: Adjustable short (7), medium (14), and long (28) periods
Volatility Adaptation: Configurable ATR-based period adjustment
Zero-Lag Processing: Toggle and fine-tune the smoothing system
Z-Score Normalization: Adjustable lookback period for statistical analysis
Extreme Levels: Customizable threshold for extreme signal detection
MTF Williams Vix Market Bottoms [CryptoSea]MTF Williams Vix Fix Indicator is a dynamic tool tailored for traders looking to capture market extremes with high precision. This multi-timeframe indicator leverages the concept of the Williams Vix Fix to spot potential reversals before they occur.
Key Features
Multi-Timeframe Analysis: Provides simultaneous visibility across multiple timeframes, enabling traders to assess market conditions comprehensively from a single chart.
Advanced Volatility Detection: Utilizes a modified Vix Fix formula to highlight extreme price deviations, which often precede significant market reversals.
Customizable Settings: Offers extensive input options to tweak the lookback periods, percentile thresholds, and visibility settings, aligning with various trading strategies.
Visual Band Indicators: Features upper bands and range highs that signal potential overbought and oversold conditions, enhancing trading decision-making.
Below, you can see how the indicator performs across different timeframes, providing valuable insights into market behavior.
How it Works
Vix Fix Calculation: Determines the worst-case 'panic' sell-offs in price as a percentage of the high, capturing the emotional extremes of the market.
Statistical Bands: Employs Bollinger bands over the Vix Fix values to define normal and extreme volatility conditions.
Color-Coded Indicators: Uses color differentiation to instantly highlight when readings surpass critical upper band or range high thresholds, signaling key trading opportunities.
For instance, in the analysis provided below, notice how the indicator flags significant market moves, allowing traders to anticipate potential entry or exit points.
Application
Risk Management: Aids in identifying extreme market conditions where prices may revert, helping in effective position sizing and risk management.
Strategic Planning: Enhances strategic trading plans by identifying not only when but also where market extremes may occur, considering multiple timeframes.
Customization: Adapts seamlessly to different market environments with adjustable settings for volatility thresholds and visual display preferences.
The MTF Williams Vix Fix Indicator by is an essential tool for traders aiming to leverage market volatility for optimal entry and exit, ensuring they are well-equipped to handle market extremes with confidence.

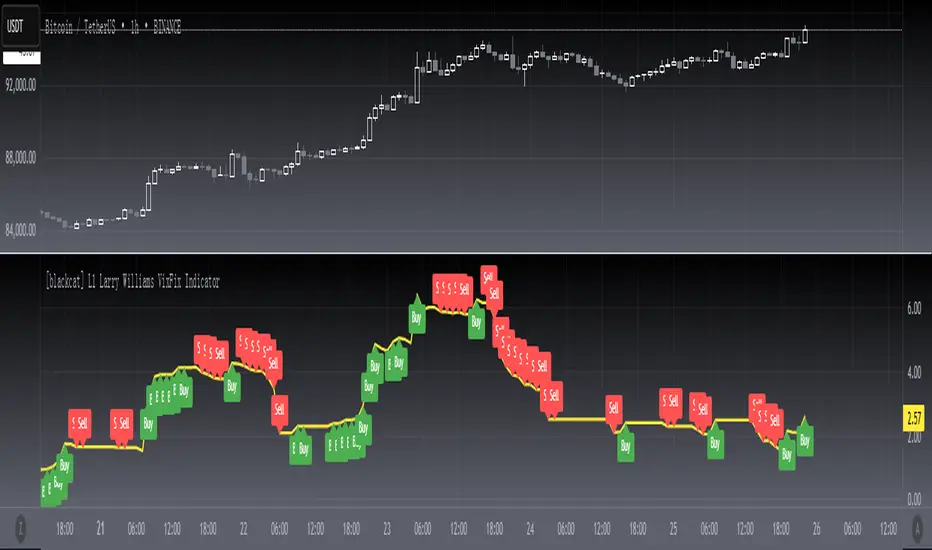
[blackcat] L1 Larry Williams VixFix IndicatorLevel : L1
Larry Williams, had this idea to create a synthetic VIX for more than just the main stock indices. Check out the formula for Williams VixFix:
```
VIX Fix Formula = (Highest(Close, 22) – Low) / (Highest(Close, 22)) * 100
```
What does this even mean? In normal person terms, here's what it's all about:
1. Find the highest close over the last 22 days and subtract today's low (or the current bar).
2. Divide that by the highest close of the past 22 days.
3. Multiply the result by 100 to "normalize" the indicator.
Why 22 days, you ask? That's how long the normal month of trading days is.
So, you see, the formula is pretty chill. It's just a way to measure the price volatility of the last 22 trading days. It's a bit of a lagging indicator, but it gets the job done.
Here my version of this scriptcreates a custom technical indicator called "L1 Larry Williams VixFix" that measures the distance between the highest high and the lowest low of a security's price over a specified period.
The user can adjust the period length and source price used in the VixFix calculation. The period length is set to 22 by default, but can be modified by the user with the "Length" input parameter. The source price is set to "close" by default, meaning it will use the closing price of each bar to calculate the VixFix. However, the user can also choose a different type of price data, such as open, high, or low.
The VixFix is calculated as a percentage of the difference between the highest close and the lowest low over the specified period. This percentage is then multiplied by 100 to create a more readable value.
Finally, the code plots the VixFix line on the chart with a yellow color and a thickness of 2. This allows the user to easily visualize the VixFix value and incorporate it into their trading decisions.
Overall, this script provides a powerful tool for technical analysis that can help traders identify potential trend changes and market reversals.
ToTitans - Williams Alligator with Life LineWhat Is It?
Legendary trader Bill Williams, an early pioneer of market psychology, developed the trend-following Alligator indicator, which follows the premise that financial markets and individual securities trend just 15% to 30% of the time while grinding through sideways ranges the other 70% to 85% of the time. Williams believed that individuals and institutions tend to collect most of their profits during strongly trending periods. You also can find more detail here www.investopedia.com
Differentiation
Add Fill the line as a cloud for easier chart interpretation / trend interpretation
Add EMA 5 (Life Line) for using with Going through the cloud and Exiting from the cloud
This indicator has been used in AJ Jim class for "Type 2" approach
Suitable for
Intra Day Trading (20m-2h)
TFEX:S501!
"PM me to obtain access"

Stochastics + CM Williams VixFix (Simple Buy Signal)📈 Stochastics + CM Williams VixFix (Simple Buy Signal)
This indicator combines two powerful tools to detect potential bottoming opportunities:
✅ Stochastics: Looks for momentum reversals. A signal is triggered when both %K and %D are below the oversold threshold (default: 20), suggesting the asset is deeply oversold.
✅ CM Williams Vix Fix: A volatility-based fear detector. When it spikes above its dynamic threshold, it indicates potential panic selling — often preceding a market bounce.
💡 Buy Signal is generated when:
%K and %D are both below 20
VixFix shows a volatility spike (green condition)
Use this script to identify high-probability reversal setups, especially during market corrections or panic phases.
A Better Fractal (Williams)DESCRIPTION:
This is a more advanced version of the classic Williams Fractal algo, using a looped barindex iterator to examine highs/lows.
You may choose ideal or regular fractals, along with the amount of bars (periods) used to calculate; the minimum being 3. Oddnums only.
Ideal fractals = fractals with each bar needing to be lower/higher than the preceding bar, with the midbar at the apex.
Regular fractals = the typical Williams fractal, wherein each bar only has to be lower/higher than the midbar (apex) only.
How to trade? Combine with other indicators and use breakout or reversal strategies, typically. Set buy/sell stops at the high/low of a fractal, for instance
... to trade the breakout when it occurs. Or, track momentum when a fractal prints and trade accordingly. Or perhaps trade with the alligator or 3 EMA.
Experiment with different types of fractals to achieve the desired result, with higher period fractals obviously offering more solid indication though with higher lag.
Note: A fractal does not print until n/2 (rounded down) bars after, where n = the period you chose.

(mab) Williams %R, RSI, Stochastic and Stochastic RSIThis indicator can display a Williams %R and a second oscillator at the same time. RSI , Stochastic or Stochastic RSI can be displayed as second oscillator. Williams %R is configured with 21 length by default and adds a 13 EMA on it (like used by TRI ). There is an option to display divergences on the oscillators.

Bill Williams SystemBill Williams System combine all indicators of Mr. Bill Williams into one window with detail below:
1. Top of window:
Display Fractals with shape triangle down is bottom fractal and shape triangle up is top fractal
2. Bottom of window:
Display Alligator Trend Flat with trend defined as below:
* Up trend: Lips value shift 3 bars greater than Teeth value shift 5 bars. And Teeth value shift 5 bars greater than Jaws value shift 8 bars. By default up trend is green square.
* Down trend: Lips value shift 3 bars less than Teeth value shift 5 bars. And Teeth value shift 5 bars less than Jaws value shift 8 bars. By default down trend is red square.
* Choppy: not up trend and not down trend. By default choppy is gray square.
3. Moving around zero line
* Awesome Oscillator is circles.
* Accelerator Oscillator is columns.
* Gator Oscillator is area.

Celasor Normalized ATR with Williams %RNormalized Average True Range combined with Williams %R - Celasor 04/2020.
Indicator can be used for identifying potential market bottoms with the following criteria: Normalized ATR is above 80% and Williams %R is below -80.
This script combines both indicators and displays bars to mark where conditions are met. Future updates may include selectable smoothing.

Bill Williams Divergent BarsBill William Bull/Bear divergent bars
See: Book, Trading Chaos by Bill Williams
Coded by polyclick
A bullish (green) divergent bar, signals a trend switch from bear -> bull
-> The current bar has a lower low than the previous bar, but closes in the upper half of the candle.
-> This means the bulls are pushing from below and are trying to take over, potentially resulting in a trend switch to bullish.
-> We also check if this bar is below the three alligator lines to avoid false positives.
A bearish (red) divergent bar, signals a trend switch from bull -> bear
-> The current bar has a higher high than the previous bar, but closes in the lower half of the candle.
-> This means the bears are pushing the price down and are taking over, potentially resulting in a trend switch to bearish.
-> We also check if this bar is above the three alligator lines to avoid false positives.
Best used in combination with the Bill Williams Alligator indicator.

Vince/Williams Bloodbath Sidestepping RuleThis is a defensive risk management tool designed to keep you on the sidelines during devastating market crashes. Drawing on the "Bloodbath" criteria outlined by Vince and Williams, this script highlights periods where market internals have structurally broken down, specifically when the percentage of New Lows exceeds a "danger" threshold (default 4%).
Unlike the Climax signal which looks for the end of a drop, this rule is designed to spot the acceleration phase of a decline. When the background turns red, it indicates that the market is in a liquidating phase where support levels are likely to fail. You should use this as a strict filter to avoid opening new long positions or to tighten stops on existing ones until the background color clears, signaling that the internal bleeding has stopped.

RSI with Williams %R Coloringsimple fusion of RSI to seek divergence and williams % R coloring to see overbought/oversold price.
not my own work, just merely took two standard indicators and infused them.
Larry Williams Proxy Index Larry Williams Proxy Index indicator( Featured in No-Nonsense Forex Episode:https://www.youtube.com/watch?v=KkynxVPNL0E&t=49s)
How to use:
Go long when the line crosses below 50
Go short when the line crosses above 50
SMART4TRADER - Bill Williams Market Facilitation IndexThis indicator is written by 🔴 correct formula and for the correctness of the data is used by the Security function for the correct data request name from the open schedule, and not as usual with a similar ticker.
1️⃣ volume grows and MFI grows ➖ Green bar occurs when a growing volume and market dynamics. It signals us forward (down or up), that is, the number of transactions in the market is growing and they move the market in one specific side. Usually this bar is useless to enter the market, as the movement is already going, but it is very useful to determine the correctness of our entrance. In other words, if we are already in the market and see "green light" when a market hiking, for example, down, then we can be confident in the correctness of our entrance.
2️⃣ volume decreases and MFI decreases - Fuchsia (pink) ➖ "fading" bar appears in case of falling interest in the market in players, that is, the number of transactions (teak volume) decreases, and the market freezes (motion slows down). In trade, this bar is practically useless, although it often appears on the top of the first wave of Elliot.
3️⃣ volume decreases, and MFI grows - gray ➖ "fake" bar manifests when the activity of the market is growing with a decrease in volumes. This is an ambiguous bar and no sense from him. It is just necessary to understand that the market is moving, despite the decline in the activity of participants.
4️⃣ volume is growing, and MFI is reduced - blue ➖ "squatting" bar, perhaps the most interesting bar, since all movements end in a squatting bar, which may be, but not necessarily at the very bottom (vertex), and maybe near (one two bars). As stated in the book of Bill Williams, all the main trends end with the "squat" bar, which is among one of the three bars in the top or base.
--------------------------------
Этот индикатор написано по 🔴ПРАВИЛЬНОЙ ФОРМУЛЕ🔴 и для корректности данных используется функция SECURITY для правильного запроса данных имено с открытого графика, а не как обычно с похожего тикера.
1️⃣ Объем растет и MFI растет ➖ зеленый бар возникает при растущем объеме и динамике рынка. Он сигнализирует нам движение вперед (вниз или вверх), то есть количество сделок на рынке растет и они двигают рынок в одну определенную сторону. Обычно этот бар бесполезен для входа в рынок, так как движение уже идет, но он очень полезен для определения правильности нашего входа. Иными словами, если мы уже в рынке и видим «зеленый свет» при походе рынка, например, вниз, то мы можем быть уверенным в правильности нашего входа.
2️⃣ Объем снижается и MFI снижается – фуксия (розовый) ➖ «Увядающий» бар появляется в случае падения интереса к рынку у игроков, то есть количество сделок (тиковый объем) уменьшается, и рынок замирает (движение замедляется). В торговле этот бар практически бесполезен, хотя он часто появляется на вершине первой волны Эллиота.
3️⃣ Объем снижается, а MFI растет – серый ➖ «Фальшивый» бар проявляется, когда активность рынка растет при снижении объемов. Это неоднозначный бар и толку от него особо никакого нет. Просто надо понимать, что рынок движется, несмотря на снижение активности участников.
4️⃣ Объем растет, а MFI снижается – синий ➖ «Приседающий» бар, пожалуй, самый интересный бар, так как все движения заканчиваются приседающим баром, который может быть, но не обязательно в самом дне (вершине), а может быть рядом (один-два бара). Как говорится в книге Билла Вильямса, все основные тренды заканчиваются «приседающим» баром, который находится среди одного из трех баров в вершине или основании.

Triple Williams Alligator (MTF)This script is simply a Multi time frame version of the built in Williams Alligator script.
Higher time frame Alligators can often produce resistance and support as traders on different timeframes react to them. They can also act as a trend filter.
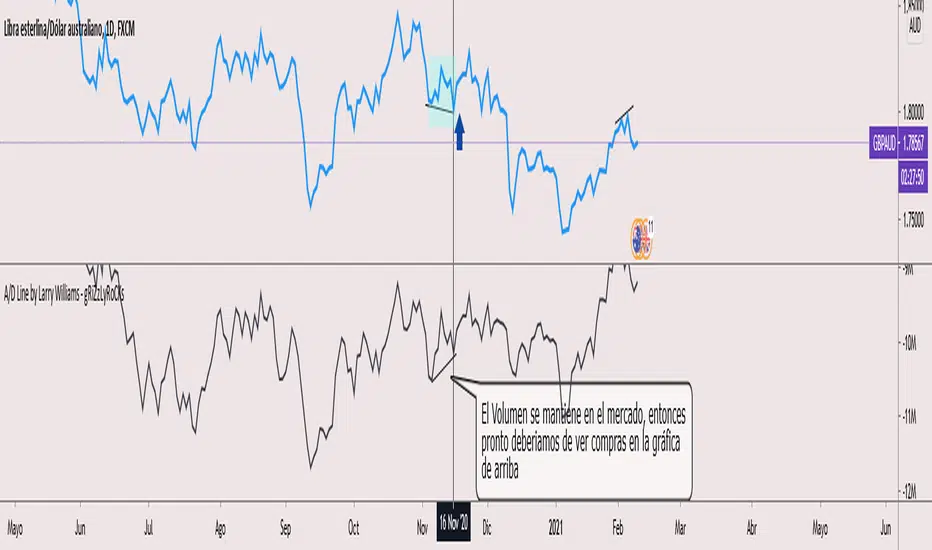
Larry Williams A/D Line - gRiZzLyRoCKsEs un script básico de seguimiento de volumen de operaciones tanto en compra como en venta, este script implementa un método del libro de Larry Williams "The secret of selecting stocks for immediate and substantial gains".
El script imprime un gráfico basado en el volumen de compras/ventas, el cual el usuario debera identificar las posibles divergencias para identificar "Professional Accumulation" o "Professional Distribution" para saber cuando vender o comprar con el las instituciones.
Carl's BOTTOM DETECTOR: Williams %R + normalized ATRThis script is based on Williams %r and normalized ATR.
When William%R indicates extreme oversold conditions
and the ATR indicates extreme volatility at the same time,
then it prints an arrow below the candle.
It is based on the concept that swing lows and market bottoms
are characterized by extreme oversold momentum and
extreme volatility.
The highest tf's like the daily, show you perfect market bottoms for btc.
If you zoom in it's still good to find swing highs and lows, if necessary
you can tweak the settings.
Next to that I added grey, red, and green vertical bands to the chart.
This is based on the VIX, the SPX volatility index.
Whenever the volatility of the S&P500 crosses above a specific level
it prints a colored background band behind the candle.
Grey means high volatility, red extreme volatility (like in the covid
crisis and 2008 crisis), and green means the same as grey, but indicates
it came after a red zone and could mean strong bullish bounce momentum.
You can tweak the thresholds for the grey/green and read areas.

Combo Williams Vix Fix (Twin version)This is a very powerful Williams' Vix Fix indicator.
My implementation of this wonderful indicator features both up and down movements. Both up & down flavors have two versions (fields tp and tp2, each having two values). Color can be reversed as desired (rev). By default colors show continuation, reversed colors show reversion (as intended originally).