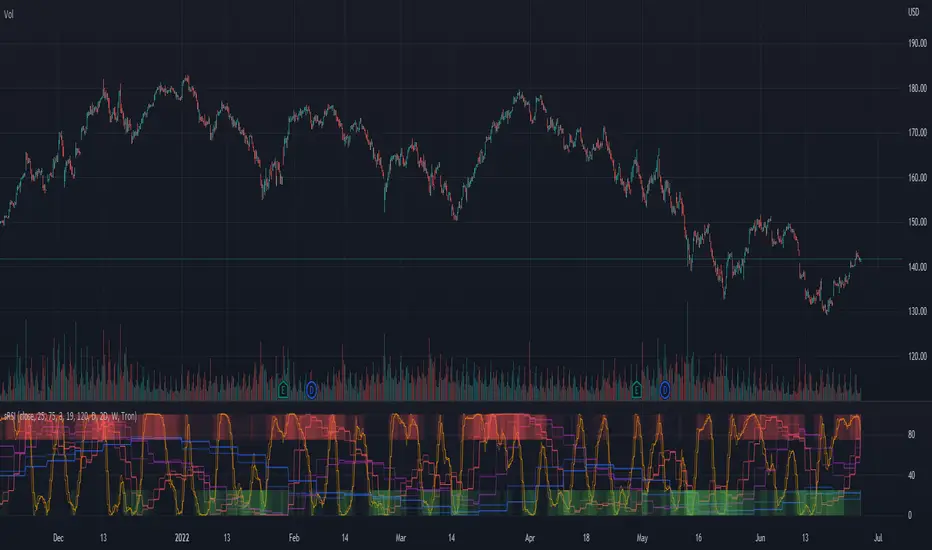
Multi-timeframe Stochastic RSIThe multi-timeframe stochastic RSI utilizes stochastic RSI signals from 11 different time-frames to indicate whether overbought/oversold signals are in agreement or not across time-frames. Ideally traders should enter and exit when conditions are in agreement as indicated by the intensity of the long (green) or short (red) bands at the top and bottom of the indicator. The intensity of the bands indicates how many of the time-frames are currently overbought/oversold.
Tìm kiếm tập lệnh với "电力行业+股票+11年涨幅"
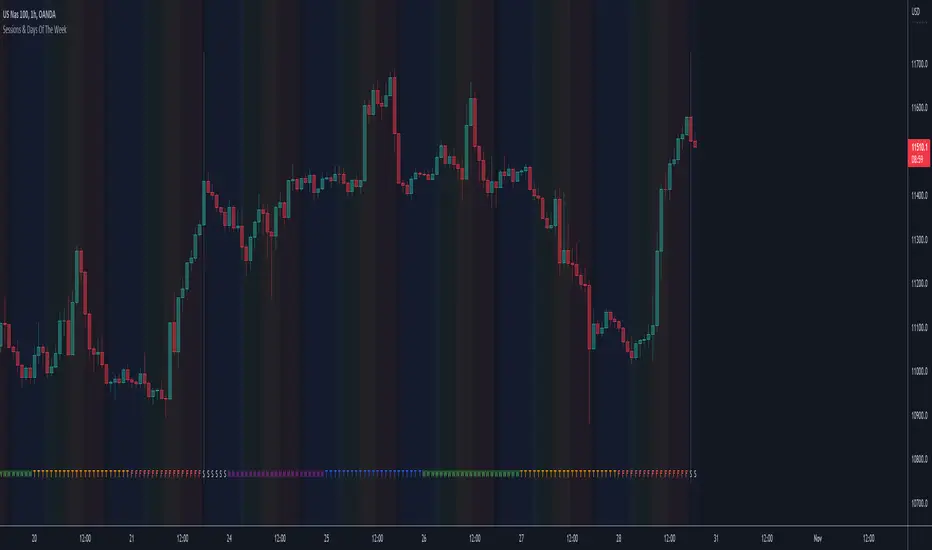
Sessions & Days Of The WeekTraders tend to focus their energy on specific sessions or time periods. This indicator will plot the days of the week, and also highlight the following sessions: Frankfurt (2:00am - 11:00am EST), London (3:00am - 12:00pm EST), New York (8:00am - 5:00pm EST), Sydney (5:00pm - 2:00am EST), Tokyo (7:00pm - 4:00am EST).
It’s important to be aware that Session Open and Close times will vary based on the time of year, as countries shift over to daylight savings time.
S&P Sector CorrelationScript for Macro:
This indicator shows the 9 day average of the correlation of the 11 S&P500 sectors with the security.
Recommend you use the indicator on SPX or SPY, but you can change the values to be compared.
GLHF
- DPT

Moving Average Trend█ OVERVIEW
This is a Moving Average Script that contains both a cloud and a ribbon that has independent MA-type selection.
⬆ green arrow up = up trend flip
⬇ red arrow down = down trend flip
🟢 Green Dot = Potential Long
🔴 Red Dot = Potential Short
█ CONCEPTS
1 — Cloud, like most trading algo, the cloud is made of 8 short term MA , with MA cross and MA cross (longema)
2 — Ribbon, this is by default turned off, the default values , an option in setting to change longema to look for ribbon cross
3 — Sequence, It goes from 1 – 9 at 9 the sequence resets. The sequence changes colour depending on if it’s a down trend(red) or uptrend(green) or an over extended trend (yellow)
Setup definitions
Red sell start = current close < the close 4 candles back
Yellow sell extended = current close < last close and current close < two closes back
Green buy start = current close > the close 4 candles back
Yellow buy extended = current close last close and current close < two closes back
This can help you find when it’s time to get out, or sit out of a choppy trend.
4 - Moving Average types:
sma = Simple Moving Average
ema = Exponential Moving Average
wma = Weighted Moving Average
vwma = Volume Weighted Moving Average
rma = Running Moving Average
alma = Arnaud Legoux Moving Average
hma = Hull Moving Average
jma = Jurik Moving Average
frama-o = frama
frama-m = frama mod
dema = Double Exponential Moving Average
tema = Triple Exponential Moving Average
zlema = Zero lag Exponential Moving Average
smma = Smoothed Moving Average
kma = kaufman Moving Average
tma = triangular Moving Average
gmma = Geometric Mean Moving Average
vida = Variable Index Dynamic Average
cma = Corrective Moving average
rema = Range Exponential Moving average
█ OTHER SECTIONS
• FEATURES: to describe the detailed features of the script, usually arranged in the same order as users will find them in the script's inputs.
• HOW TO USE
• LIMITATIONS: Like with any MA script there is a lag factor associated with is.
• RAMBLINGS: Experiment to your hearts content with all the MA types, I'm impartial to HMA as is
• NOTES: some of the MA's are more taxing, therefore take longer to load, be patience, this is a trimmed down version of an existing invite only script i have
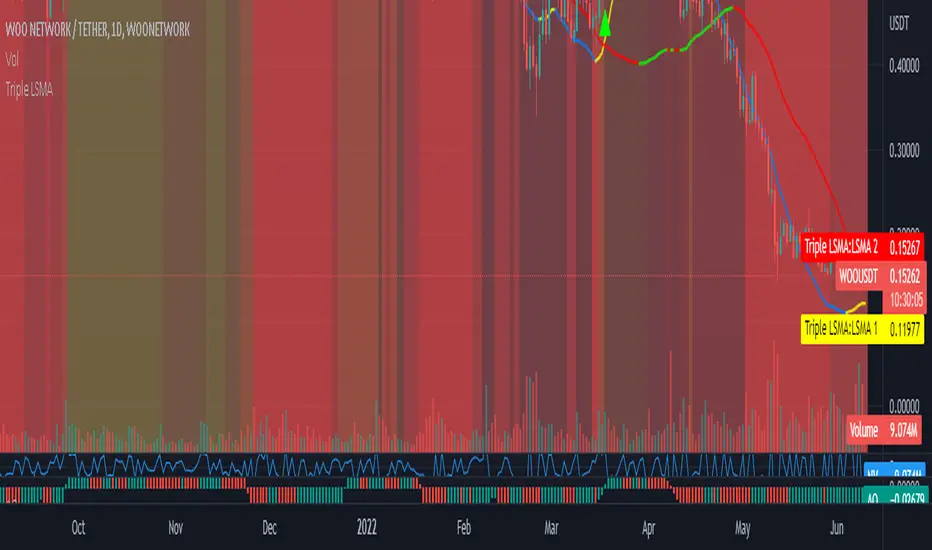
Triple Colored Least Squares Moving Average + Crossover AlertsThis script is forked from the ‘ Double Colored Least Squares Moving Average + Crossover Alerts ‘ from @IronKnightmare.
First release & notes : 2021-11-03.
Overview:
The Least Squares Moving Average is used mainly as a crossover signal to identify bullish or bearish trends. When a shorter duration line cross a longer one a trend can be identified. When multiple lines or the price action cross a longterm trend the confirmation can be further validated. Tradingview contains already some indicators with 1 or two LSMA trendlines that can be configured and toggled.
The original script that I forked had two LSMA lines that could be plotted with other valuable functions, I added a third for further confirmation as some trading systems will use three lines or some combination of those for validation.
Usage:
In inputs
- You will see LSMA 1, LSMA 2 & LSMA 3. The default values are 40, 100 & 400 representing the number of periods plotted by that line : fast, medium and slow changing trendlines will be plotted. The offset value and source are standard for most scripts.
In Style
- You can toggle LSMA 1, 2 or 3 and any combination of those. There are much more possibilities this way.
- For each LSMA, Color 0 & Color 1 are for coloring the slope of the trendline,
- Color 0 for rising slope,
- Color 1 for descending slope.
- The script will automatically color the rise or fall of the trendline accordingly. You can also set one identical color in both slopes for one unique color.
- The ‘ Long Crossover 1 on 2 ’ is a signal for when the LSMA 1 cross over the LSMA 2, usually a shorter periods trendline, more volatile, climbing over the medium term one. A Signal will be traced on the chart at that crossing, you can configure this. The ‘Short Crossover 1 on 2’ is when the LSMA 1 cross under the LSMA 2, a signal will be traced on the chart accordingly.
- The Long Crossover 1 on 3 & Short Crossover 1 on 3 act on the same principle, although the crossing of the fast LSMA on the long / slow LSMA are used. Both can be toggled.
- The ‘ Background Coloring Line 1 : 0-Neutral, 1-Up, 2-Down ’ is an optional background coloring for the LSMA1 line. This can provide additional information at a quick glance, especially if you combine the two other lines backgrounds, the partial transparency will compound.
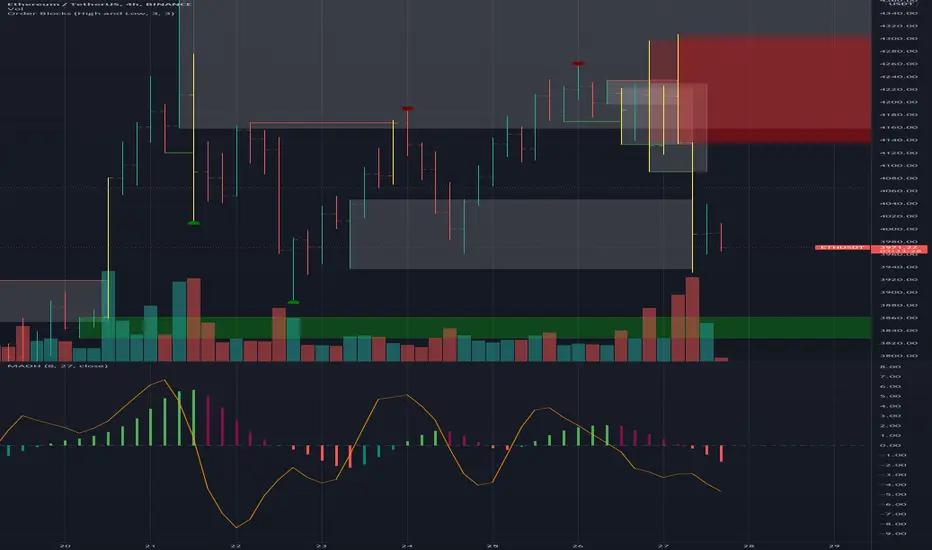
MAD indicator Enchanced (MADH, inspired by J.Ehlers)This oscillator was inspired by the recent J. Ehler's article (Stocks & Commodities V. 39:11 (24–26): The MAD Indicator, Enhanced by John F. Ehlers). Basically, it shows the difference between two move averages, an "enhancement" made by the author in the last version comes down to replacement SMA to a weighted average that uses Hann windowing. I took the liberty to add colors, ROC line (well, you know, no shorts when ROC's negative and no long's when positive, etc), and optional usage of PVT (price-volume trend) as the source (instead of just price).
Ehlers Error Correcting Exponential Moving Average [CC]The Error Correcting Exponential Moving Average was created by John Ehlers and Ric Way (Stocks & Commodities V. 28:11 (30-35)) and this is an excellent moving average that accurately identifies the trend and sticks with the price during trends or choppy periods pretty well. It looks back to find the best gain setting for each day that returns the smallest difference between the current price and the ema based on the gain setting and uses that day's info in it's total calculations and if there is a zero gain for the day then it is just a classic ema. I have included strong buy and sell signals in addition to normal ones so lighter colors are normal and darker colors are strong. Buy when the line turns green and sell when it turns red.
Let me know if there are any other indicators you would like to see me publish!

TASC 2021.11 MADH Moving Average Difference, Hann█ OVERVIEW
Presented here is code for the "Moving Average Difference, Hann" indicator originally conceived by John Ehlers. The code is also published in the November 2021 issue of Trader's Tips by Technical Analysis of Stocks & Commodities (TASC) magazine.
█ CONCEPTS
By employing a Hann windowed finite impulse response filter (FIR), John Ehlers has enhanced the Moving Average Difference (MAD) to provide an oscillator with exceptional smoothness.
Of notable mention, the wave form of MADH resembles Ehlers' "Reverse EMA" Indicator, formerly revealed in the September 2017 issue of TASC. Many variations of the "Reverse EMA" were published in TradingView's Public Library.
█ FEATURES
Three values in the script's "Settings/Inputs" provide control over the oscillators behavior:
• The price source
• A "Short Length" with a default of 8, to manage the lower band edge of the oscillator
• The "Dominant Cycle", originally set at 27, which appears to be a placeholder for an adaptive control mechanism
Two coloring options are provided for the line's fill:
• "ZeroCross", the default, uses the line's position above/below the zero level. This is the mode used in the top version of MADH on this chart.
• "Momentum" uses the line's up/down state, as shown in the bottom version of the indicator on the chart.
█ NOTES
Calculations
The source price is used in two independent Hann windowed FIR filters having two different periods (lengths) of historical observation for calculation, one being a "Short Length" and the other termed "Dominant Cycle". These are then passed to a "rate of change" calculation and then returned by the reusable function. The secret sauce is that a "windowed Hann FIR filter" is superior tp a generic SMA filter, and that ultimately reveals Ehlers' clever enhancement. We'll have to wait and see what ingenuities Ehlers has next to unleash. Stay tuned...
The `madh()` function code was optimized for computational efficiency in Pine, differing visibly from Ehlers' original formula, but yielding the same results as Ehlers' version.
Background
This indicator has a sibling indicator discussed in the "The MAD Indicator, Enhanced" article by Ehlers. MADH is an evolutionary update from the prior MAD indicator code published in the October 2021 issue of TASC.
Sibling Indicators
• Moving Average Difference (MAD)
• Cycle/Trend Analytics
Related Information
• Cycle/Trend Analytics And The MAD Indicator
• The Reverse EMA Indicator
• Hann Window
• ROC
Join TradingView!

MathSpecialFunctionsTestFunctionsLibrary "MathSpecialFunctionsTestFunctions"
Methods for test functions.
rosenbrock(input_x, input_y) Valley-shaped Rosenbrock function for 2 dimensions: (x,y) -> (1-x)^2 + 100*(y-x^2)^2.
Parameters:
input_x : float, common range within (-5.0, 10.0) or (-2.048, 2.048).
input_y : float, common range within (-5.0, 10.0) or (-2.048, 2.048).
Returns: float
rosenbrock_mdim(samples) Valley-shaped Rosenbrock function for 2 or more dimensions.
Parameters:
samples : float array, common range within (-5.0, 10.0) or (-2.048, 2.048).
Returns: float
himmelblau(input_x, input_y) Himmelblau, a multi-modal function: (x,y) -> (x^2+y-11)^2 + (x+y^2-7)^2
Parameters:
input_x : float, common range within (-6.0, 6.0 ).
input_y : float, common range within (-6.0, 6.0 ).
Returns: float
rastrigin(samples) Rastrigin, a highly multi-modal function with many local minima.
Parameters:
samples : float array, common range within (-5.12, 5.12 ).
Returns: float
drop_wave(input_x, input_y) Drop-Wave, a multi-modal and highly complex function with many local minima.
Parameters:
input_x : float, common range within (-5.12, 5.12 ).
input_y : float, common range within (-5.12, 5.12 ).
Returns: float
ackley(input_x) Ackley, a function with many local minima. It is nearly flat in outer regions but has a large hole at the center.
Parameters:
input_x : float array, common range within (-32.768, 32.768 ).
Returns: float
bohachevsky1(input_x, input_y) Bowl-shaped first Bohachevsky function.
Parameters:
input_x : float, common range within (-100.0, 100.0 ).
input_y : float, common range within (-100.0, 100.0 ).
Returns: float
matyas(input_x, input_y) Plate-shaped Matyas function.
Parameters:
input_x : float, common range within (-10.0, 10.0 ).
input_y : float, common range within (-10.0, 10.0 ).
Returns: float
six_hump_camel(input_x, input_y) Valley-shaped six-hump camel back function.
Parameters:
input_x : float, common range within (-3.0, 3.0 ).
input_y : float, common range within (-2.0, 2.0 ).
Returns: float

MathConstantsUniversalLibrary "MathConstantsUniversal"
Mathematical Constants
SpeedOfLight() Speed of Light in Vacuum: c_0 = 2.99792458e8 (defined, exact; 2007 CODATA)
MagneticPermeability() Magnetic Permeability in Vacuum: mu_0 = 4*Pi * 10^-7 (defined, exact; 2007 CODATA)
ElectricPermittivity() Electric Permittivity in Vacuum: epsilon_0 = 1/(mu_0*c_0^2) (defined, exact; 2007 CODATA)
CharacteristicImpedanceVacuum() Characteristic Impedance of Vacuum: Z_0 = mu_0*c_0 (defined, exact; 2007 CODATA)
GravitationalConstant() Newtonian Constant of Gravitation: G = 6.67429e-11 (2007 CODATA)
PlancksConstant() Planck's constant: h = 6.62606896e-34 (2007 CODATA)
DiracsConstant() Reduced Planck's constant: h_bar = h / (2*Pi) (2007 CODATA)
PlancksMass() Planck mass: m_p = (h_bar*c_0/G)^(1/2) (2007 CODATA)
PlancksTemperature() Planck temperature: T_p = (h_bar*c_0^5/G)^(1/2)/k (2007 CODATA)
PlancksLength() Planck length: l_p = h_bar/(m_p*c_0) (2007 CODATA)
PlancksTime() Planck time: t_p = l_p/c_0 (2007 CODATA)

Vector2OperationsLibrary "Vector2Operations"
functions to handle vector2 operations.
math_fractional(_value) computes the fractional part of the argument value.
Parameters:
_value : float, value to compute.
Returns: float, fractional part.
atan2(_a) Approximation to atan2 calculation, arc tangent of y/ x in the range radians.
Parameters:
_a : vector2 in the form of a array .
Returns: float, value with angle in radians. (negative if quadrante 3 or 4)
set_x(_a, _value) Set the x value of vector _a.
Parameters:
_a : vector2 in the form of a array .
_value : value to replace x value of _a.
Returns: void Modifies vector _a.
set_y(_a, _value) Set the y value of vector _a.
Parameters:
_a : vector in the form of a array .
_value : value to replace y value of _a.
Returns: void Modifies vector _a.
get_x(_a) Get the x value of vector _a.
Parameters:
_a : vector in the form of a array .
Returns: float, x value of the vector _a.
get_y(_a) Get the y value of vector _a.
Parameters:
_a : vector in the form of a array .
Returns: float, y value of the vector _a.
get_xy(_a) Return the tuple of vector _a in the form
Parameters:
_a : vector2 in the form of a array .
Returns:
length_squared(_a) Length of vector _a in the form. , for comparing vectors this is computationaly lighter.
Parameters:
_a : vector in the form of a array .
Returns: float, squared length of vector.
length(_a) Magnitude of vector _a in the form.
Parameters:
_a : vector in the form of a array .
Returns: float, Squared length of vector.
vmin(_a) Lowest element of vector.
Parameters:
_a : vector in the form of a array .
Returns: float
vmax(_a) Highest element of vector.
Parameters:
_a : vector in the form of a array .
Returns: float
from(_value) Assigns value to a new vector x,y elements.
Parameters:
_value : x and y value of the vector. optional.
Returns: float vector.
new(_x, _y) Creates a prototype array to handle vectors.
Parameters:
_x : float, x value of the vector. optional.
_y : float, y number of the vector. optional.
Returns: float vector.
down() Vector in the form . Returns: float vector.
left() Vector in the form . Returns: float vector.
one() Vector in the form . Returns: float vector.
right() Vector in the form . Returns: float vector
up() Vector in the form . Returns: float vector
zero() Vector in the form . Returns: float vector
add(_a, _b) Adds vector _b to _a, in the form
.
Parameters:
_a : vector in the form of a array .
_b : vector in the form of a array .
Returns:
subtract(_a, _b) Subtract vector _b from _a, in the form
.
Parameters:
_a : vector in the form of a array .
_b : vector in the form of a array .
Returns:
multiply(_a, _b) Multiply vector _a with _b, in the form
Parameters:
_a : vector in the form of a array .
_b : vector in the form of a array .
Returns:
divide(_a, _b) Divide vector _a with _b, in the form
Parameters:
_a : vector in the form of a array .
_b : vector in the form of a array .
Returns:
negate(_a) Negative of vector _a, in the form
Parameters:
_a : vector in the form of a array .
Returns:
perp(_a) Perpendicular Vector of _a.
Parameters:
_a : vector in the form of a array .
Returns:
vfloor(_a) Compute the floor of argument vector _a.
Parameters:
_a : vector in the form of a array .
Returns:
fractional(_a) Compute the fractional part of the elements from vector _a.
Parameters:
_a : vector in the form of a array .
Returns:
vsin(_a) Compute the sine of argument vector _a.
Parameters:
_a : vector in the form of a array .
Returns:
equals(_a, _b) Compares two vectors
Parameters:
_a : vector in the form of a array .
_b : vector in the form of a array .
Returns: boolean value representing the equality.
dot(_a, _b) Dot product of 2 vectors, in the form
Parameters:
_a : vector in the form of a array .
_b : vector in the form of a array .
Returns: float
cross_product(_a, _b) cross product of 2 vectors, in the form
Parameters:
_a : vector in the form of a array .
_b : vector in the form of a array .
Returns: float
scale(_a, _scalar) Multiply a vector by a scalar.
Parameters:
_a : vector in the form of a array .
_scalar : value to multiply vector elements by.
Returns: float vector
normalize(_a) Vector _a normalized with a magnitude of 1, in the form.
Parameters:
_a : vector in the form of a array .
Returns: float vector
rescale(_a) Rescale a vector to a new Magnitude.
Parameters:
_a : vector in the form of a array .
Returns:
rotate(_a, _radians) Rotates vector _a by angle value
Parameters:
_a : vector in the form of a array .
_radians : Angle value.
Returns:
rotate_degree(_a, _degree) Rotates vector _a by angle value
Parameters:
_a : vector in the form of a array .
_degree : Angle value.
Returns:
rotate_around(_center, _target, _degree) Rotates vector _target around _origin by angle value
Parameters:
_center : vector in the form of a array .
_target : vector in the form of a array .
_degree : Angle value.
Returns:
vceil(_a, _digits) Ceils vector _a
Parameters:
_a : vector in the form of a array .
_digits : digits to use as ceiling.
Returns:
vpow(_a) Raise both vector elements by a exponent.
Parameters:
_a : vector in the form of a array .
Returns:
distance(_a, _b) vector distance between 2 vectors.
Parameters:
_a : vector in the form of a array .
_b : vector in the form of a array .
Returns: float, distance.
project(_a, _axis) Project a vector onto another.
Parameters:
_a : vector in the form of a array .
_axis : float vector2
Returns: float vector
projectN(_a, _axis) Project a vector onto a vector of unit length.
Parameters:
_a : vector in the form of a array .
_axis : vector in the form of a array .
Returns: float vector
reflect(_a, _b) Reflect a vector on another.
Parameters:
_a : vector in the form of a array .
_b : vector in the form of a array .
Returns: float vector
reflectN(_a, _b) Reflect a vector to a arbitrary axis.
Parameters:
_a : vector in the form of a array .
_b : vector in the form of a array .
Returns: float vector
angle(_a) Angle in radians of a vector.
Parameters:
_a : vector in the form of a array .
Returns: float
angle_unsigned(_a, _b) unsigned degree angle between 0 and +180 by given two vectors.
Parameters:
_a : vector in the form of a array .
_b : vector in the form of a array .
Returns: float
angle_signed(_a, _b) Signed degree angle between -180 and +180 by given two vectors.
Parameters:
_a : vector in the form of a array .
_b : vector in the form of a array .
Returns: float
angle_360(_a, _b) Degree angle between 0 and 360 by given two vectors
Parameters:
_a : vector in the form of a array .
_b : vector in the form of a array .
Returns: float
clamp(_a, _vmin, _vmax) Restricts a vector between a min and max value.
Parameters:
_a : vector in the form of a array .
_vmin : vector in the form of a array .
_vmax : vector in the form of a array .
Returns: float vector
lerp(_a, _b, _rate_of_move) Linearly interpolates between vectors a and b by _rate_of_move.
Parameters:
_a : vector in the form of a array .
_b : vector in the form of a array .
_rate_of_move : float value between (a:-infinity -> b:1.0), negative values will move away from b.
Returns: vector in the form of a array
herp(_a, _b, _rate_of_move) Hermite curve interpolation between vectors a and b by _rate_of_move.
Parameters:
_a : vector in the form of a array .
_b : vector in the form of a array .
_rate_of_move : float value between (a-infinity -> b1.0), negative values will move away from b.
Returns: vector in the form of a array
area_triangle(_a, _b, _c) Find the area in a triangle of vectors.
Parameters:
_a : vector in the form of a array .
_b : vector in the form of a array .
_c : vector in the form of a array .
Returns: float
to_string(_a) Converts vector _a to a string format, in the form "(x, y)"
Parameters:
_a : vector in the form of a array .
Returns: string in "(x, y)" format
vrandom(_max) 2D random value
Parameters:
_max : float vector, vector upper bound
Returns: vector in the form of a array
noise(_a) 2D Noise based on Morgan McGuire @morgan3d
thebookofshaders.com
www.shadertoy.com
Parameters:
_a : vector in the form of a array .
Returns: vector in the form of a array
array_new(_size, _initial_vector) Prototype to initialize a array of vectors.
Parameters:
_size : size of the array.
_initial_vector : vector to be used as default value, in the form of array .
Returns: _vector_array complex Array in the form of a array
array_size(_id) number of vector elements in array.
Parameters:
_id : ID of the array.
Returns: int
array_get(_id, _index) Get the vector in a array, in the form of a array
Parameters:
_id : ID of the array.
_index : Index of the vector.
Returns: vector in the form of a array
array_set(_id, _index, _a) Sets the values vector in a array.
Parameters:
_id : ID of the array.
_index : Index of the vector.
_a : vector, in the form .
Returns: Void, updates array _id.
array_push(_id, _a) inserts the vector at the end of array.
Parameters:
_id : ID of the array.
_a : vector, in the form .
Returns: Void, updates array _id.
array_unshift(_id, _a) inserts the vector at the begining of array.
Parameters:
_id : ID of the array.
_a : vector, in the form .
Returns: Void, updates array _id.
array_pop(_id, _a) removes the last vector of array and returns it.
Parameters:
_id : ID of the array.
_a : vector, in the form .
Returns: vector2, updates array _id.
array_shift(_id, _a) removes the first vector of array and returns it.
Parameters:
_id : ID of the array.
_a : vector, in the form .
Returns: vector2, updates array _id.
array_sum(_id) Total sum of all vectors.
Parameters:
_id : ID of the array.
Returns: vector in the form of a array
array_center(_id) Finds the vector center of the array.
Parameters:
_id : ID of the array.
Returns: vector in the form of a array
array_rotate_points(_id) Rotate Array vectors around origin vector by a angle.
Parameters:
_id : ID of the array.
Returns: rotated points array.
array_scale_points(_id) Scale Array vectors based on a origin vector perspective.
Parameters:
_id : ID of the array.
Returns: rotated points array.
array_tostring(_id, _separator) Reads a array of vectors into a string, of the form " ""
Parameters:
_id : ID of the array.
_separator : string separator for cell splitting.
Returns: string Translated complex array into string.
line_new(_a, _b) 2 vector line in the form.
Parameters:
_a : vector, in the form .
_b : vector, in the form .
Returns:
line_get_a(_line) Start vector of a line.
Parameters:
_line : vector4, in the form .
Returns: float vector2
line_get_b(_line) End vector of a line.
Parameters:
_line : vector4, in the form .
Returns: float vector2
line_intersect(_line1, _line2) Find the intersection vector of 2 lines.
Parameters:
_line1 : line of 2 vectors in the form of a array .
_line2 : line of 2 vectors in the form of a array .
Returns: vector in the form of a array .
draw_line(_line, _xloc, _extend, _color, _style, _width) Draws a line using line prototype.
Parameters:
_line : vector4, in the form .
_xloc : string
_extend : string
_color : color
_style : string
_width : int
Returns: draw line object
draw_triangle(_v1, _v2, _v3, _xloc, _color, _style, _width) Draws a triangle using line prototype.
Parameters:
_v1 : vector4, in the form .
_v2 : vector4, in the form .
_v3 : vector4, in the form .
_xloc : string
_color : color
_style : string
_width : int
Returns: tuple with 3 line objects.
draw_rect(_v1, _size, _angle, _xloc, _color, _style, _width) Draws a square using vector2 line prototype.
Parameters:
_v1 : vector4, in the form .
_size : float
_angle : float
_xloc : string
_color : color
_style : string
_width : int
Returns: tuple with 3 line objects.

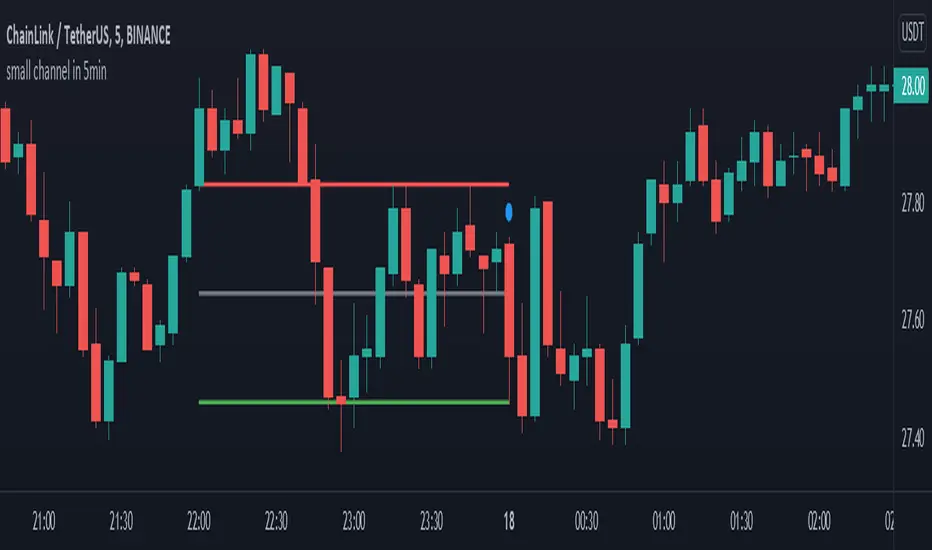
small channel in 5minThis indicator designed for 5min time-frame.
it detects a candlestick pattern in one hour time-frame and draw a channel based on the detected pattern, where two candles and are covered by the third one , in 5 min time-frame.
the bottom, middle and top of the channel are colored by green, gray and red respectively. this channel may help user to use it as a possible support and resistance region.
(the pattern is defined in line 11 to 13.)
enjoy it
MarketGod for Tradingview(strategy)Fully Open Source Tv Market God Strategy. Good Luck
Strategy Description
MarketGod can be applied to any market, with any time-frame associated to it. The signals relay the alert at the close of the period, and the painted alert is then available to users to see on the chart or even set notifications for via tradingview's alert system. We recommend that users implement marketgod on their preferred time frames for trading, which for us is the 1h, 4h, 6h, 1D and above TFs.
MarketGod Versioning
The versions included with this release are the following
MarketGod v1
MarketGod v2
MarketGod v3
MarketGod v4
MarketGod v5
MarketGod v6
MarketGod v7
MarketGod v8
MarketGodx²
Ichimoku God
Suggested Uses
• MarketGod will inevitably produce false positives. We've taken steps to reduce this but we highly suggest you add this as a component of your strategy, not an end all be all
• That said, please do not feel the need to fire a trade based solely on a marketgod signal, or to every signal it fires.
• MarketGod users should backtest their strategy using OHLC candles for best results
• Heikin Ashi candles were recomended in the past, and we have eliminated the need for them, meaning that traditional candlestick inputs will yield the highest results.
• MarketGod will always give stronger alerts on higher TF's. If the 1-Day has fired a given signal and the 30 min or similar fire the opposite signal, know that the overall trend is still likely downward. Same concept applies to all timeframes on this tool.
Adjusting the Filter Settings
This tool has a noise filter for users to adjust.
The filter is a percentage based calculation, between significant points in time. The filter ranges between .5 and 25, with .5 increments
• For lower TFs ( IE Intraday), keep the filter set between .5-5
• Mid-TFs (4H,6H,12H,1D), the recommended range is between 5.5-10
• Higher TFs (3D and Higher), look for approx 11-20 range
Customizations
Customize the indicator by adjusting the colors in the style pane. Additionally, users can change the plots into labels with the price of close added to them, or a few other label text options, listed in the 'inputs' panel, below the filter adjustments. Users can also opt to turn the strategy orders as well, as this version will have them printed.
Strategy Performance Interpretation
Its important to understand the only metric that should be relevant is not the win %, as many may initially think. Alternatively, the only metric that matters in the end is your take home profit... meaning the profit one fees and taxes are accounted for. In our example here, the % brought back since the beginning of our window of 2018 is around 47% for $10,000 initial capital and 10% traded per position. Many are ignorant to the take home profit aspect as they focus solely on the winning %, which is ultimately incorrect approach to trading as a whole. as long as we maintain +30% (our goal minimum), the outcome being in the green, is our goal.

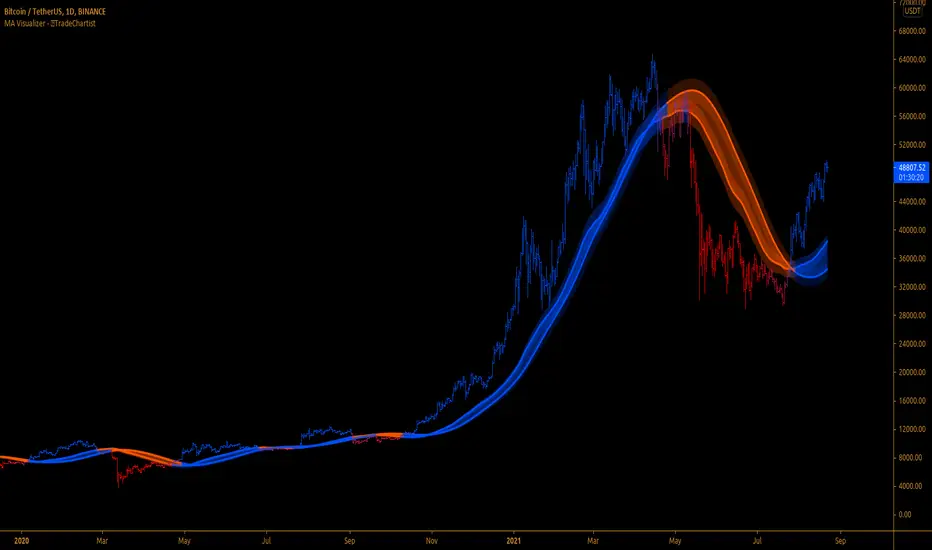
MA Visualizer™TradeChartist MA Visualizer is a Moving Average based indicator aimed to visualize price action in relation to the Moving Average in a visually engaging way.
===================================================================================================================
█ MA Visualizer Features
11 different Moving Averages to choose from the settings to visualize based on MA Visualizer Length (Default - 55 period SMA).
2 Smoothing options (default - 0, 0 uses MA length as Smoothing factor, 1 uses no Smoothing).
4 colour themes to choose from and option to adjust Visualizer Vibrance.
█ Example Charts
1. 1hr chart of OANDA:XAUUSD using 55 period WMA.
2. 15m chart of OANDA:EURUSD using 144 period Tillson T3 MA.
3. 4 hr chart of OANDA:US30USD using 55 period SMMA.
===================================================================================================================
Best Practice: Test with different settings first using Paper Trades before trading with real money
===================================================================================================================
Fibonacci Moving AverageSimple idea from an article I read online I decided to code:
Take EMA's for periods based on the fibonacci sequence - 3, 5, 8, 13, 21, 34, 55 etc. and average them into one MA - the result is the Fibonacci MA (FMA)
Therefore - note the FMA does not use Length - but Range/Interval of how many steps of the Fibonacci Sequence to include.
Seems to be good for finding support/resistance for the price - so added some extra features:
Using up to 3 in at different periods - when they stretch apart it means price is very deviated and will reverse.
Added a price OHLC line if you want to move the indicator to a sub-panel for nice visualisation.
I believe you could look at the 4, 8 and 10, where the longest MA (10,11 FMA) indicates overall bull or bear trend (whether on top or bottom) and you could probably code in alerts for price crossing up or crossing down on the faster (4 FMA)
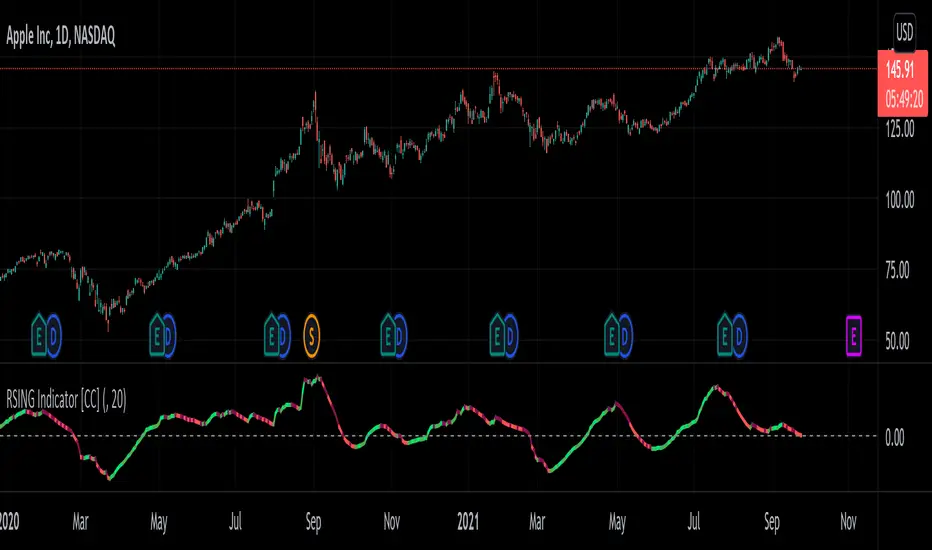
RSING Indicator [CC]The RSING indicator was created by Alon Horesh (Stocks & Commodities March 2021 pg 11) and this aims to be a better version of rsi that adapts to volume as well as a focus on overall strength. This is trying to fix the issues with the traditional RSI with a lack of volume and the issue where you could have the indicator stay in overbought or oversold territory but the upward or downward momentum continues. This indicator takes ratios of the current volume to it's moving average, the overall momentum of the stock, and the current range in comparison to the std deviation of it's past range and multiplies them all together to create this new indicator. I smooth it with a moving average for easier to read buy and sell signals. I have included strong buy and sell signals as darker colors and normal buy and sell signals as lighter colors. Buy when the line turns green and sell when it turns red.
Let me know if there are any other indicators you would like to see me publish!
Sector PerformanceThis indicator shows real-time current day performance for 11 ETFs that divide the S&P 500 into eleven sector index funds. The list of different sector ETFs this indicator tracks is as follows -
1. SPY - S&P 500 Index
2. XLC - Communication Services
3. XLY - Consumer Discretionary
4. XLP - Consumer Staples
5. XLE - Energy
6. XLF - Financials
7. XLV - Health Care
8. XLI - Industrials
9. XLB - Materials
10. XLRE - Real Estate
11. XLF - Technology
12. XLU - Utilities
Acknowledgment - This indicator is adapted using the source code from another excellent performance indicator (). Thanks to BeeHolder (www.tradingview.com) for generously sharing the source code.

DAYOFWEEK performance1 -Objective
"What is the ''best'' day to trade .. Monday, Tuesday...."
This script aims to determine if there are different results depending on the day of the week.
The way it works is by dividing data by day of the week (Monday, Tuesday, Wednesday ... ) and perform calculations for each day of the week.
1 - Objective
2 - Features
3 - How to use (Examples)
4 - Inputs
5 - Limitations
6 - Notes
7 - Final Tooughs
2 - Features
AVG OPEN-CLOSE
Calculate de Percentage change from day open to close
Green % (O-C)
Percentage of days green (open to close)
Average Change
Absolute day change (O-C)
AVG PrevD. Close-Close
Percentage change from the previous day close to the day of the week close
(Example: Monday (C-C) = Friday Close to Monday close
Tuesday (C-C) = Monday C. to Tuesday C.
Green % (C1-C)
Percentage of days green (open to close)
AVG Volume
Day of the week Average Volume
Notes:
*Mon(Nº) - Nº = Number days is currently calculated
Example: Monday (12) calculation based on the last 12 Mondays. Note: Discrepancies in numbers example Monday (12) - Friday (11) depend on the initial/end date or the market was closed (Holidays).
3 - How to use (Examples)
For the following example, NASDAQ:AAPL from 1 Jan 21 to 1 Jul 21 the results are following.
The highest probability of a Close being higher than the Open is Monday with 52.17 % and the Lowest Tuesday with 38.46 %. Meaning that there's a higher chance (for NASDAQ:AAPL ) of closing at a higher value on Monday while the highest chance of closing is lower is Tuesday. With an average gain on Tuesday of 0.21%
Long - The best day to buy (long) at open (on average) is Monday with a 52.2% probability of closing higher
Short - The best day to sell (short) at open (on average) is Tuesday with a 38.5% probability of closing higher (better chance of closing lower)
Since the values change from ticker to ticker, there is a substantial change in the percentages and days of the week. For example let's compare the previous example ( NASDAQ:AAPL ) to NYSE:GM (same settings)
For the same period, there is a substantial difference where there is a 62.5% probability Friday to close higher than the open, while Tuesday there is only a 28% probability.
With an average gain of 0.59% on Friday and an average loss of -0.34%
Also, the size of the table (number of days ) depends if the ticker is traded or not on that day as an example COINBASE:BTCUSD
4 - Inputs
DATE RANGE
Initial Date - Date from which the script will start the calculation.
End Date - Date to which the script will calculate.
TABLE SETTINGS
Text Color - Color of the displayed text
Cell Color - Background color of table cells
Header Color - Color of the column and row names
Table Location - Change the position where the table is located.
Table Size - Changes text size and by consequence the size of the table
5 - LIMITATIONS
The code determines average values based on the stored data, therefore, the range (Initial data) is limited to the first bar time.
As a consequence the lower the timeframe the shorter the initial date can be and fewer weeks can be calculated. To warn about this limitation there's a warning text that appears in case the initial date exceeds the bar limit.
Example with initial date 1 Jan 2021 and end date 18 Jul 2021 in 5m and 10 m timeframe:
6 - Notes and Disclosers
The script can be moved around to a new pane if need. -> Object Tree > Right Click Script > Move To > New pane
The code has not been tested in higher subscriptions tiers that allow for more bars and as a consequence more data, but as far I can tell, it should work without problems and should be in fact better at lower timeframes since it allows more weeks.
The values displayed represent previous data and at no point is guaranteed future values
7 - Final Tooughs
This script was quite fun to work on since it analysis behavioral patterns (since from an abstract point a Tuesday is no different than a Thursday), but after analyzing multiple tickers there are some days that tend to close higher than the open.
PS: If you find any mistake ex: code/misspelling please comment.

MTF Technical Ratings [Anan]█ OVERVIEW
This indicator is a modified version of "Technical Ratings" v5.0 available in the public library to provide a quick overview of Technical Ratings in 6 optional timeframes.
█ FEATURES
- Multi-timeframe Table.
- Display Technical Ratings for "MAs" with a percentage.
- Display Technical Ratings for "Oscillators" with a percentage.
- Display Technical Ratings for "All" with a percentage.
- Full control of displaying any row(MAs / Oscillators / All) or any column(Multi-timeframe)
- Full control of Table position and size.
- Full control of displaying any row or column.
ORIGINAL DESCRIPTION ABOUT TECHNICAL RATING v1.0
█ OVERVIEW
This indicator calculates TradingView's well-known "Strong Buy", "Buy", "Neutral", "Sell" or "Strong Sell" states using the aggregate biases of 26 different technical indicators.
█ CALCULATIONS
The indicator calculates the aggregate value of two groups of indicators: moving averages and oscillators.
The "MAs" group is comprised of 15 different components:
• Six Simple Moving Averages of periods 10, 20, 30, 50, 100 and 200
• Six Exponential Moving Averages of the same periods
• A Hull Moving Average of period 9
• A Volume-weighed Moving Average of period 20
• Ichimoku
The "Oscillators" group includes 11 components:
• RSI
• Stochastic
• CCI
• ADX
• Awesome Oscillator
• Momentum
• MACD
• Stochastic RSI
• Wiliams %R
• Bull Bear Power
• Ultimate Oscillator
The state of each group's components is evaluated to a +1/0/-1 value corresponding to its bull/neutral/bear bias. The resulting value for each of the two groups are then averaged to produce the overall value for the indicator, which oscillates between +1 and -1. The complete conditions used in the calculations are documented in the Help Center.

SPX Excess CAPE YieldHere we are looking at the Excess CAPE yield for the SPX500 over the last 100+ years
"A higher CAPE meant a lower subsequent 10-year return, and vice versa. The R-squared was a phenomenally high 0.9 — the CAPE on its own was enough to explain 90% of stocks’ subsequent performance over a decade. The standard deviation was 1.37% — in other words, two-thirds of the time the prediction was within 1.37 percentage points of the eventual outcome: this over a quarter-century that included an equity bubble, a credit bubble, two epic bear markets, and a decade-long bull market."
assets.bwbx.io
In December of 2020 Dr. Robert Shiller the Yale Nobel Laurate suggested that an improvement on CAPE could be made by taking its inverse (the CAPE earnings yield) and subtracting the us10 year treasury yield.
"His model plainly suggests that stocks will do badly over the next 10 years, and that bonds will do even worse. This was the way Shiller put it in a research piece for Barclays Plc in October, (which can be found on SSRN Below):
In summary, investors expect a certain return in equities as compensation for investing in a riskier asset class, and as interest rates have declined, the relative expected return for equities has increased dramatically. We believe this may quantitatively help to explain investors current preference for equities over bonds, and as such the quick recoveries we are observing (with the exception of the UK), whilst still in the midst of a pandemic. In the US in particular, we are once again observing stretched valuations and high CAPE ratios compared to history."
Sources:
papers.ssrn.com
www.bloomberg.com
The standard trading view disclaimer applies to this post -- please consult your own investment advisor before making investment decisions. This post is for observation only and has no warranty etc. www.tradingview.com
Best,
JM

Volatility OscillatorThis tool displays relative volatility and directional trend. Excellent way to pickup diversions and reversals. Length can be lowered to 11 or 13 in settings to show price range.
Can be used to identify patterns such as parallel channels and likely direction of price action as pictured below.

AZ V.3 Test ++Position Size Fix+Float
Core Concept
This Strategy is Base on EMA Cross
But thing what make this strategy be different from original CDC Action Zone V.3 is "Position Size"
Compound Profit & Not Compound Profit Strategy
Position Sizing Concept
Be real.Everyone know the key of survive in the Market is "Risk & Money Management"
So, How can we manage our Risk and Money?
Yes, The key is " Make the Risk celling "
////////////////////////////////////
//// (Risk% * 100) / Stoploss % ////
////////////////////////////////////
How can we make the Risk celling?
1. Define your Risk Per Trade for you. (How much % money of your portfolio are you willing to pay for this trade?)
- Example -
- I Have 3,000$ in my portfolio.
- I think i can take the risk per trade for my trade 2.5% of my portfolio. (75$)
- I calculate the Position Size of my trade to pay 2.5% of my portfolio when i need to stoploss. (75$)
- And then, I have 97.5% of my fund (2,925$) for fight in next trade.
- ***** So, I'll never lose a big money of my fund. And "SURVIVE" in long term. *****
2. Mark the "Entry Point" and "Stop Loss Point"
- Example -
- I have a Entry Point at price 30,000 $
- I Make the "Hard Stop" at previous low 11 Bar. (Hard Stop = When the price went lower from this point, We Sell this position without any pity)
- For example. I assume the previous low is 20,000$
- I Clac. the different % from Entry to Stoploss. (33%)
- ***** So, If the price went low from Entry Point -33%. I'll stop this position. *****
3. Calculate my position size.
////////////////////////////////////
//// (Risk% * 100) / Stoploss % ////
////////////////////////////////////
- In the past 2 Example.
- We have Risk% = 2.5%
- We have Stoploss% = 33%
- So, We clac. >>
- 7.575757 >> 7.5 % of my Portfolio
- 7.5 % of my Portfolio = 225 $
- ***** When my position Dropdown I'll lose for this trade and survive to fight in next trade. *****
Compound Profit Concept
We calculate the base equity from
Normal People use this.
Not Compound Profit Concept
We calculate the base equity from
If we have some profit. We use this profit for "Reserve" the loss in next trade.

Technical Ratings on Multi-frames / Assets█ OVERVIEW
This indicator is a modified version of TECHNICAL RATING v1.0 available in the public library to provide a quick overview of consolidated technical ratings performed on 12 assets in 3 timeframes.The purpose of the indicator is to provide a quick overview of the current status of the custom 12 (24) assets and to help focus on the appropriate asset.
█ MODIFICATIONS
- Markers, visualizations and alerts have been deleted
- Due to the limitation on maximum number of security (40), the results of 12 assets evaluated in 3 different time frames can be shown at the same time.
- An additional 12 assets can be configured in the settings so that you do not have to choose each ticker one by one to facilitate a quick change, but can switch between the 12 -12 assets with a single click on "Second sets?".
- The position, colors and parameters of the table can be widely customized in the settings.
- The 12 assets can be arranged in rows 3, 4, 6 and 12 with Table Rows options, which can also be used to create a simple mobile view.
- The default gradient color setting has been changed to red/yellow/green traffic lights
ORIGINAL DESCRIPTION ABOUT TECHNICAL RATING v1.0
█ OVERVIEW
This indicator calculates TradingView's well-known "Strong Buy", "Buy", "Neutral", "Sell" or "Strong Sell" states using the aggregate biases of 26 different technical indicators.
█ WARNING
This version is similar, but not identical, to our recently published "Technical Ratings" built-in, which reproduces our "Technicals" ratings displayed as a gauge in the right panel of charts, or in the "Rating" indicator available in the TradingView Screener. This is a fork and refactoring of the code base used in the "Technical Ratings" built-in. Its calculations will not always match those of the built-in, but it provides options not available in the built-in. Up to you to decide which one you prefer to use.
█ FEATURES
Differences with the built-in version
• The built-in version produces values matching the states displayed in the "Technicals" ratings gauge; this one does not always.
• A strategy version is also available as a built-in; this script is an indicator—not a strategy.
• This indicator will show a slightly different vertical scale, as it does not use a fixed scale like the built-in.
• This version allows control over repainting of the signal when you do not use a higher timeframe. Higher timeframe (HTF) information from this version does not repaint.
• You can adjust the weight of the Oscillators and MAs components of the rating here.
• You can configure markers on signal breaches of configurable levels, or on advances declines of the signal.
The indicator's settings allow you to:
• Choose the timeframe you want calculations to be made on.
• When not using a HTF, you can select a repainting or non-repainting signal.
• When using both MAs and Oscillators groups to calculate the rating, you can vary the weight of each group in the calculation. The default is 50/50.
Because the MAs group uses longer periods for some of its components, its value is not as jumpy as the Oscillators value.
Increasing the weight of the MAs group will thus have a calming effect on the signal.
• Alerts can be created on the indicator using the conditions configured to control the display of markers.
Display
The calculated rating is displayed as columns, but you can change the style in the inputs. The color of the signal can be one of three colors: bull, bear, or neutral. You can choose from a few presets, or check one and edit its color. The color is determined from the rating's value. Between 0.1 and -0.1 it is in the neutral color. Above/below 0.1/-0.1 it will appear in the bull/bear color. The intensity of the bull/bear color is determined by cumulative advances/declines in the rating. It is capped to 5, so there are five intensities for each of the bull/bear colors.
The "Strong Buy", "Buy", "Neutral", "Sell" or "Strong Sell" state of the last calculated value is displayed to the right of the last bar for each of the three groups: All, MAs and Oscillators. The first value always reflects your selection in the "Rating uses" field and is the one used to display the signal. A "Strong Buy" or "Strong Sell" state appears when the signal is above/below the 0.5/-0.5 level. A "Buy" or "Sell" state appears when the signal is above/below the 0.1/-0.1 level. The "Neutral" state appears when the signal is between 0.1 and -0.1 inclusively.
Five levels are always displayed: 0.5 and 0.1 in the bull color, zero in the neutral color, and -0.1 and - 0.5 in the bull color.
█ CALCULATIONS
The indicator calculates the aggregate value of two groups of indicators: moving averages and oscillators.
The "MAs" group is comprised of 15 different components:
• Six Simple Moving Averages of periods 10, 20, 30, 50, 100 and 200
• Six Exponential Moving Averages of the same periods
• A Hull Moving Average of period 9
• A Volume-weighed Moving Average of period 20
• Ichimoku
The "Oscillators" group includes 11 components:
• RSI
• Stochastic
• CCI
• ADX
• Awesome Oscillator
• Momentum
• MACD
• Stochastic RSI
• Wiliams %R
• Bull Bear Power
• Ultimate Oscillator
