Grok's xAI Signal (GXS) Indicator for BTC V6Grok's xAI Signal (GXS) Indicator: A Simple Guide
Imagine trying to decide if Bitcoin is a "buy," "sell," or "wait" without staring at 10 different charts. The GXS Indicator does that for you—it's like a smart dashboard for BTC traders, overlaying signals right on your price chart. It boils down complex market clues into one easy score (from -1 "super bearish" to +1 "super bullish") and flashes green/red arrows or shaded zones when action's needed. No fancy math overload; just clear visuals like tiny triangles for trades, colored clouds for trends, and a bottom "mood bar" (green=up vibe, red=down, gray=meh).
At its core, GXS mixes three big-picture checks:
Price Momentum (50% weight): Quick scans of RSI (overbought/oversold vibes), MACD (speed of ups/downs), EMAs (is price riding the trend wave?), and Bollinger Bands (is the market squeezing for a breakout?). This catches short-term "hot or not" energy.
Network Health (30% weight): A simple "NVT" hack using trading volume vs. price to spot if BTC feels undervalued (buy hint) or overhyped (sell warning). It's like checking if the crowd's too excited or chill.
Trend Strength (20% weight): ADX filter ensures signals only fire in "trending" markets (not choppy sideways noise), plus a MACD boost for extra momentum nudge.
Why this approach? BTC's wild—pure price charts give false alarms in flat times, while ignoring volume/network ignores the "why" behind moves. GXS blends old-school TA (reliable for patterns) with on-chain smarts (crypto-specific "under the hood" data) and a trend gate (skips 70% of bad trades). It's conservative: Signals need the score to cross ±0.08 and a strong trend, reducing noise for swing/position traders. Result? Fewer emotional guesses, more "wait for confirmation" patience—perfect for volatile assets like BTC where hype kills.
Quick Tips to Tweak for Better Results
Start with defaults, then experiment on historical charts (backtest via TradingView's strategy tester if pairing with one):
Fewer False Signals: Bump thresholds to ±0.15 (buy/sell)—trades only on stronger conviction, cutting whipsaws by 20-30% in choppy markets. Or raise ADX thresh to 28 for "only big trends."
Faster/Slower Response: Shorten EMAs (e.g., 5/21) or RSI (10) for quicker scalps; lengthen (12/50) for swing holds. Test on 4H/daily BTC.
Volume Sensitivity: If NVT flips too often, extend its length to 20—smooths on-chain noise in bull runs.
Visual Polish: Crank cloud opacity to 80% for subtler fills; toggle off EMAs if they clutter. Enable table for score breakdowns during live trades.
Risk Tip: Always pair with stops (e.g., 2-3% below signals). On BTC, tweak in bull markets (looser thresh) vs. bears (tighter).
In short, GXS is your BTC "sixth sense"—balanced, not black-box. Tweak small, track win rate, and let trends lead. Happy trading!
Tìm kiếm tập lệnh với "电脑桌面显示BTC"

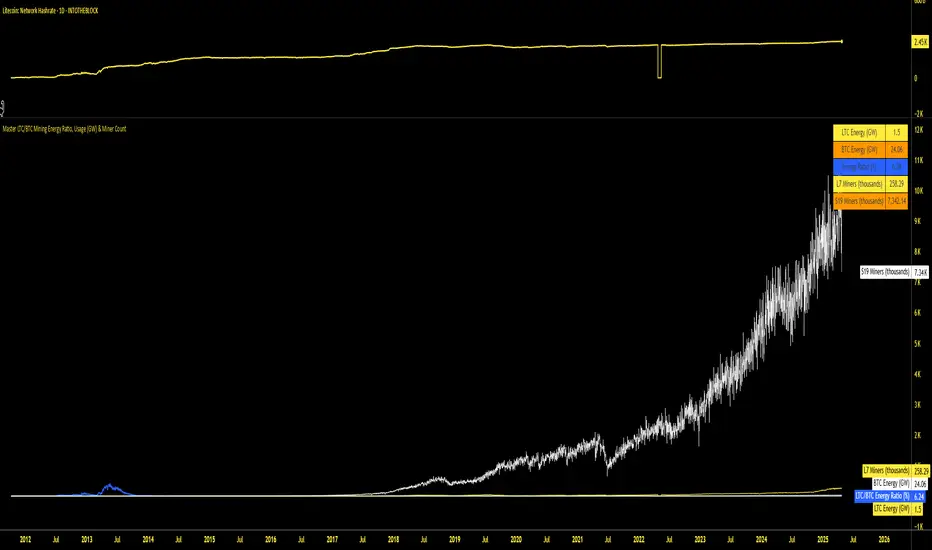
Master LTC/BTC Mining Energy Ratio, Usage (GW) & Miner CountThis Pine Script indicator, "Master LTC/BTC Mining Energy Ratio, Usage (GW) & Miner Count," calculates and visualizes key metrics for Litecoin (LTC) and Bitcoin (BTC) mining operations. Using IntoTheBlock hashrate data, it estimates the number of L7 (LTC) and S19 (BTC) miners, computes energy consumption in gigawatts (GW) based on calibrated efficiency values, and derives the LTC/BTC energy ratio as a percentage. The script plots these metrics—energy ratio, LTC/BTC energy usage, and miner counts (in thousands)—and displays a concise table summarizing the results. Assuming most miners use previous-generation hardware, it provides a clear comparison of the energy dynamics between LTC’s Scrypt and BTC’s SHA-256 algorithms.
AI-123's BTC vs Gold (Lag Correlation)
DISCLAIMER
I made this indicator with the help of ChatGPT and using what I have learned so far from The Pine Script Mastery Course, LOTS of edits based on what I have learned so far had to be made as well as additions and modifications to my liking thanks to what I have learned so far. I am aware this already exists but I have done my best to make a first ever script/indicator while learning how to properly publish as well, so please bear that in mind.
Overview
This indicator analyzes the correlation between Bitcoin (BTC) and Gold (XAUUSD), with a customizable lag applied to the Gold price, providing insight into the macro relationship between these two assets.
It is designed for traders and investors who want to track how Bitcoin and Gold move in relation to each other, particularly when Gold is lagged by a specific number of days.
Key Features:
BTC and Gold (Lagged) Price Overlay: Display Bitcoin (BTC) and Gold (XAUUSD) prices on the chart, with an adjustable lag applied to the Gold price.
Rolling Correlation Calculation: Measures the correlation between Bitcoin and lagged Gold prices over a customizable lookback period.
Adjustable Lag: The number of days that Gold is lagged relative to Bitcoin is fully customizable (default: 20 days).
Customizable Correlation Length: Allows you to choose the lookback period for the correlation (default: 50 days), providing flexibility for short-term or long-term analysis.
Normalized Plotting: Prices of Bitcoin and Gold are normalized for better visual alignment with the correlation values. BTC is divided by 1000, and Gold by 100.
Correlation Scaling: The correlation value is amplified by 10 for better visual clarity and comparison with price data.
Zero Line: Horizontal line representing a correlation of 0, making it easier to identify positive or negative correlation shifts.
Maximum Correlation Lines: Horizontal lines at +10 and -10 values for extreme correlation scenarios.
Input Settings:
Gold Symbol: Customize the Gold ticker (default: OANDA:XAUUSD).
Bitcoin Symbol: Customize the Bitcoin ticker (default: BINANCE:BTCUSDT).
Lag (in trading days): Adjust the number of trading days to lag the Gold price relative to Bitcoin (default: 20).
Correlation Length (days): Set the number of days over which the rolling correlation is calculated (default: 50).
How to Use:
Price Comparison: The BTC (Spot) and Lagged Gold plots give you a side-by-side visual comparison of the two assets, normalized for clarity.
Correlation Line: The correlation line helps you gauge the strength and direction of the relationship between BTC and lagged Gold. Positive values indicate a strong positive correlation, while negative values indicate a negative correlation.
Visual Analysis: Watch how the correlation shifts with changes in lag and correlation length to identify potential market dynamics between Bitcoin and Gold.
Potential Applications:
Macro Trading: Track how Bitcoin and Gold behave in relation to each other during periods of economic uncertainty or inflation.
Sentiment Analysis: Use the correlation data to understand the sentiment between digital and traditional assets.
Strategic Timing: Identify potential opportunities where Bitcoin and Gold show a strong correlation or diverge based on the lag adjustment.
Understanding Macro Trends/Correlations.
Disclaimer:
This indicator is for informational purposes only. The correlation between Bitcoin and Gold does not guarantee future performance, and users should conduct their own research and use risk management strategies when making trading decisions.
Notes: This script uses historical data, so results may vary across different timeframes.
Customization options allow users to adjust the lag and correlation length to better fit their trading strategy.
Future Enhancements: Additional Correlation Line: A second correlation line for different lengths of lag or different assets.
Color-Coding of Correlation: Future updates may include color-coded correlation strength, visually indicating positive or negative correlation more effectively.

Bitcoin Futures vs. Spot Tri-Frame - Strategy [presentTrading]Prove idea with a backtest is always true for trading.
I developed and open-sourced it as an educational material for crypto traders to understand that the futures and spot spread may be effective but not be as effective as they might think. It serves as an indicator of sentiment rather than a reliable predictor of market trends over certain periods. It is better suited for specific trading environments, which require further research.
█ Introduction and How it is Different
The "Bitcoin Futures vs. Spot Tri-Frame Strategy" utilizes three different timeframes to calculate the Z-Score of the spread between BTC futures and spot prices on Binance and OKX exchanges. The strategy executes long or short trades based on composite Z-Score conditions across the three timeframes.
The spread refers to the difference in price between BTC futures and BTC spot prices, calculated by taking a weighted average of futures prices from multiple exchanges (Binance and OKX) and subtracting a weighted average of spot prices from the same exchanges.
BTCUSD 1D L/S Performance
█ Strategy, How It Works: Detailed Explanation
🔶 Calculation of the Spread
The spread is the difference in price between BTC futures and BTC spot prices. The strategy calculates the spread by taking a weighted average of futures prices from multiple exchanges (Binance and OKX) and subtracting a weighted average of spot prices from the same exchanges. This spread serves as the primary metric for identifying trading opportunities.
Spread = Weighted Average Futures Price - Weighted Average Spot Price
🔶 Z-Score Calculation
The Z-Score measures how many standard deviations the current spread is from its historical mean. This is calculated for each timeframe as follows:
Spread Mean_tf = SMA(Spread_tf, longTermSMA)
Spread StdDev_tf = STDEV(Spread_tf, longTermSMA)
Z-Score_tf = (Spread_tf - Spread Mean_tf) / Spread StdDev_tf
Local performance
🔶 Composite Entry Conditions
The strategy triggers long and short entries based on composite Z-Score conditions across all three timeframes:
- Long Condition: All three Z-Scores must be greater than the long entry threshold.
Long Condition = (Z-Score_tf1 > zScoreLongEntryThreshold) and (Z-Score_tf2 > zScoreLongEntryThreshold) and (Z-Score_tf3 > zScoreLongEntryThreshold)
- Short Condition: All three Z-Scores must be less than the short entry threshold.
Short Condition = (Z-Score_tf1 < zScoreShortEntryThreshold) and (Z-Score_tf2 < zScoreShortEntryThreshold) and (Z-Score_tf3 < zScoreShortEntryThreshold)
█ Trade Direction
The strategy allows the user to specify the trading direction:
- Long: Only long trades are executed.
- Short: Only short trades are executed.
- Both: Both long and short trades are executed based on the Z-Score conditions.
█ Usage
The strategy can be applied to BTC or Crypto trading on major exchanges like Binance and OKX. By leveraging discrepancies between futures and spot prices, traders can exploit market inefficiencies. This strategy is suitable for traders who prefer a statistical approach and want to diversify their timeframes to validate signals.
█ Default Settings
- Input TF 1 (60 minutes): Sets the first timeframe for Z-Score calculation.
- Input TF 2 (120 minutes): Sets the second timeframe for Z-Score calculation.
- Input TF 3 (180 minutes): Sets the third timeframe for Z-Score calculation.
- Long Entry Z-Score Threshold (3): Defines the threshold above which a long trade is triggered.
- Short Entry Z-Score Threshold (-3): Defines the threshold below which a short trade is triggered.
- Long-Term SMA Period (100): The period used to calculate the simple moving average for the spread.
- Use Hold Days (true): Enables holding trades for a specified number of days.
- Hold Days (5): Number of days to hold the trade before exiting.
- TPSL Condition (None): Defines the conditions for taking profit and stop loss.
- Take Profit (%) (30.0): The percentage at which the trade will take profit.
- Stop Loss (%) (20.0): The percentage at which the trade will stop loss.
By fine-tuning these settings, traders can optimize the strategy to suit their risk tolerance and trading style, enhancing overall performance.

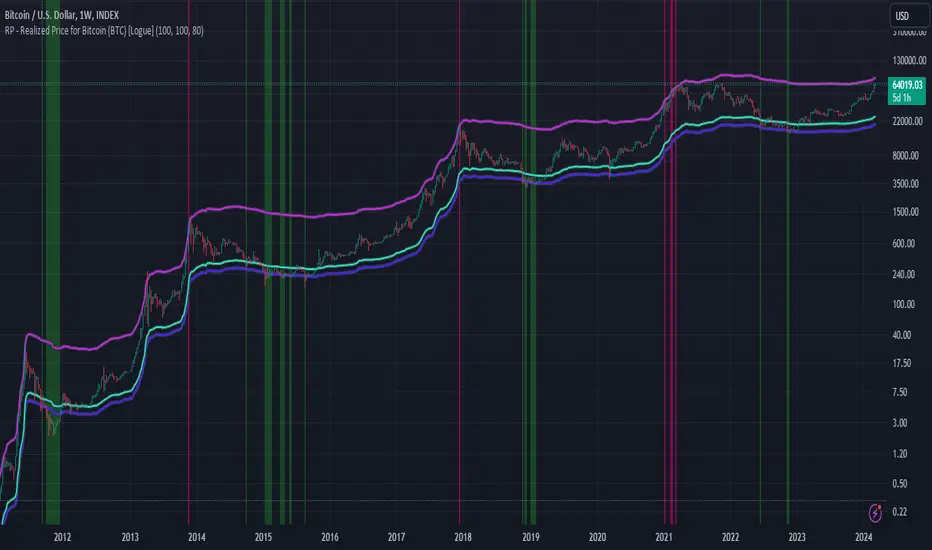
RP - Realized Price for Bitcoin (BTC) [Logue]Realized Price (RP) - The RP is summation of the value of each BTC when it last moved divided by the total number of BTC in circulation. This gives an estimation of the average "purchase" price of BTC on the bitcoin network based on when it was last transacted. This indicator tells us if the average network participant is in a state of profit or loss. This indicator is normally used to detect BTC bottoms, but an extension can be used to detect when the bitcoin network is "highly" overvalued. Because the "strength" of the BTC tops has decreased over the cycles, a logarithmic function for the extension was created by fitting past cycles as log extension = slope * time + intercept. This indicator triggers when the BTC price is above the realized price extension. For the bottoms, the RP is shifted downwards at a default value of 80%. The slope, intercept, and RP bottom shift can all be modified in the script.
Momentum Regime Filter BTC by [VanHelsing]Momentum Regime Filter BTC by
This is a usefull indicator what shows you a macro state of BTC trend.
Most of the trend indicators get lost in the ranging market or switch to bearish during simple pullbacks.
And I decided to creat it to ignore all this noise from a market and see what exactly major trend is!
-How it Works:
For find out what curent trend on BTC is, it using RSI and Normalized Momentum square.
When squre of both momentum and rsi is above zero it is an uptrend when below it is down trend.
I can say it is an momentum indicator. It works only on BTC and on all exchanges of it.
-How to read it
-BackTest (2D BTC Index, momentum length = 15, linear reg = 5) it works on any BTC exchange

DashBoard Alt Season by KziHere is a Dashboard to have an overview of the Alt Season oportunity.
Multiple time frame (Month / Week / Daily /4H)
How to use it?
You have 4 columns
TOTAL Crypto / Btc dominance / Btc Price / Alt ?
The alt? column is the resulte of the price and dominance of btc + 1 point with the total crypto
BTC Dominance UP ? Yes = Négatif for ALTS
/// Btc Price UP ?= > Yes = Positif for ALTS
NO = super négatif for ALTS
No = Positif for ALTS
/// Btc Price UP ?= > Yes = super Positif for ALTS
NO = Neutral
The total market just smooth the total.
If Alt columm is Green= It's OK
If Alt columm is orange = carrefull
If Alt Columm is red = leave the alt
You have to considered that you look on the time frame where you want to trade.
The overtime frame help to understand the bigger view.
Hop you like it and give comment to help the évolutions.

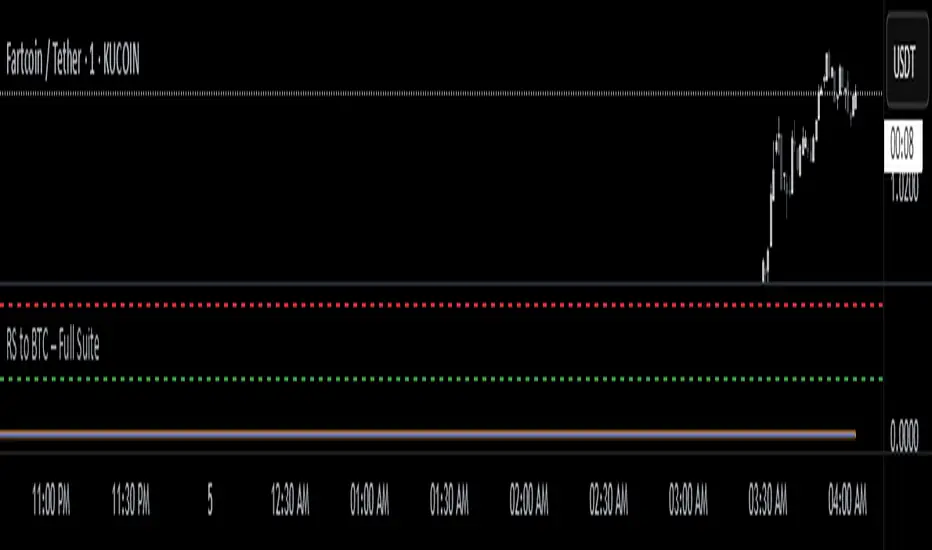
RS to BTC – EYASU V1RS to BTC – Full Suite
📝 Description:
This script tracks the relative strength of any coin against Bitcoin (RSBTC) in real-time. It is designed for altcoin traders who want to identify which coins are outperforming or underperforming BTC across multiple timeframes.
Features:
📈 RSBTC Line: Real-time plot of the altcoin’s price divided by BTC price
🟦 RSBTC Moving Average: Smooths the RS line to help identify trends
🔵 RSBTC RSI (Hidden by default): Highlights momentum of RS to detect overbought/oversold zones
🚨 Alerts: Set alerts for RSBTC crossing its moving average and RSI levels
Ideal for:
Spotting early altcoin breakouts
Timing entries/exits based on BTC-relative performance
Filtering for strong/weak coins before macro news
📱 Fully mobile compatible. Load it on any USDT chart — it auto-detects BTC and gives RS instantly.
Created by: @Eyasustock
License: Mozilla Public License 2.0
MVRVZ BTCMVRVZ BTC (Market Value to Realized Value Z-Score)
Description:
The MVRVZ BTC indicator provides insights into the relationship between the market value and realized value of Bitcoin, using the Market Value to Realized Value (MVRV) ratio, which is then adjusted using a Z-Score. This indicator highlights potential market extremes and helps in identifying overbought or oversold conditions, offering a unique perspective on Bitcoin's valuation.
How It Works:
MVRVZ is calculated by taking the difference between Bitcoin's Market Capitalization (MC) and Realized Capitalization (MCR), then dividing that by the Standard Deviation (Stdev) of the price over a specified period (usually 104 weeks).
The resulting value is plotted as the MVRVZ line, representing how far the market price deviates from its realized value.
Z-Score is then applied to the MVRVZ line, with the Z-Score bounded between +2 and -2, which allows it to be used within a consistent evaluation framework, regardless of how high or low the MVRVZ line goes. The Z-Score will reflect overbought or oversold conditions:
A Z-Score above +2 indicates the market is likely overbought (possible market top).
A Z-Score below -2 indicates the market is likely oversold (possible market bottom).
Values between -2 and +2 indicate more neutral market conditions.
How to Read the Indicator:
MVRVZ Line:
The MVRVZ line shows the relationship between market cap and realized cap. A higher value indicates the market is overvalued relative to the actual capital realized by holders.
The MVRVZ line can move above or below the top and bottom lines you define, which are adjustable according to your preferences. These lines act as trigger levels.
Top and Bottom Trigger Lines:
You can customize the Top Line and Bottom Line values to your preference.
When the MVRVZ line crosses the Top Line, the market might be considered overbought.
When the MVRVZ line crosses the Bottom Line, the market might be considered oversold.
SCDA Z-Score:
The Z-Score is displayed alongside the MVRVZ line and is bounded between -2 and +2. It scales proportionally based on the MVRVZ line's position relative to the top and bottom trigger lines.
The Z-Score ensures that even if the MVRVZ line moves beyond the trigger lines, the Z-Score will stay within the limits of -2 to +2, making it ideal for your custom evaluation system (SCDA).
Background Highlighting:
The background color changes when the MVRVZ line crosses key levels:
When the MVRVZ line exceeds the Top Trigger, the background turns red, indicating overbought conditions.
When the MVRVZ line falls below the Bottom Trigger, the background turns green, indicating oversold conditions.
Data Sources:
The data for the MVRVZ indicator is sourced from Glassnode and Coinmetrics, which provide the necessary values for:
BTC Market Cap (MC) – The total market capitalization of Bitcoin.
BTC Realized Market Cap (MCR) – The capitalization based on the price at which Bitcoin was last moved on the blockchain (realized value).
How to Use the Indicator:
Market Extremes:
Use the MVRVZ and Z-Score to spot potential market tops or bottoms.
A high Z-Score (above +2) suggests the market is overbought, while a low Z-Score (below -2) suggests the market is oversold.
Adjusting the Triggers:
Customize the Top and Bottom Trigger Lines to suit your trading strategy. These lines can act as dynamic reference points for when to take action based on the Z-Score or MVRVZ line crossing these levels.
Market Evaluation (SCDA Framework):
The bounded Z-Score (from -2 to +2) is tailored for your SCDA evaluation system, allowing you to assess market conditions based on consistent criteria, no matter how volatile the MVRVZ line becomes.
Conclusion:
The MVRVZ BTC indicator is a powerful tool for assessing the relative valuation of Bitcoin based on its market and realized capitalization. By combining it with the Z-Score, you get an easy-to-read, bounded evaluation system that highlights potential market extremes and helps you make informed decisions about Bitcoin's price behavior.

Blockchain Fundamentals: Liquidity & BTC YoYLiquidity & BTC YoY Indicator
Overview:
This indicator calculates the Year-over-Year (YoY) percentage change for two critical metrics: a custom Liquidity Index and Bitcoin's price. The Liquidity Index is derived from a blend of economic and forex data representing the M2 money supply, while the BTC price is obtained from a reliable market source. A dedicated limit(length) function is implemented to handle limited historical data, ensuring that the YoY calculations are available immediately—even when the chart's history is short.
Features Breakdown:
1. Limited Historical Data Workaround
- Functionality: limit(length) The function dynamically adjusts the lookback period when there isn’t enough historical data. This prevents delays in displaying YoY metrics at the beginning of the chart.
2. Liquidity Calculation
- Data Sources: Combines multiple data streams:
USM2, ECONOMICS:CNM2, USDCNY, ECONOMICS:JPM2, USDJPY, ECONOMICS:EUM2, USDEUR
- Formula:
Liquidity Index = USM2 + (CNM2 / USDCNY) + (JPM2 / USDJPY) + (EUM2 / USDEUR)
[b3. Bitcoin Price Calculation
- Data Source: Retrieves Bitcoin's price from BITSTAMP:BTCUSD on the user-selected timeframe for its historical length.
4. Year-over-Year (YoY) Percent Change Calculation
- Methodology:
- The indicator uses a custom function, to autodetect the proper number of bars, based on the selected timeframe.
- It then compares the current value to that from one year ago for both the Liquidity Index and BTC price, calculating the YoY percentage change.
5. Visual Presentation
- Plotting:
- The YoY percentage changes for Liquidity (plotted in blue) and BTC price (plotted in orange) are clearly displayed.
- A horizontal zero line is added for visual alignment, making it easier to compare the two copies of the metric. You add one copy and only display the BTC YoY. Then you add another copy and only display the M2 YoY.
-The zero lines are then used to align the scripts to each other by interposing them. You scale each chart the way you like, then move each copy individually to align both zero lines on top of each other.
This indicator is ideal for analysts and investors looking to monitor macroeconomic liquidity trends alongside Bitcoin's performance, providing immediate insights.

Enhanced SPX and BTC Overlay with EMASPX-BTC Momentum Gauge and EMA Cross Indicator
Thorough Analysis:
• Combined Overlay (Green/Red Line):
o Function: Plots a wide line over the price chart, representing a composite of SPX and BTC dynamics adjusted by volume data.
o Color Coding:
Green: Indicates bullish conditions when the combined value exceeds its 10-period SMA and Bitcoin volume increases.
Red: Signals bearish conditions when the combined value drops below its 10-period SMA and Bitcoin volume decreases.
o Line Characteristics:
Width: Set at 8 for high visibility.
Transparency: 86% for both colors to overlay without obscuring candlesticks.
Scaling: Uses a factor of 0.02446 to amplify movements, making trend changes more noticeable.
• Continuous Bright Red and Green Lines:
o 20-period EMA of Current Ticker (Red):
Purpose: Acts as a medium-term trend indicator, smoothing price data to reflect the asset's general direction over time.
Color: Bright red for easy identification.
Transparency: 60% to keep it visible but not overpowering.
o 5-period EMA of BTC (Green):
Purpose: Provides insights into short-term Bitcoin momentum, capturing rapid changes in market sentiment.
Color: Bright green to distinguish from the red EMA.
Transparency: 30% for high visibility against price movements.
Detailed Analysis of the EMA Cross:
• Crossing Points:
o Bullish Crossover:
Occurs when the 5-period BTC EMA (green) moves above the 20-period EMA of the current ticker (red).
Suggests that Bitcoin's short-term momentum is gaining strength relative to the asset's medium-term trend, potentially signaling an upcoming uptrend or strengthening of an existing one.
o Bearish Crossover:
When the green line falls below the red, it indicates that Bitcoin's immediate momentum is weakening compared to the asset's medium-term trend, which might precede a downtrend or confirm one.
• Early Trade Signals:
o Entry/Exit Points:
These crossovers can guide traders in making timely decisions to enter or exit trades, especially when corroborated by the combined overlay's color.
o Confirmation:
EMA crossovers can confirm trends indicated by the combined overlay. For example, a bullish crossover with a green combined line could validate a buying opportunity.
o Volatility Insights:
The rapid shifts in Bitcoin's 5-period EMA highlight potential volatility spikes, offering an additional layer of market analysis, particularly useful in volatile markets.
• Strategic Use:
o Multi-Market Insight: The script integrates data from both traditional (SPX) and crypto (BTC) markets, allowing for a more comprehensive analysis of market conditions.
o Decision-Making: Provides traders with visual cues for market sentiment, trend direction, and potential reversals, enhancing strategic trading decisions.
o Trend Confirmation: The combination of EMA crossovers and the overlay's color changes offers a multi-faceted approach to trend confirmation or divergence.
In Summary:
• This script merges elements of traditional stock market analysis with cryptocurrency dynamics, utilizing color changes, line thickness, and EMA crossovers to visually communicate market conditions, offering traders a robust tool for analyzing and acting on market movements.

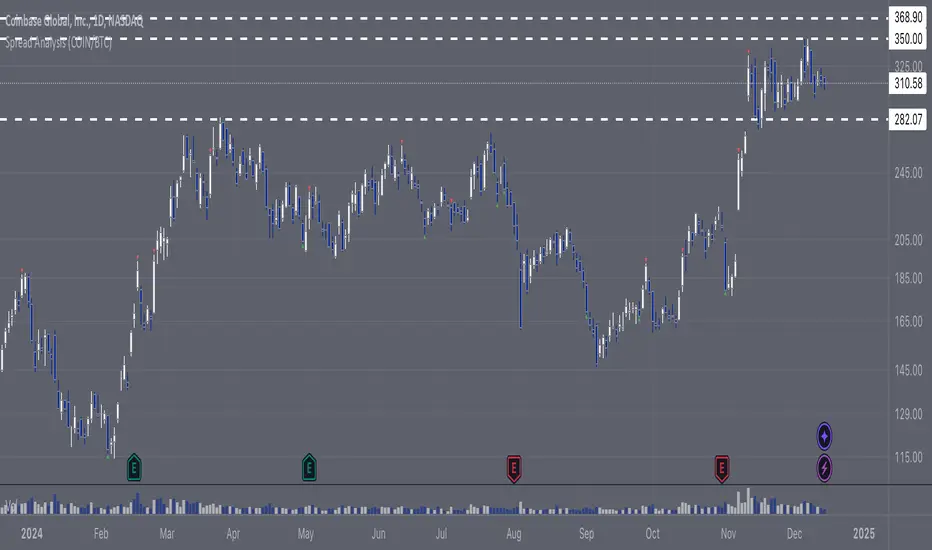
Spread Analysis (COIN/BTC)The Spread Analysis (COIN/BTC) indicator calculates the Z-score of the price ratio between Coinbase stock ( NASDAQ:COIN ) and Bitcoin ( CRYPTOCAP:BTC ). It helps identify overbought or oversold conditions based on deviations from the historical mean of their price relationship.
Key Features:
Z-Score Calculation:
• Tracks the relative price ratio of NASDAQ:COIN to $BTC.
• Compares the current ratio to its historical average, highlighting extreme overvaluation or undervaluation.
• Buy and Sell Signals:
• Buy Signal: Triggered when the Z-score is less than -2, indicating NASDAQ:COIN may be undervalued relative to $BTC.
• Sell Signal: Triggered when the Z-score exceeds 2, suggesting NASDAQ:COIN may be overvalued relative to $BTC.
• Dynamic Z-Score Visualization:
• Blue line plots the Z-score over time.
• Dashed lines at +2 and -2 mark overbought and oversold thresholds.
• Green and red triangles highlight actionable buy and sell signals.
Use Case:
This indicator is ideal for identifying relative valuation opportunities between NASDAQ:COIN and $BTC. Use it to exploit divergences in their historical relationship and anticipate potential reversions to the mean.
Limitations:
• Best suited for range-bound markets; may produce false signals in strongly trending conditions.
• Assumes a consistent correlation between NASDAQ:COIN and CRYPTOCAP:BTC , which may break during independent price drivers like news or earnings.
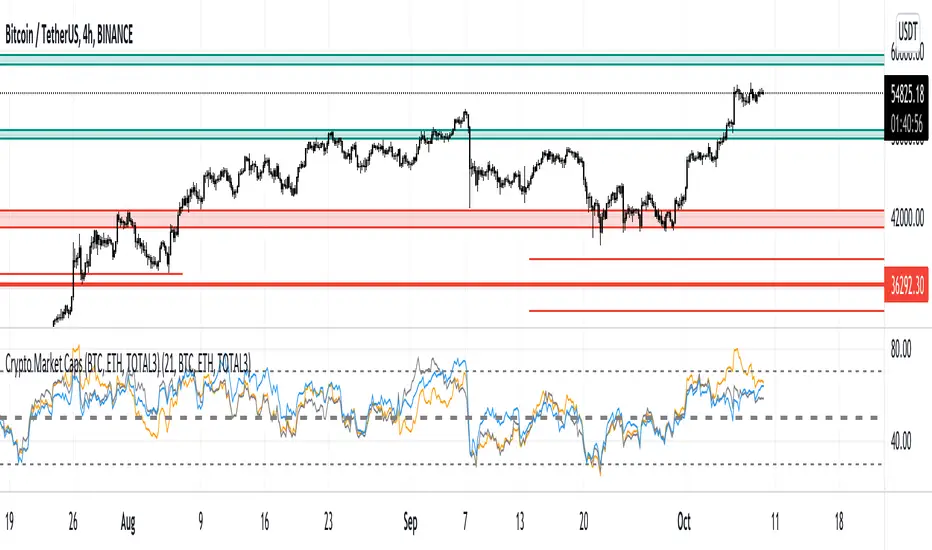
Upper and Lower bound for pairs/BTCUpper and Lower Bound for Pairs/BTC
This indicator provides dynamic upper and lower boundary levels for cryptocurrency pairs traded against BTC. It uses statistical or technical analysis methods, such as Z-Score, Bollinger Bands, or moving averages, to identify key resistance (upper bound) and support (lower bound) levels.
Key Features:
Dynamic Boundaries: Tracks real-time price fluctuations of selected pairs against BTC, adapting to market conditions.
Market Insights: Helps traders visualize potential overbought (upper bound) and oversold (lower bound) zones for pairs like ETH/BTC, DOGE/BTC, and others.
Customizable Settings: Allows users to configure lookback periods, standard deviations, or other parameters for boundary calculations.
Decision Support: Assists in identifying reversal or breakout points to refine entry and exit strategies.
This tool is ideal for traders seeking to optimize risk management and spot opportunities in BTC pair markets.

Altcoins vs BTC Market Cap HeatmapAltcoins vs BTC Market Cap Heatmap
"Ground control to major Tom" 🌙 👨🚀 🚀
This indicator provides a visual heatmap for tracking the relationship between the market cap of altcoins (TOTAL3) and Bitcoin (BTC). The primary goal is to identify potential market cycle tops and bottoms by analyzing how the TOTAL3 market cap (all cryptocurrencies excluding Bitcoin and Ethereum) compares to Bitcoin’s market cap.
Key Features:
• Market Cap Ratio: Plots the ratio of TOTAL3 to BTC market caps to give a clear visual representation of altcoin strength versus Bitcoin.
• Heatmap: Colors the background red when altcoins are overheating (TOTAL3 market cap equals or exceeds BTC) and blue when altcoins are cooling (TOTAL3 market cap is half or less than BTC).
• Threshold Levels: Includes horizontal lines at 1 (Overheated), 0.75 (Median), and 0.5 (Cooling) for easy reference.
• Alerts: Set alert conditions for when the ratio crosses key levels (1.0, 0.75, and 0.5), enabling timely notifications for potential market shifts.
How It Works:
• Overheated (Ratio ≥ 1): Indicates that the altcoin market cap is on par or larger than Bitcoin's, which could signal a top in the cycle.
• Cooling (Ratio < 0.5): Suggests that the altcoin market cap is half or less than Bitcoin's, potentially signaling a market bottom or cooling phase.
• Median (Ratio ≈ 0.75): A midpoint that provides insight into the market's neutral zone.
Use this tool to monitor market extremes and adjust your strategy accordingly when the altcoin market enters overheated or cooling phases.

CVDD - Coin Value Days Destroyed for Bitcoin (BTC) [Logue]Cumulative Value Days Destroyed (CVDD) - The CVDD was created by Willy Woo and is the ratio of the cumulative value of Coin Days Destroyed in USD and the market age (in days). While this indicator is used to detect bottoms normally, an extension is used to allow detection of BTC tops. When the BTC price goes above the CVDD extension, BTC is generally considered to be overvalued. Because the "strength" of the BTC tops has decreased over the cycles, a logarithmic function for the extension was created by fitting past cycles as log extension = slope * time + intercept. This indicator is triggered for a top when the BTC price is above the CVDD extension. For the bottoms, the CVDD is shifted upwards at a default value of 120%. The slope, intercept, and CVDD bottom shift can all be modified in the script.

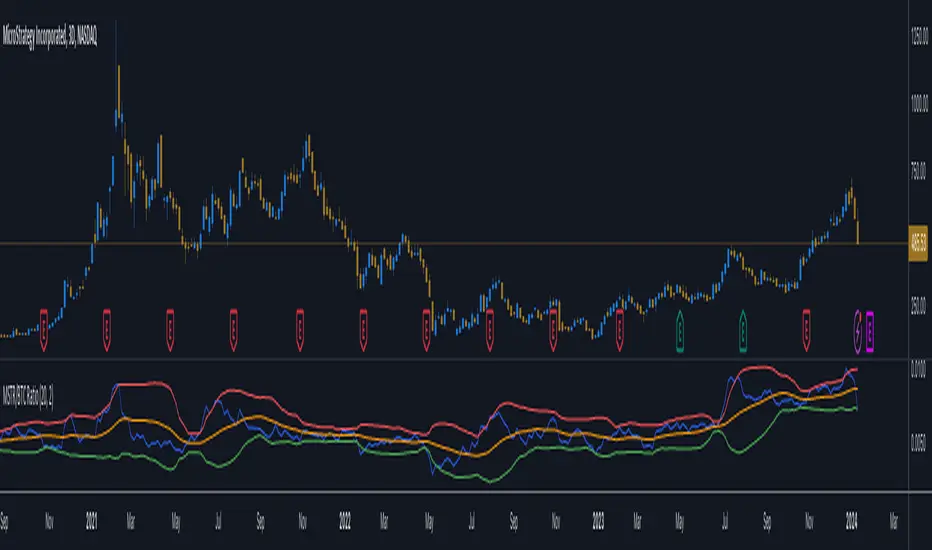
MicroStrategy / Bitcoin Market Cap RatioThis indicator offers a unique analytical perspective by comparing the market capitalization of MicroStrategy (MSTR) with that of Bitcoin (BTC) . Designed for investors and analysts interested in the correlation between MicroStrategy's financial performance and the Bitcoin market, the script calculates and visualizes the ratio of MSTR's market capitalization to Bitcoin's market capitalization.
Key Features:
Start Date: The script considers data starting from July 28, 2020, aligning with MicroStrategy's initial announcement to invest in Bitcoin.
Data Sources: It retrieves real-time data for MSTR's total shares outstanding, MSTR's stock price, and BTC's market capitalization.
Market Cap Calculations: The script calculates MicroStrategy's market cap by multiplying its stock price with the total shares outstanding. It then forms a ratio of MSTR's market cap to BTC's market cap.
Bollinger Bands: To add a layer of analysis, the script includes Bollinger Bands around the ratio, with customizable parameters for length and multiplier. These bands can help identify overbought or oversold conditions in the relationship between MSTR's and BTC's market values.
The indicator plots the MSTR/BTC market cap ratio and the Bollinger Bands, providing a clear visual representation of the relationship between these two market values over time.
This indicator is ideal for users who are tracking the impact of Bitcoin's market movements on MicroStrategy's valuation or vice versa. It provides a novel way to visualize and analyze the interconnectedness of a leading cryptocurrency asset and a major corporate investor in the space.
Cumulative Volume Value (BTC)The Cumulative Volume Value (BTC) indicator is designed to visualize and analyze cumulative volume data specific to Bitcoin. This indicator provides insights into the total volume transacted over a time, aiding in understanding market activity and potential value of Bitcoin.
It considers whether the closing price is greater than the opening price over the defined length, adding or subtracting volume accordingly.
The Cumulative Volume Value (BTC) indicator offers a valuable perspective on Bitcoin's market activity by visualizing cumulative volume and providing insights into potential market tops, bottoms, and the relationship between volume and BTC value movements.
Peaks in the cumulative volume might suggest potential tops in the BTC market, indicating periods of intense trading activity.
Conversely, bottoms in cumulative volume might signal potential market bottoms, representing phases of reduced trading activity or consolidation.
This is how human psychology works. The greatest activity is close to the peak and the worst when the price of BTC has decreased to the level when people lose interest and faith in the cryptocurrency market and the volume of trades falls, then the best time to buy.
Important Considerations:
Historical patterns suggest a relationship between cumulative volume and market tops/bottoms, but this indicator should be used in conjunction with other technical analysis tools for informed trading decisions.
Past performance of cumulative volume in relation to market tops or bottoms does not guarantee future outcomes in financial markets.
.srb suite pin-upThe essential suite Indicator
that are well integrated to ensure visibility of essential items for trading.
it is very cumbersome to put symbol in the Tradingview chart and combine essential individual indicators one by one.
Moreover even with such a combination, the chart is messy and visibility is not good.
This is because each indicator is not designed with the others in mind.
This suite was developed as a composite-solution to that situation, and will make you happy.
--> This is steamlined pin-up version of .srb suite.
--> A minimal set of indicators for comparing different symbols.
--> This is well-balanced alternative next version of previous .b pin-up symbol
BTC-agg. Volume
4 BTC-spot & 4 BTC-PERP volume aggregated.
It might helps you don't miss out on important volume flows.
Weighted to spot trading volume when using PERP+spot volume .
If enabled, BTC-agg.Vol automatically applied when selecting BTC-pair.
--> This is used in calculations involving volumes, such as VWAP .
Moving Average
1 x JMA trend ribbon ; Accurately follow short-term trend changes.
2 x EMA ribbon ; zone , not the line.
MA extension line ; It provide high visibility to recognize the direction of the MA.
SPECIAL TOOLS
BB regular (Dev. 2.0, 2.5)
BB Extented (Dev. 2.5, 3.0, 3.5)
SPECIAL TOOLS - Ultra Volume Marking
x2 x4 greater than regular average volume, it will help you can take the reversal
It does not directly indicate volume, but ultra-volume marking is enough for compare.
---------------------------------------------------------------------------------------------------------------------------------------
if you have any questions freely contact to me by message on tradingview
but please understand that responses may be quite late.
Special thanks to all of contributors of community.
The script may be freely distributed under the MIT license.

Indicator for proxy BTC and ALT dominanceThis indicator calculates a proxy for BTC dominance and ALT domance from total crypto cap by removing USDT and USDC. The indicator has 4 plots:
Proxy BTC Dominance = BTC dominance / (total crypto cap - stablecoin cap)
Proxy ALT Dominance = (Total crypto cap - stablecoins - btc cap) / (total crypto cap - stablecoin cap)
A reference plot of BTC Dominance
A reference plot of Stablecoin dominance

.b pin-up symbolWhen trading cryptocoins, it is necessary to check the price trend of NASDAQ, BTC.D, BTC.OI, BTC spot or other coins of similar groups.
However it is very cumbersome to put a comparison symbol in the Tradingview chart and combine individual indicators one by one.
Moreover even with such a combination, the chart is messy and visibility is not good.
This script was developed as a composite-solution to that situation, and will make you happy.
- NQ1!, USTECH100CFD | symbol fixed
- BTC.Dominance, BTC.OpenInterest, BTC symbol, others pin-up-symbol | selectable
- Pin-up-symbol | selectable
- Pin-up-symbol's candle chart
- Trending
* EMA 9,21,50,200 ribbon classic EMA
* .b price line ; .b price = unique trending price with price-action + relative-volume-action + ATR
* Dynamic S/R Cloud ; BB + donchian band + high/low + atr mixed custom-logic
* VWWMA + .b price Shadow ; Volume-weighted WMA on .b price = unique MA faster than classic VWMA
Trending shadow direction is not bad even on low-timeframe (1, 2, 3, 5m, 15m...)
- Pattern
* Harmonic Pattern ; A simplified version of the harmonic pattern indicator, simply show-up pattern complete position
for reference only - adopted from HeWhoMustNotBeNamed's script.
- Information Panel
* BTC Dominance, BTC Open Interest, Pin-Up-Symbol price
* Trend meter ; 5,15,30,1h,2h,4h Meter Calc with 1 minute-timeframe candles
5 = Green if the current price is higher than the price 5 minutes ago.
1h = Green if the current price is higher than the price 2 hours ago.
4h = Red if the current price is lower than the price 4 hours ago.
* caution ; To use real-time chart of "CME_MINI:NQ1!" you have to additional subscribe CME data,
default setting is 'NQ1!' , you can change to 'USTECH100CFD'
* When you choose symbol which is closed trading hours, the script's update stopped.
Even if the selected pin-up-symbol is on trading hours, the currently selected symbol's chart doesn't update.
* recommended | chart setting > Appearance : Top margin 0%, Bottom margin 0% for optimized screen usage :)
if you have any questions freely contact to me by message on tradingview, or telegram @sr_bt
but please understand that responses may be quite late.
------------------------------------------------------------------------------------------------------------------------------------------------------------
copyright 2022 (sr_b)
Special thanks to all of contributors of community.
The script (originaly .b) may be freely distributed under the MIT license.
The other classic script code also may be freely distributed under the MIT license.
Simplified Harmonic script part | core adopted from 'Multi ZigZag Harmonic Patterns (HeWhoMustNotBeNamed)' MPL2.0 license

Crypto Market Caps (BTC, ETH, TOTAL3)RSI based Crypto Market Caps (BTC, ETH, TOTAL3) Oscillator
This oscillator displays market caps for:
BTC : CRYPTOCAP:BTC -> in orange
ETH : CRYPTOCAP:ETH -> in gray
ALT (Total crypto excl. BTC & ETH): CRYPTOCAP:TOTAL3 -> in blue
In the settings you can edit:
The 3 market cap symbols
RSI length
All colours ;-)
Hope you enjoy!
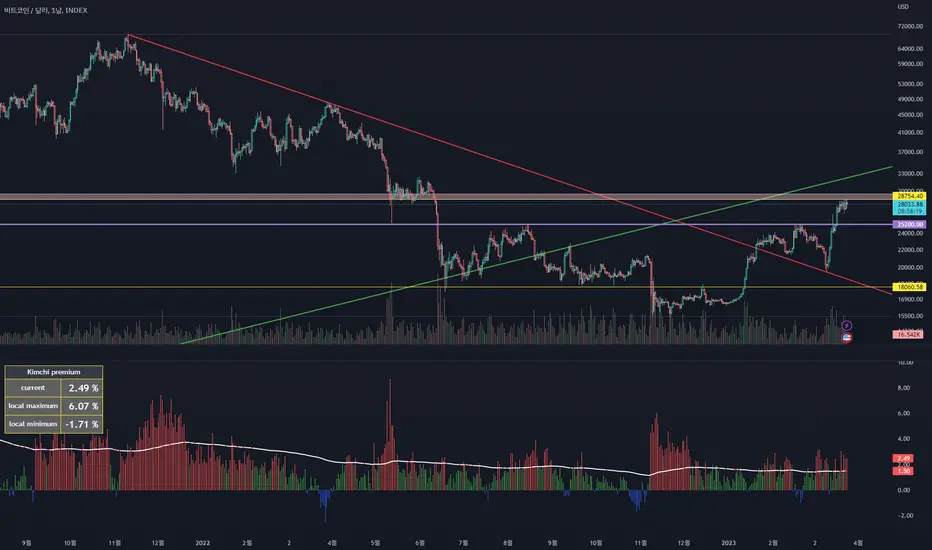
kimchi(korea) premium percent - bithumb btc / binance btcThis script was created to confirm the fear of kimchi premium in the cryptocurrency market.
The basic operation formula is as follows.
premium(percent) = (BTC KRW - (BTC USDT x USD KRW) / (BTC USDT x USD KRW)) x 100
By calculating the premium, you can check melt up rally.
Looking at the chart, when kimchi's premium reaches 6-8 percent, BTC faces great volatility (mainly downside).
So, a color warning was made for values outside of -2~2%, which is the general kimchi premium (can be changed in settings).
Also, a zero line has been added for readability.
Also, a color change has been added to the ema to see if the value of each market moves in the opposite direction based on the previous candle's closing price. If the two markets move separately, the ema is colored red.
I think this script is a very simple indicator.
It is usually recommended to get value in a large time frame.
Thank you.
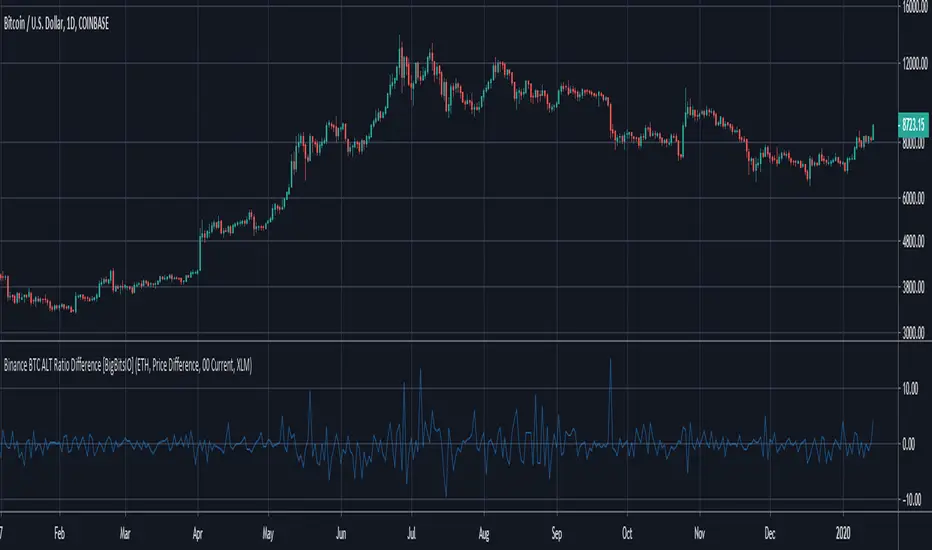
Binance BTC ALT Ratio Difference [BigBitsIO]This was a follower suggested script. This script compares the USDT and BTC relative prices of a particular altcoin traded on Binance by calculating it's USDT price comparative to BTC. This is a very simple calculation (ALT/USDT price divided by ALT/BTC price). From there, we simply subtract the BTC/USDT price from the ALT ration price and we can see if a coin is trading comparatively high or low compared to it's BTC relative price.
This indicator may or may not be useful for you. However, for the purposes of my development series for indicators, I have published it to highlight the ability to concatenate strings to manipulate securities.
Features:
- Dropdown to choose from several built-in altcoin selections.
- Dropdown to choose to show a USDT base difference in the ratio, or a percentage based difference (might be useful for considering fees).
- Dropdown to choose the resolution of the indicator.
- Checkbox to toggle the option to use a custom altcoin.
- Text input to allow entry of a custom altcoin from Binance. Please only use the prefix on its trading pair vs. BTC. I cannot guarantee this will work with all altcoins. They must be traded vs. USDT and BTC on Binance.
- Concatenated strings to manipulate selected securities.
*** DISCLAIMER: For educational and entertainment purposes only. Nothing in this content should be interpreted as financial advice or a recommendation to buy or sell any sort of security or investment including all types of crypto. DYOR, TYOB. ***