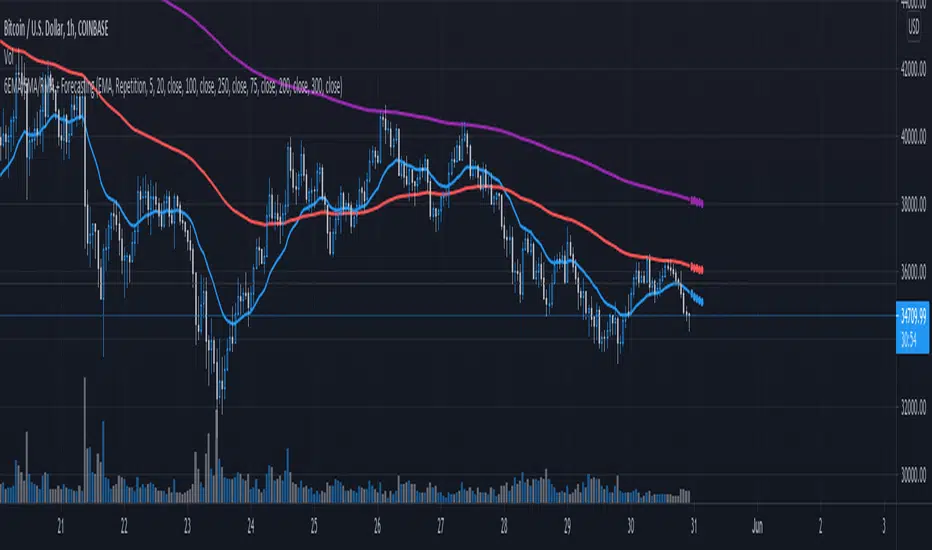
6 EMA SMA RMA + ForecastingDescription:
Hey hi, this Script is a bit simple. Let's start with some definitions.
Moving Average (MA)
In statistics, a moving average is a calculation used to analyze data points by creating a series of averages of different subsets of the full data set. In finance, a moving average (MA) is a stock indicator that is commonly used in technical analysis . The reason for calculating the moving average of a stock is to help smooth out the price data by creating a constantly updated average price . This makes this tool one of the most important for technical analysis .
Forecasting
Forecasting is the process of making predictions based on past and present data and most commonly by analysis of trends . In the same way that the moving average (MA) the forecasting is something highly desirable, in this way we opted to develop an indicator that allows the use of up to 6 moving averages combined with the forecasting.
In addition to having the option of up to 6 moving averages, these can be of different types, being able to choose between up to 3 options (it is proposed to add more options later) which are listed below.
Exponential Moving Average ( EMA )
Simple Moving Average ( SMA )
Running Moving Average (RMA)
In addition to the above, 2 prediction methods were added, which are listed and detailed below.
Repetition. Makes forecast repeating the last candle M times.
Linear Regression ( LR ). Linear Regression does N period LR forecast averaged with length-N Moving Average
Sma
Directional Matrix [LuxAlgo]Returns a dashboard showing the direction taken by 4 overlay indicators, SMA (simple moving average), TMA (triangular moving average), WMA (weighted moving average), and REG (linear regression), all using different length periods.
The user can select the minimum and maximum length of these indicators and introduce an increment.
1. Settings
Maximum Length: The end value of sequences of the indicator periods to analyze
Minimum Length: The starting value of sequences of the indicator periods to analyze
Step: Determines the spacing between each indicator periods values
Src: Data source for each of the 4 indicators
1.1 Style settings
Normalized Change Mode: Allows the user to access a different interpretation of the indicator by showing the normalized first differences of each indicator in the dashboard instead of their sign
Dashboard Location: Location of the dashboard on the chart
Dashboard Size: Size of the dashboard on the chart
Text/Frame Color: Determines the color of the frame grid as well as the text color
Bullish Cell Color: Determines the color of cell associated with a rising indicator direction
Bearish Cell Color: Determines the color of cell associated with a decreasing indicator direction
Cell Transparency: Transparency of each cell
2. Usage
Each of the indicators included in the dashboard aim to give an estimate of the underlying trend in the price. Knowing which direction they are taking can help us have a broader view regarding the direction of shorter/longer-term trends. We will later see that this is not the only kind of information that we can get from this indicator.
Rising indicators are represented by blue cells (or the color selected in the Bullish Cell Color setting) while decreasing indicators are represented by red cells (or the color selected in the Bearish Cell Color setting).
The percentage of bullish cells is given in the top-left cell of the dashboard.
2.1 Normalized change mode
Enabling the Normalized Change mode will display the normalized changes returned by the indicators over different length periods. This metric is within a range (0,1), with 1 indicating the highest change over the selected length periods, while 0 indicates the lowest one.
When enabling this mode the color of the cells makes use of a gradient with a color palette ranging from the color selected in the Bearish Cell setting to the color selected in the Bullish Cell setting.
2.1 Other Usage
The direction taken by certain indicators can give more information than one would think. Indeed, the sign of the change of one indicator can often be given by different indicators.
A positive change in a simple moving average indicates that the price is greater than the price p bars ago, where p is the period of the simple moving average.
A positive change in a triangular moving average indicates that a simple moving average of period p is above a simple moving average of period p × 2 , where p is the period of the triangular moving average (note that we assume here that the TMA is given by cascading two SMAs of period p ).
A positive change in a weighted moving average indicates that the price is above a simple moving average of period p+1 , where p is the period of the WMA.
Finally, a positive change in a linear regression indicates that a weighted moving average is above a simple moving average of period p , where p is the period of the linear regression.

Average Band by HarmanUsually, Moving Averages (Simple & Exponential) consider "close" of each candle to form a line for a particular period. In this indicator, we have considered all the parameters (Open, Close, Low & High) of each candle to form a Band or a wave which act as a zone to provide support & resistance. It works well on all the time frames. It perfectly works on lower time frames of 15 min & 5 min for intraday trades and even for scalping. There is a line that moves very near to candles known as "Candle Line" provide support & resistance to each individual candle and a leading line which moves ahead also acts as support & resistance and helps in determining trend direction.
How to use the indicator ?
Indicator consists of 3 components :
1) A Band or wave of 3 lines (upper, middle & lower line)
2) A "Candle Line" which moves along with the candles
3) A Leading line which moves ahead of the candles
Method 1 : When candles are being formed above the candle line (line near to candles) and it crosses the band or wave from below to upside, then long trade can be initiated. Similarly, When candles are being formed below the Candle line and it crosses the band or wave from upside then short trade can be initiated. Stop loss can be maintained below the band for Long trade and above the band for short trade. Candle line can be used to trail the stop loss.
Method 2: If candles moves above and below of the band very often and frequently and candle line is in the middle of candles then it is NO TRADING ZONE. If you still want to trade, then select a higher time frame and check the price movement. If there is a stability in the higher time frame, then take the trade in the higher timeframe with stable movement.
Method 3 : Candle line acts as "First line of Defence". In a uptrend, all the candles are formed above the candle line and in case of down trend, all the candles are formed below the candle line. When a newly formed candle cross the candle line then you can book profit. For Example : In uptrend , candles are being formed above the line, when a new candle started forming below the line and when the complete candle is formed below the line, profit can be booked. Vice-versa in case of downtrend.
Method 4: Direction of leading line, band and candle line helps in determining the trend. If all these three components are in upward direction, price trend is upward and if all these three components are in downward direction, then price trend is downward. When, leading line and band cross each other from opposite direction for consecutive 2-3 times, then price movement is sideways.
Method 5 : Thickness of band play an important role in determining price action. If band is narrow, it means small candles are being formed and no any huge price movement is observed in this period. When band started expanding, it signifies that big candles are begin to form and there is a more price movement than before. Similarly, If contraction of band started, it means that small candles are being formed and there is low price movement as compared to the price movement when Band was expanded. If Band is expanded (wider) and volumes are high, It means the Band will act as strong Support or Resistance than usual. In case, candles and candle line cross the expanded Band, you can enter the Long or Short trade.
Method 6: When the Band, leading line and candle line collides or meet at a single point, then it is either strong support or resistance.
Method 7 : Usage in Scalping : Select the shorter time frame of 1 min or 5 min. If the candles are crossing the band very frequently in 1 min, then select 5 min time frame or wait for few minutes for stability. Now, when candles started forming above the candle line and it crosses the band from below then take a long position and book profit after few candles above the band. Place stop loss below the Band. Similarly, when candles started forming below the candle line and it crosses the band from above, then enter into short trade and book profit after few candles. Place stop loss above the band in the case of short trade.
You can combine above methods to give a sharp edge to your trade and increase the probability of your winning in the trade.
Indicator Settings : Default period selected is 50 for both the Band and leading line. You can change the period to 26 or 100 or 200. Select the period and check the chart, if the indicator looks fine and smooth, then you can use your settings. For most of the time, default settings work perfectly.
Proudly Developed by :
Harmandeep Singh
Graduate in Computer Science with Physics & Mathematics
MBA in Business Marketing and Finance
Experienced Computer programmer & Software developer
Stock Market & Crypto Trader

Moving Average Buy/Sell IndicatorUsing a selected Exponential Moving Average (EMA)/Simple Moving Average (SMA) range, this indicator inserts a Long/Short (buy/sell) indicator overlaid on chart depending on the following conditions:
- LONG/BUY SIGNAL = if SMA value is less than EMA, and both the SMA and EMA are less than the current average price.
- SHORT/SELL SIGNAL = if SMA value is greater than EMA, and both the SMA and EMA are greater than the current average price.
**Intended for use with the 21 and 34 weekly moving average time range. Much more useful for long-term analysis rather than short-term analysis.**

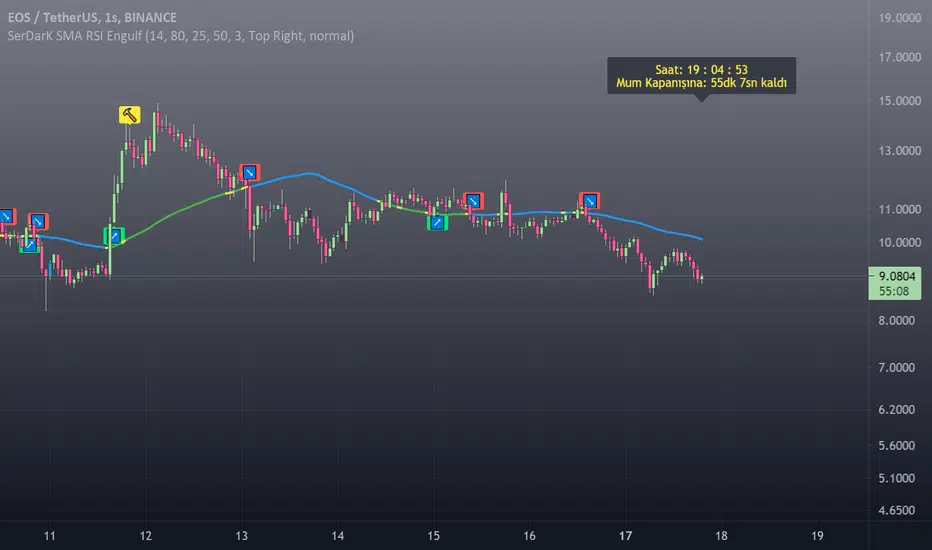
[SerDarK] SMA RSI Engulfing BarENG: This indicator includes the SMA line colored according to the price position, the RSI to identify the bearish or the bullish points, the Engulfing bars, the clock and the information panel showing the countdown to the candle closing.
SMA: default period is set to 50. It can change from the settings.
Definition of SMA line default colors: When the price is below the SMA line, its color is blue. It is green when the price is above the SMA line. It is yellow in RSI alerts and when the price hits the SMA line.
RSI: default period 14 is set. It can be changed in the settings.
🔨 Hammer Emoji: RSI is located at the overbought turnaround point. This sign does not mean that the trend will definitely return.
🚀Rocket Emoji: Tries to catch the "RSI oversold point turn".This sign does not mean that the trend will definitely return.
↗️↘️Up and Down arrows emojis. After the price crosses the SMA line, it indicates that it is closing a candle in that direction.
Engulfing candles: bullish engulfing candle is blue color. Bear engulfing candle is black in color.colors can be changed in settings.
Note that this indicator is only an indicator. It does not give advice on buying or selling.
Enjoy
TUR: Bu indikatör, fiyat konumuna göre renklendirilmiş SMA çizgisi, RSI ile düşüş veya yükseliş noktalarını belirleme, Engulfing (Yutan) barlar , saat ve mum kapanışı için geri sayım gösteren bilgi paneli içermektedir.
SMA: varsayılan periyodu 50 ayarlıdır. Ayarlardan değiştirebilir.
SMA çizgisi varsayılan renklerinin tanımı: Fiyat SMA çizgisi altında iken rengi mavidir. Fiyat SMA çizgisi üstünde iken yeşildir. RSI uyarılarında ve fiyat SMA çizgisine temas ettiğinde sarı renktedir.
RSI: varsayılan periyodu 14 ayarlanmıştır. Ayarlardan değiştirilebilir.
🔨 Çekiç Emojisi: RSI aşırı alım dönüş noktasında bulunur. Bu işaret trendin kesin döneceği anlamına gelmez.
🚀Roket Emojisi: "RSI aşırı satım noktası dönüşünü "yakalamaya çalışır. Bu işaret trendin kesin döneceği anlamına gelmez.
↗️↘️Yukarı ve Aşağı yönlü okl emojileri. Fiyat SMA çizgisini kestikten sonra, o yönde mum kapattığını gösterir.
Engulfing mumları: bullish engulfing (yutan boğa) mumu mavi renktir. Bear engulfing (yutan ayı) mumu siyah renktir. Renkler ayarlardan değiştirilebilir.
Not: Bu indikatörün yalnızca gösterge olduğunu unutmayın. Alma satma tavsiyesi vermez.
Kalan süre etiketi BIST gibi sınırlı süreli sembollerde, gün ve daha üstü periyotlarda doğru çalışmayabiliyor.
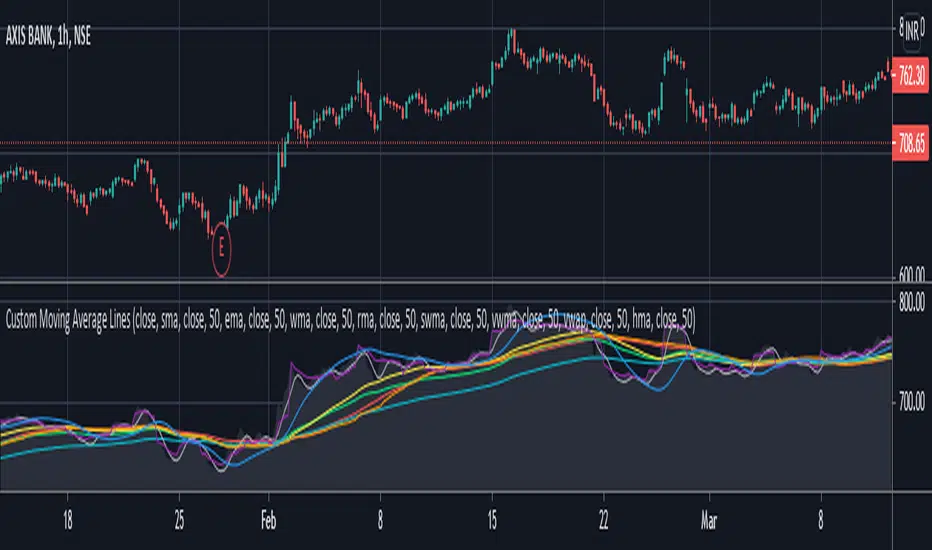
Custom Moving Average LinesHeylo!
This is a script for basic market trend analysis using moving average lines. It features eight lines with eight choices of moving averages and adjustable sources & time periods . The choice of moving averages are stated below:
1. Simple Moving Average (sma)
2. Exponential Moving Average (ema)
3. Weighted Moving Average (wma)
4. Relative Moving Average (rma)
5. Hull Moving Average (hma)
6. Sine-Weighted Moving Average (swma)
7. Volume Weighted Moving Average (vwma)
8. Volume Weighted Average Price (vwap)
Planning on including other formula based indicators soon. Let me know if there can be some improvements made / errors so I can fix it.
Cheers!
Moving Average Crossover with Shading Signals This script uses 3 moving averages (2 simple moving averages and 1 exponential moving average ) to signal long and short opportunities based on moving average crossovers.
A long SMA (Signal SMA2) is used to determine longer term trend. When the EMA crosses above the Slow SMA1 and price is above the Signal SMA2. The space between the moving averages will shade green and the Signal SMA should also be green.
A sell signal occurs when the EMA crosses below the Slow SMA1 and price is below the Signal SMA2. The space between the moving averages will turn red and the Signal SMA should also be red.
A retracement, consolidation, or reversal may be occurring if the shaded color is yellow.
Use the identifying shapes to learn when to open or close positions.

2 Multi-Timeframe Bollinger BandsThis is two separate Bollinger bands in one study. Customizable middle BB line type ( SMA , EMA , VWMA ), legnth, colors, and deviations provided at .5 increments.
Someone else has a very similar Bollinger Band study but the code was hidden, so I figured I would remake as a learning challenge since I'm new to pinescript and this is the best way to learn it imo.
There will be updates to this script in the future but for now it serves its purpose lol. Publishing this version early as I wanted to give some friends access to it
In terms of usage, I like 4h 50 SMA alot . Having two sets of Bollinger bands is nice so you can turn one off or swap between time frames and such. In terms of techniques using both bbands, I haven't really played with it too much yet but simple things like 1h 50sma bbands expanding past the 4h 50sma bbands probably indicate an exaggerated move in that specific time frame, etc etc.
Hope this helps!

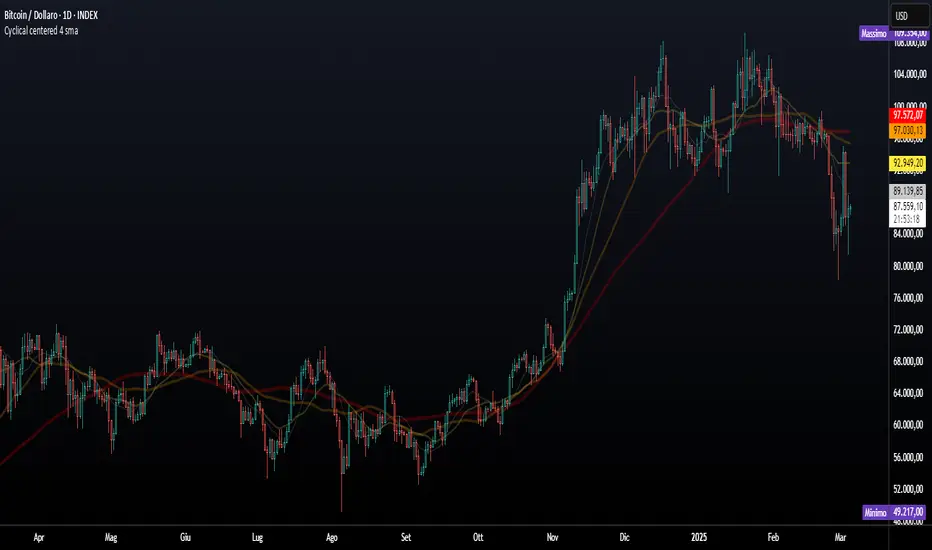
Quad centered moving averages v1This indicator includes four centered moving average!
The missing periods have been reconstructed with a very complex approximation and projection technique!
The hatched areas are approximations of the missing periods projected into the future.
It is possible to set the centering of the averages through the variable "Approximation Lenght" and the ratio between the main average and the underlying in "Period Partition".
Practical example of setting:
"Approximation Lenght" equal to 2 means that the centering will be of half a period.
"Period Partition" makes sure to cascade all averages by dividing them by the same number.
//Once decided the Main Cycle (default 256) we will get the 4 averages:
-red to 128
-orange 64
-yellow 32
-white 16
This is a great tool for cyclical analysis.
It is not possible, due to the pinescript v4 language limit, to set the average under 35 periods and over 1070 periods.
For any bugs contact the creators
Single centered moving average v1This indicator is a centered moving average!
The missing periods have been reconstructed with a very complex approximation and projection technique!
On the chart I loaded a simple 180-period average in blue and our average centered in yellow.
The hatched area is the approximation of the missing periods projected into the future.
It is possible to set the centering of the average through the offset ratio:
2 is half a period behind; 4 is a quarter of a period behind.
This is a great tool for cyclical analysis.
It is not possible, due to the pinescript v4 language limit, to set the average over 1.000 periods.
For any bugs contact the creators

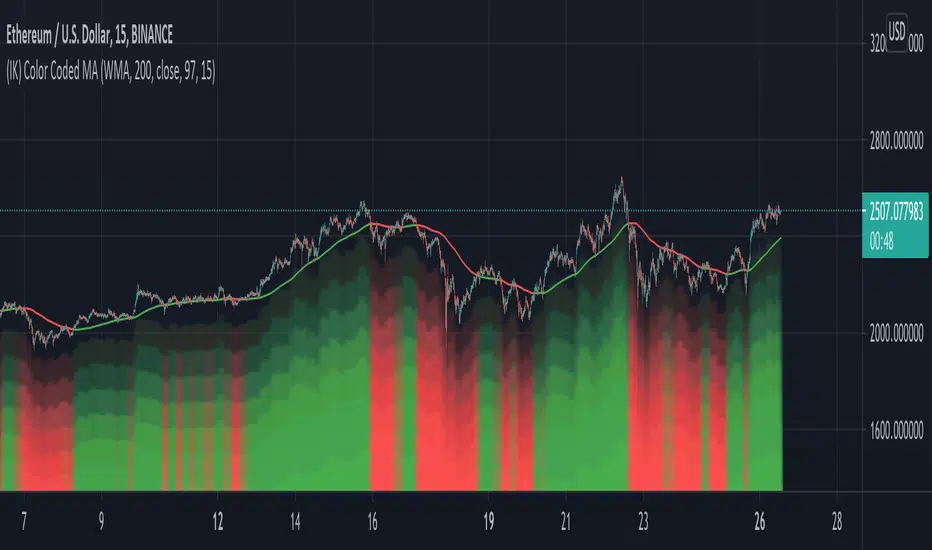
(IK) Color Coded MAJust a simple Moving Average indicator. Choose between SMA, EMA, and WMA, set the length and the source. There are 3 color indicators that represent whether price is above or below the moving average:
- the moving average line itself
- the background of the chart (optional)
- the 'underglow' of price action (optional - set 'underglow strength' to 0 to turn off)
You can customize the colors
I wasn't planning on publishing this, because, again, it doesn't really do anything special, but I've been using it for a little bit now in place of regular MAs, and I really dig the visual effect of the underglow, so I thought I'd share.
Feel free to steal/modify this.
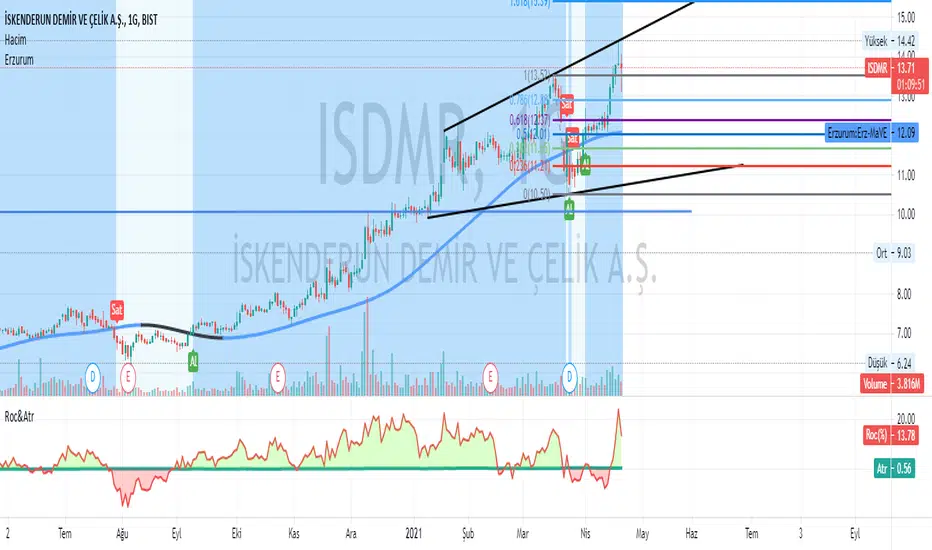
Erzurum Indicators (By DadashKadir)Erzurum Indicators (By DadashKadir)
An indicator in which you will keep track of the buying and selling movements by adding the movements of the three moving averages together. The parameters were determined as Moving Average (SMA), Exponential Moving Average (EMA), Weighted Moving Average (WMA) and Volume Weighted Moving Average (VWMA). Its constant value was taken as WMA. It is used to calculate the averages of 3 - 5 and 7. You can include the standard deviation (STDEV) in these moving averages.
The name of the indicator is taken from our city of Erzurum, the pearl of Eastern Anatolia.
Overlay Indicators (EMAs, SMAs, Ichimoku & Bollinger Bands)This is a combination of popular overlay indicators that are used for dynamic support and resistance, trade targets and trend strength.
Included are:
-> 6 Exponential Moving Averages
-> 6 Simple Moving Averages
-> Ichimoku Cloud
-> Bollinger Bands
-> There is also a weekend background marker ideal for cryptocurrency trading
Using all these indicators in conjunction with each other provide great confluence and confidence in trades and price targets.
An explanation of each indicator is listed below.
What Is an Exponential Moving Average (EMA)?
"An exponential moving average (EMA) is a type of moving average (MA) that places a greater weight and significance on the most recent data points. The exponential moving average is also referred to as the exponentially weighted moving average. An exponentially weighted moving average reacts more significantly to recent price changes than a simple moving average (SMA), which applies an equal weight to all observations in the period.
What Does the Exponential Moving Average Tell You?
The 12- and 26-day exponential moving averages (EMAs) are often the most quoted and analyzed short-term averages. The 12- and 26-day are used to create indicators like the moving average convergence divergence (MACD) and the percentage price oscillator (PPO). In general, the 50- and 200-day EMAs are used as indicators for long-term trends. When a stock price crosses its 200-day moving average, it is a technical signal that a reversal has occurred.
Traders who employ technical analysis find moving averages very useful and insightful when applied correctly. However, they also realize that these signals can create havoc when used improperly or misinterpreted. All the moving averages commonly used in technical analysis are, by their very nature, lagging indicators."
Source: www.investopedia.com
Popular EMA lookback periods include fibonacci numbers and round numbers such as the 100 or 200. The default values of the EMAs in this indicator are the most widely used, specifically for cryptocurrency but they also work very well with traditional.
EMAs are normally used in conjunction with Simple Moving Averages.
" What Is Simple Moving Average (SMA)?
A simple moving average (SMA) calculates the average of a selected range of prices, usually closing prices, by the number of periods in that range.
Simple Moving Average vs. Exponential Moving Average
The major difference between an exponential moving average (EMA) and a simple moving average is the sensitivity each one shows to changes in the data used in its calculation. More specifically, the EMA gives a higher weighting to recent prices, while the SMA assigns an equal weighting to all values."
Source: www.investopedia.com
In this indicator, I've included 6 popular moving averages that are commonly used. Most traders will find specific settings for their own personal trading style.
Along with the EMA and SMA, another indicator that is good for finding confluence between these two is the Ichimoku Cloud.
" What is the Ichimoku Cloud?
The Ichimoku Cloud is a collection of technical indicators that show support and resistance levels, as well as momentum and trend direction. It does this by taking multiple averages and plotting them on the chart. It also uses these figures to compute a "cloud" which attempts to forecast where the price may find support or resistance in the future.
The Ichimoku cloud was developed by Goichi Hosoda, a Japanese journalist, and published in the late 1960s.1 It provides more data points than the standard candlestick chart. While it seems complicated at first glance, those familiar with how to read the charts often find it easy to understand with well-defined trading signals."
More info can be seen here: www.investopedia.com
I have changed the default settings on the Ichimoku to suit cryptocurrency trading (as cryptocurrency is usually fast and thus require slightly longer lookbacks) to 20 60 120 30.
Along with the Ichimoku, I like to use Bollinger Bands to not only find confluence for support and resistance but for price discovery targets and trend strength.
" What Is a Bollinger Band®?
A Bollinger Band® is a technical analysis tool defined by a set of trendlines plotted two standard deviations (positively and negatively) away from a simple moving average (SMA) of a security's price, but which can be adjusted to user preferences.
Bollinger Bands® were developed and copyrighted by famous technical trader John Bollinger, designed to discover opportunities that give investors a higher probability of properly identifying when an asset is oversold or overbought."
This article goes into great detail of the complexities of using the Bollinger band and how to use it.
=======
This indicator combines all these powerful indicators into one so that it is easier to input different settings, turn specific tools on or off and can be easily customised.

NSDT MTF Moving AverageThis script allows you to choose a movingaverage type and length, and then choose two different chart time frames. It will plot a movingaverage line for each time frame you select (total of 2). Choose between EMA, SMA, and WMA.
For example:
You can be looking at a 5-min chart, but have an EMA for a 1-min timeframe and a 10-min timeframe be displayed.

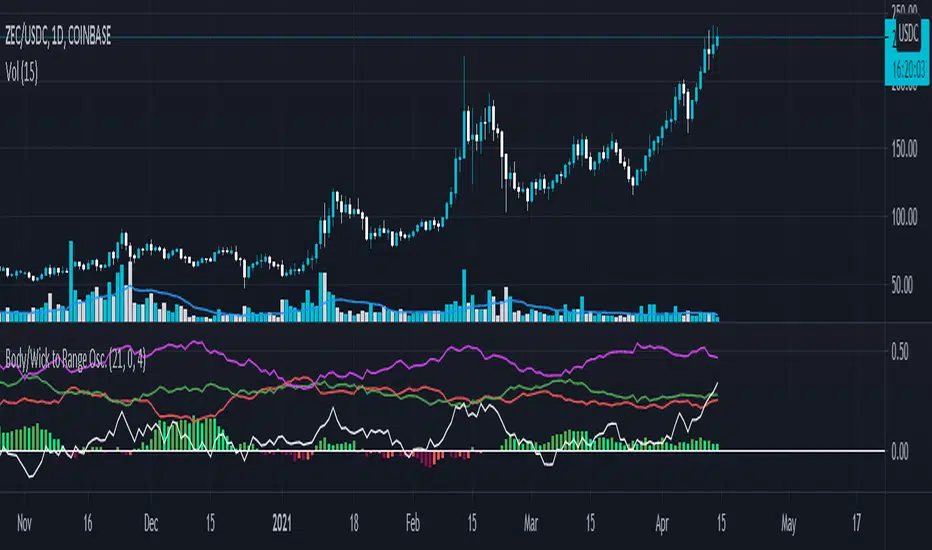
Body/Wick to Range Osc.This script is meant to be a form of pure candlestick analysis.
Terminology in the description used below is as follows:
- numcands = Number of candles specified by the user to be used for sampling in each moving average.
This script plots moving average (SMA/EMA specified by the user ) of the percentage of the high-low range that the previous {numcands} candles the upper wicks, lower wicks, and the body take up.
The user may specify if the absolute value of the body percentage is to be used (true by default). To account for this, a horizontal line is also plotted at 0 to show when the body percentage moves above or below 0.
The values that all of these moving averages plotted will oscillate between 0 and 1 (-1 and 1 for the body percentage if the absolute value of candles is not used).
Other notes: The user may select the colors used (colorblind support, as the defaults are red and green). Cross overs and cross unders are accounted for in alertconditions (as is if the body % moves above and below 0% if absolute values are not used).
An interpretation of the use of this script may be: If the upper wicks begin to take up a larger portion of the high-low range, it may signal downward selling pressure (and vise-versa for lower wicks). However, this may be open to interpretation based upon the specified {numcands} used.
Fib-Simple MA MultiplesThis is just a Simple Moving Average script with several multipliers at Fibonacci number values. You can adjust the MA lengths and source value. Enjoy.

3SMA + Ichimoku 2leadlineThis indicator simultaneously displays two lines, which are the leading spans of the Ichimoku Kinko Hyo, and three simple moving averages.
To make it easier to distinguish between the simple moving average line and the line of the Ichimoku Kinko Hyo, the simple moving average line is set to level 2 thickness by default.
Also, the color of Reading Span 1 in the Ichimoku Kinko Hyo has been changed from green to lime to improve color visibility.
I (author of this indicator) use this indicator especially as a simple perspective on the cryptocurrency BTC / USD(USDT).
If this indicator is a problem, moderators don't know about tradingview beginners.
" Visibility " should be a high-priority item not only for indicators but also for graph requirements.
Visibility is one of the most important factors for investors who have to make instant decisions in one minute and one second.
The purpose of this indicator is to display two leading spans that are easily noticed in the Ichimoku cloud and three simple moving averages whose set values can be changed.
This is because chart analysis often uses a combination of a simple moving average of three periods and two lead spans of the Ichimoku cloud.
Also, in chart analysis, green is often displayed with the same thickness on both the moving average line and the Ichimoku cloud.
Therefore, if the moving average line and the Ichimoku cloud often use the same green color, the visibility will drop. Therefore, the green color of Ichimoku cloud was changed to lime color by default.
Tradingview beginners often refer only to the two lines of the leading span of Ichimoku Cloud. Therefore, we decided not to draw lines that are difficult to use.
Many Tradingview beginners don't know that you can change the thickness of the indicator .
Therefore, this indicator shows by DEFAULT the three commonly used simple moving averages that are thickened by one step at the same time.
Also, since the same green color is often used for the Ichimoku cloud and the moving average line, the green color of the preceding span of the Ichimoku cloud is changed to lime color by default.
The originality of this indicator is that it enhances " visibility " so that novice tradingview users will not be confused on the chart screen.
The lines other than the preceding span of the Ichimoku cloud are not displayed, and the moving average line is level 2 thick so that the user can easily see it.
This indicator not only combines a simple moving average and Ichimoku cloud, but also improves "visibility" by not incorporating lines that are difficult to see from the beginning and making it only the minimum display, making it easy for beginners to understand. The purpose is to do.
If any of the other TradingView indicators already meet the following, acknowledge that this indicator is not original.
・Display 3 simple moving averages at the same time
・For visibility, the thickness of the simple moving average line is set to level 2 from the beginning.
・A setting that does not dare to draw lines other than the lead span of Ichimoku cloud.
・Make the moving average line and the Ichimoku cloud line different colors and thicknesses from the beginning.

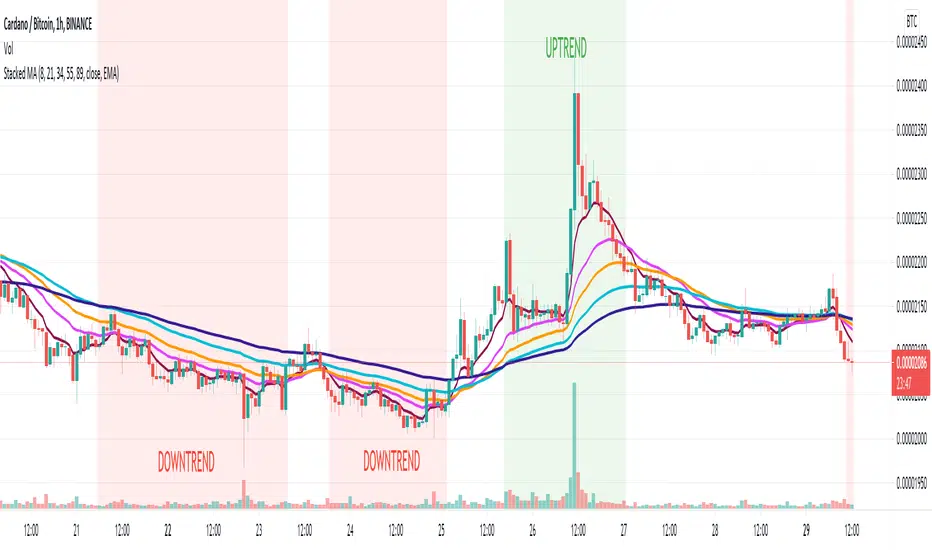
Stacked Moving AveragesThe Stacked Moving Averages indicator lets you see if a ticker is in an uptrend, downtrend, or no trend based on the condition of the moving averages. If the moving averages are stacked such that MA1>MA2>MA3>MA4>MA5, then that is described as an uptrend. If the moving averages are stacked such that MA5>MA4>MA3>MA2>MA1, then that is defined as a downtrend.
The moving averages can be SMA, EMA, or DEMA, and it’s possible to view all the moving average series in the chart or hide all series and only see if there is an uptrend or downtrend according to the condition.
Note: If length 4 OR length 5 is zero the MA4 OR MA5 will be ignored.
Quad MAFor a dive into the fine details, see the source code/documentation.
Quad MA is a program designed to allow a wide range of flexibility in overlaying multiple moving averages onto a chart.
This program handles the ability to:
- Overlay Up to 4 moving averages on the chart.
- Change the length of each moving average.
- Adjust optional values for special moving averages
(least squares and Arnaud Legoux)
- Change the color for each moving average.
- Change the type of each moving average individually.
- Change the visibility of each moving average.
- Change the source of the moving averages.
- Set alerts for a cross between any two moving averages.

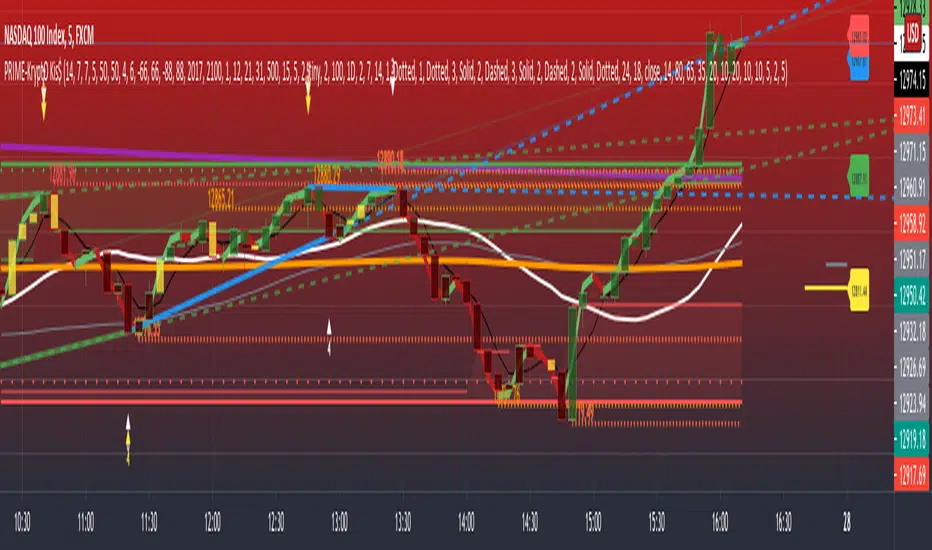
PRIME - Krypto Kiss+CCI+VPIntroducing from Prime Academy, the experimental "KryptO Kis$" algorithm, which combines our most powerful scripts all in one indicator. Available to the user are a full options platform to adjust parameters as well as individually blind indications for precise chart analysis. The following algorithms have been utilized:
* Prime Pulse (3 Candle System) - The original impulse and momentum indication system, it take rsi and tsi data to provide users with the indication of initial impulses, as well as a yellow candle to ascertain when there is a possible change of momentum in the current impulse.
* 5 SMA - The original Sniper Cross system seen from previous strategies, using the 4, 21, 50, 185, and 800 SMA's to determine changes of trend, continuation and support levels.
*CCI Indication on Chart - The system provides realtime CCI data in correlation to price positions within the general chart matrix, receiving system variables from various crosses on the 100 to -100 scale for CCI. Bullish and Bearish indications are clearly defined by separate colors.
* Volume Profile with tags - This system provides current volume data for the current time frame and sequence, also giving available tags at prices holding high volume orders, historically and present as indicated by the difference in length of indications. color saturations indicate the intensity of volume at the price in question .
* Shadow ZoneZ - Provides Support and resistance levels using rsi overbought and over sold data, sourced on the close of previous prices. Also embedded in the code is an additional volume confluence via indications of dotted lines with prices available, giving sequence positions of "Whales" and their support and resistance levels by order volume at price.
* An added bonus of the Shadow ZoneZ is the auto trend line and trend channel function , as well as the highlighted zones of liquidity waiting to be filled from previous impulses and lack of present retracements.
Any questions can be directed here on site via Direct Message. Any feedback is welcomed, and thank you in advance. Trade Well, Family!
- Dee Prime
//Disclaimer:
//Trading success is all about following your trading strategy and the indicators should fit within your trading strategy, and not to be traded upon solely
//The script is for informational and educational purposes only. Use of the script does not constitute professional and/or financial advice.
//You alone have the sole responsibility of evaluating the script output and risks associated with the use of the script.
//In exchange for using the script, you agree not to hold the publishing TradingView user liable for any possible claim for damages arising from any decision you make based on use of the script.
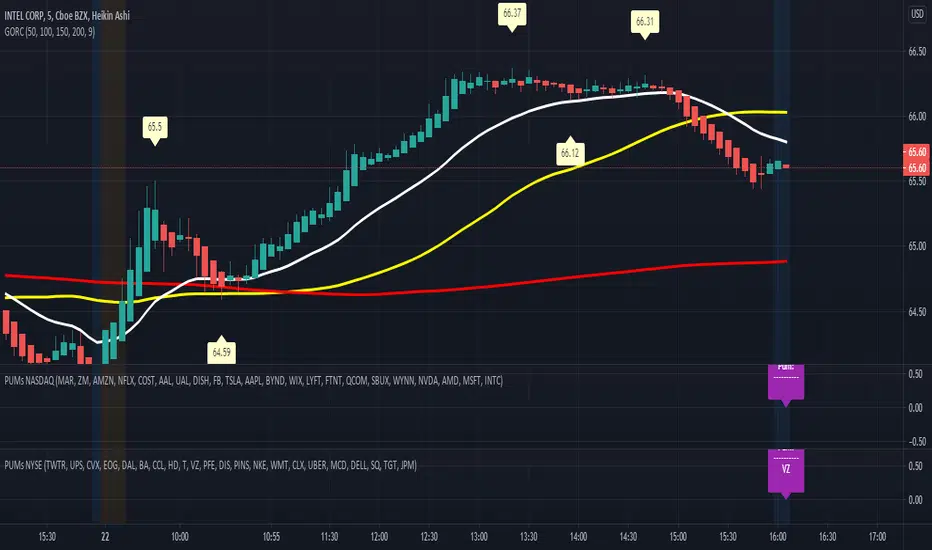
Multicheck NYSE GORCSummary:
This script is an extension of GORC Indicator, it allows to verify if any of 22 different ticker symbols belowing to Nyse Composite Exchange accomplish with a green candle is over a red candle after a rebound in the exponential average of 20 periods, or had a rebound in teh simple moving average of 50 periods
The script will check the condition described above in any timeframe you are positioned. For example: In you are checking INTC (it doesn't matters the ticker symbol you are analyzing) in 4 hours timeframe, the script will check all the 22 ticker symbols selected in order to accomplish the condition, after that if you change to other timeframe, like 5 minutes, ths script will check again but this time in 5 minutes period for the 22 ticker symbols pre-selected, and so on
Options:
You can select any of the ticker symbols that belows to the Nyse Composite Exchange. Maximun number of ticker symbols = 22

Multicheck NASDAQ GORCSummary:
This script is an extension of GORC Indicator, it allows to verify if any of 22 different ticker symbols belowing to Nasdaq Composite Exchange accomplish with a green candle is over a red candle after a rebound in the exponential average of 20 periods, or had a rebound in teh simple moving average of 50 periods
The script will check the condition described above in any timeframe you are positioned. For example: In you are checking INTC (it doesn't matters the ticker symbol you are analyzing) in 4 hours timeframe, the script will check all the 22 ticker symbols selected in order to accomplish the condition, after that if you change to other timeframe, like 5 minutes, ths script will check again but this time in 5 minutes period for the 22 ticker symbols pre-selected, and so on
Options:
You can select any of the ticker symbols that belows to the Nasdaq Composite Exchange. Maximun number of ticker symbols = 22
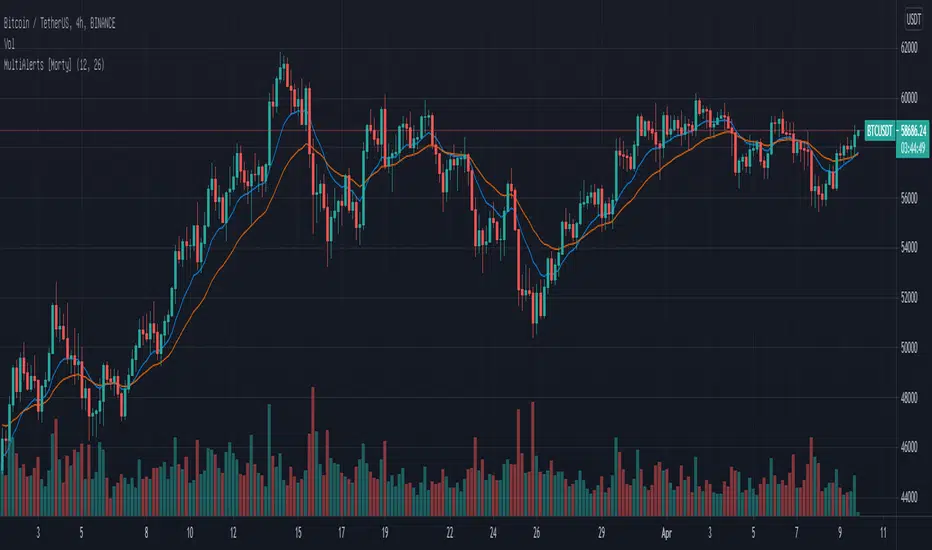
Multiple Alerts by MortyMultiple Alerts by Morty
Version 1.0, Updated at 20210322
When the following signals meet the conditions, alerts will be triggered.
close price cross SMA
SMA_fast cross SMA_slow
MACD cross signal
RSI overbought and oversold
close price cross Bollinger Bands
Momentum cross 0 level
This script will also plot two MAs, EMA default ( SMA optional ).