Daily GAP StatsI did not write the script from scratch but rather started editing code of an existing one. The original code came from a script called GAP DETECTOR by @Asch-
First up: I am a trader, not a programmer and therefore my code most likely is inefficient. If someone with more expertise would like to help and optimize it - feel free to get in touch, I am always happy to learn some new tricks. :)
This script does 2 things:
- It shows daily gaps stats based on user inputs
- It shows color coded labels on gap days with additional information in tooltips ( important: make sure to read 'known issues/limitations' at the end )
User Inputs
==========
Although the input dialog is pretty straight forward, I do a quick rundown:
- Length: max lookback time
- Gap Direction: self explanatory
- Show All Gaps | Cont Only | Reversal Only | Off:
This refers to the way labels are displayed on gap days (again: make sure to read known issues/limitations!)
- Show All Gaps: does what it says
- Cont Only: only shows gaps where price continued in the gap direction. If you filter for gap ups and chose 'Cont only' you will only see labels on gap days where price closed above the open (and vice versa if you scan for gap downs).
- Reversal Only: you will only see labels for closes below the open on gap up days (and the opposite on gap down days)
- Off: self explanatory
- Gap Measure in ATR/PCT: self explanatory, ATR is calculated over a 10d period
- Gap Size (Abs Values): no negative values allowed here. If you filter for gap downs and enter 3 it means it will show gaps where the stock fell more than 3 ATR/PCT on the open.
- RVOL Factor: along with significant gaps should come significant volume. RVOL = volume of the gap day / 20d average volume
- Viewing Options: Placing the stats label in the window is a bit tricky (see knonw issues/limitations) and I was not sure which way I liked better. See for yourself what works best for you.
Known Isusses/Limitations:
=======================
- Positioning of the stats table:
As to my knowledge, Tradingview only allows label positioning relative to price and not relative to the chart window. I tried to always display the gap stats table in the upper right corner, using 52wk high as y-coordinate. This works ok most of the time, but is not pretty. If anybody has some fancy way to tag the label in a fixed position, please get in touch.
- Max number of labels per script:
TradingView has a limitation that allows a maxium of ~50 labels per script. If there are more labels, TradingView will automatically cut the oldest ones, without any notification. I have found this behaviour to be rather inconsistent - sometimes it'll dump labels even if there are a lot fewer than 50. Hopefully TradingView will drop this limitation at one point in the future.
Important: The inconsistent display of the gap day labels has NO INFLUENCE on the calculations in the gap stats table - the count and the calculations are complete and correct!
Statistical

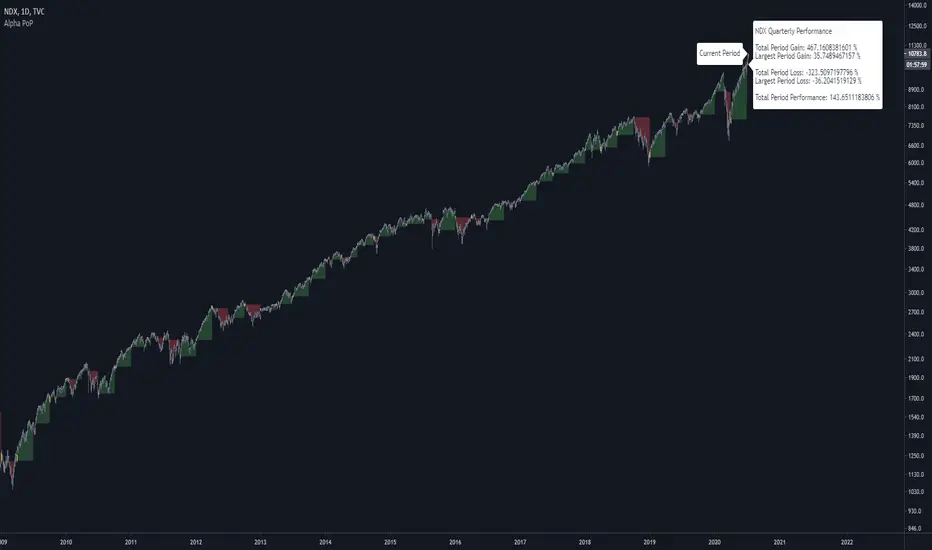
Alpha Performance of PeriodAlpha Performance of Period (PoP) produces a visualization of returns (gains and losses) over a quarterly, monthly, or annual period. It also displays the total % gain and loss over any length of days, months, and years as defined by the user.
Performance of Period (PoP) can be used to understand the performance of an asset over multiple periods using a single chart layout, and to compare the performance of different assets by using a multi-chart layout.
This can, for example, be used to compare the NASDAQ, S&P, and DJI over the past 20 years to create a dow vs. nasdaq vs. s&p performance chart. This can help you understand a comparison of historical returns by showing which performs the best month-over-month, quarter-to-quarter, year-to-year, throughout any custom period of days/months/years.
The ability to get a visualization of the % gain/loss can help to better understand how markets have performed over time and which markets have historically performed the best.
Check out the up and coming Educational Idea we will be releasing soon after this is live to see an example of how we use this tool.
Current Period Label
-----
Current Period : This label shows the current period's performance only when you hover over it.
(This label is located to the left of the current period's open candle and at the current candles close price)
TICKER "Time Period" Performance Label
-----
Total Period Gain : The total of all % gain periods from the start to end date.
Largest Period Gain : The biggest % gain period from the start to end date.
Total Period Loss : The total of all % loss periods from the start to end date.
Largest Period Loss : The biggest % loss period from the start to end date.
Total period Performance : The total % performance, the difference between the total gain and total loss.
NOTE : The "Current Period" performance is excluded from ALL five of the above-mentioned figures. This was done to avoid giving inaccurate comparison figures due to the period not being finished yet.
Inputs
-----
Current Script Version + Info : A drop-down list of instructions for the user to refer to.
Dark Mode Labels : Toggle on for Dark Mode. This is done since Labels text and background color can not be adjusted separately within the visual inputs so this is the best fit solution.
Time Period of Returns : Pick the period of performance you would like to emulate monthly/quarterly/annual.
Start Date : The day to start tracking performance.
Start Month : The month to start tracking performance.
Start Year : The year to start tracking performance.
End Date : The day to stop tracking performance.
End Month : The month to stop tracking performance.
End Year : The year to stop tracking performance.
As always if you have any feedback let us know in the comments and leave a like if you enjoy this tool :)
Ranking Moving Average by Atilla YurtsevenThis is a statistical moving average. This doesn't calculate the mean but the median of the given range and simply ignores the outliers.
Try it yourself...
Disclaimer: This is not financial advice
Follow me to get notified when i publish new indicators.
Trade safe,
Atilla

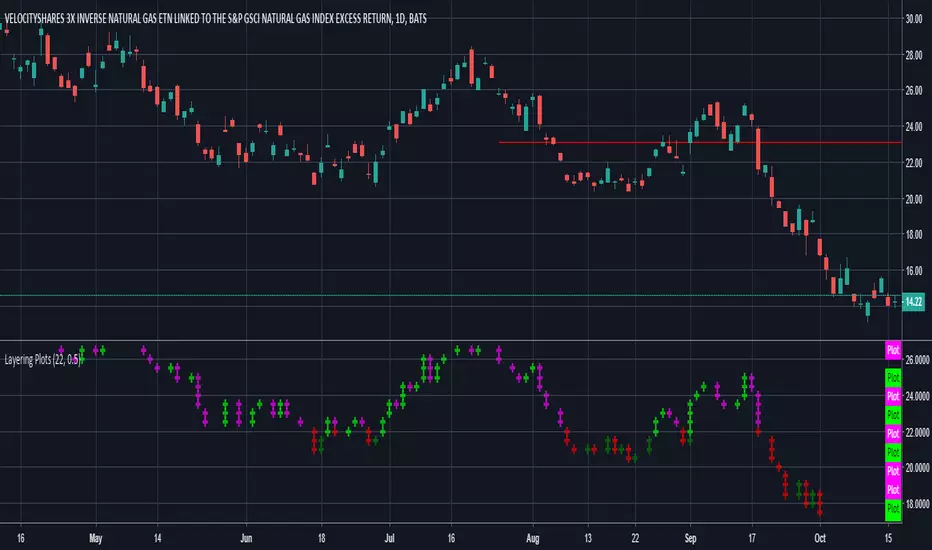
Layering PlotsLets say you want to layer into a position and you'd like to see it turn around. The study lets you set a baseline and increments above and below that baseline. A green cross is plotted ever time the price crosses above one of the increments, and red when crossing below that increment.
In the example I set the baseline to $22.1, and Layer increments to $0.50. So it will plot a cross every 50 cents above and below the baseline. This can be used on any chart period (daily, hourly, 5min...), but is limited to 9 layers above and below the baseline.
NOTES...
Lime = when price crosses above a layer that is above the baseline
Green = when price crosses above a layer below the baseline
Pink = when price crosses below a layer that is above the baseline
Red = when price crosses below a layer below the baseline
IMPORTANT...
This does not plot sometimes. I'm using a crossover crossunder function, and if a candle gaps open below and ends above a layer, this will not plot. It is not in error, just the way that function works. I will be looking to improve this study, wanted to share what I have for now.
Power Momentum by Atilla YurtsevenThe Power Momentum indicator calculates momentum in a different way. The graph may look similar. The important part is the color of the bars.
If you set the "Base Line" to "Zero", there are two important things to notice. The orange color when the bars are below the base and the blue color when the bars are above the base.
If you set the "Base Line" to "Stats", instead of coloring bar, you see the bars in exact positions. For example; "Zero" shows you orange bar below the base line but "Stats" shifts the bars over the Base line.
Momentum is calculated statistically. If the momentum moves over to the preset levels, bar colors change concurrently.
BAR STATES
Orange: Orange bar below the base line means high possibility of an upcoming up movement
Blue: Blue bar above the base line means high possibility of an upcoming down movement
I hope you enjoy this indicator. As I stated in my previous indicators, i use statistical methods while developing my indicators.
Disclaimer: All the information in this article, including the indicator, was provided and published for informational purposes only and should not be considered legal or financial advice. Please use at your own risk.
Please remember to follow me and post some comments so i can share more indicators.
Happy trading! :)
Atilla Yurtseven
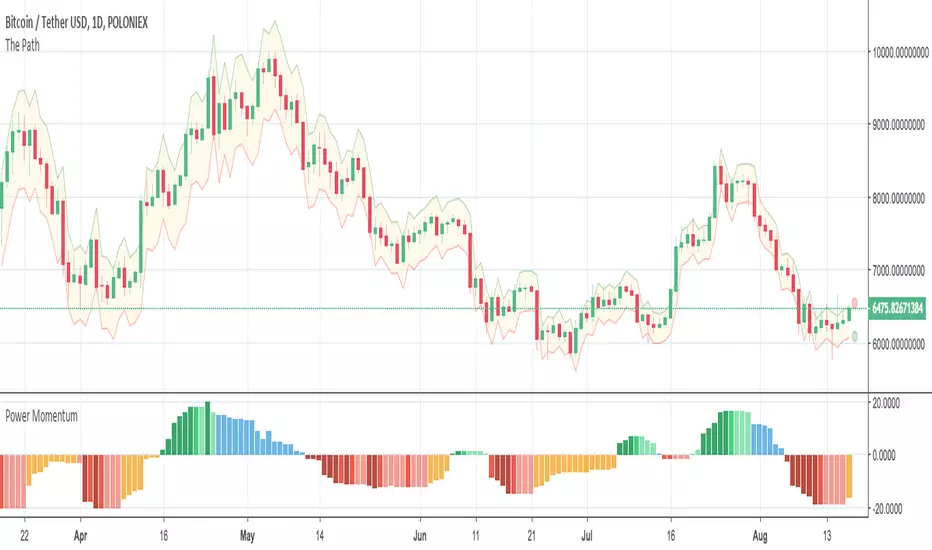
The Path by Atilla Yurtseven: A statistical approach to TradingThe Path uses a statistical method that I have developed to indicate possible Lows and Highs of the current bar for the selected time frame. You can see the range at the opening of the bar. You can narrow or widen the range by changing the "Range %".
What does The Path indicate?
The Path uses a statistical method and calculates the limits of the bar. For example when you enter 75 as "Range %", this means there is 75% probability that High of the bar will be below the top line and 75% probability that Low of the bar will be over the bottom line. You can simply change the range probability between 1-99. The Path looks at the past bars (Look back period) and uses a statistical method to forecast.
The Path does not repaint. Range is there at the opening of the bar and never changes. So when you look at the past data, you can see how it worked well in the past!
The Path works with all time-frames (1min-1month and etc.) and all asset classes (Forex, Stocks, Cryptocurrencies and etc.). It simply works.
Please kindly share your opinions and experiences and feel free to send a comment at the below of this post so i can share more statistical indicators that i have developed based on my method.
Please remember to follow me as well and keep in touch!
FYI: This is an indicator that I have developed for myself. You can use it, apply or not to apply it to your trades. Keep in mind that, you are responsible for all your loses (or wins). Risk is 100% yours. Please use / try "The Path" only if you accept this condition.
Have fun :)
Atilla Yurtseven

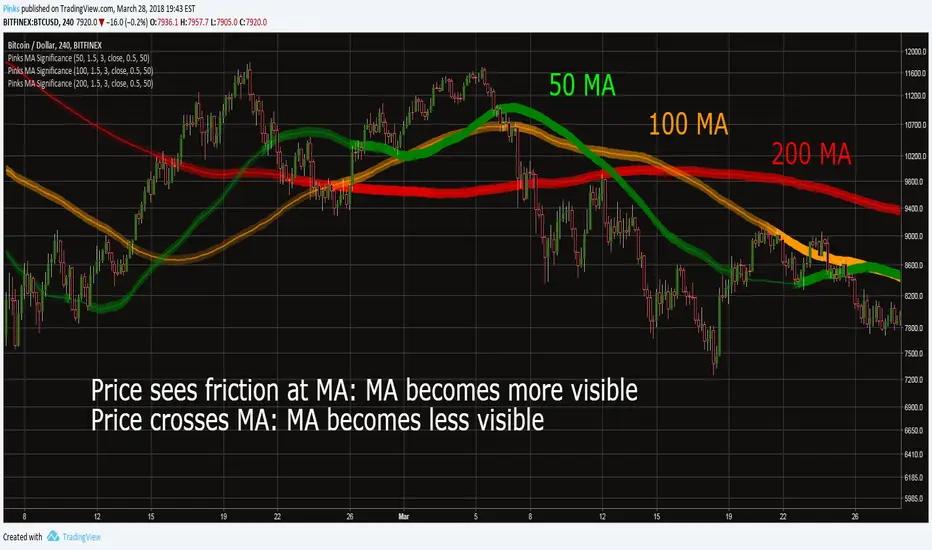
Pinks Moving Average SignificanceThis indicator is meant as a means to assess the significance ("strength") of a Moving Average , in other words how likely it is that price action is going to find support or resistance at the MA.
How it works
When the high or low of a candle is within the band around the MA defined by the "fuzziness" parameter, the significance of the MA increases proportional to how close the wick is to center of the band. When the price crosses fully through the band, its significance decreases. The strength will slowly decrease based on the "Lag Length" parameter.
The significance of the MA can be seen from the strength of its bands color.
How to use
MA Length: The length of the Moving Average.
Fuzziness : Width of the MA band, in percent.
Lag Length: How slowly the MA strength changes.
Source: Source data for Moving Average.
SMA Cross Penalty: How strongly the strength of the MA is reduced when price crosses it. Recommended to leave at default value.
Full color at : When the MA is at this percentage of its full strength, the color of the band will be completely opaque.
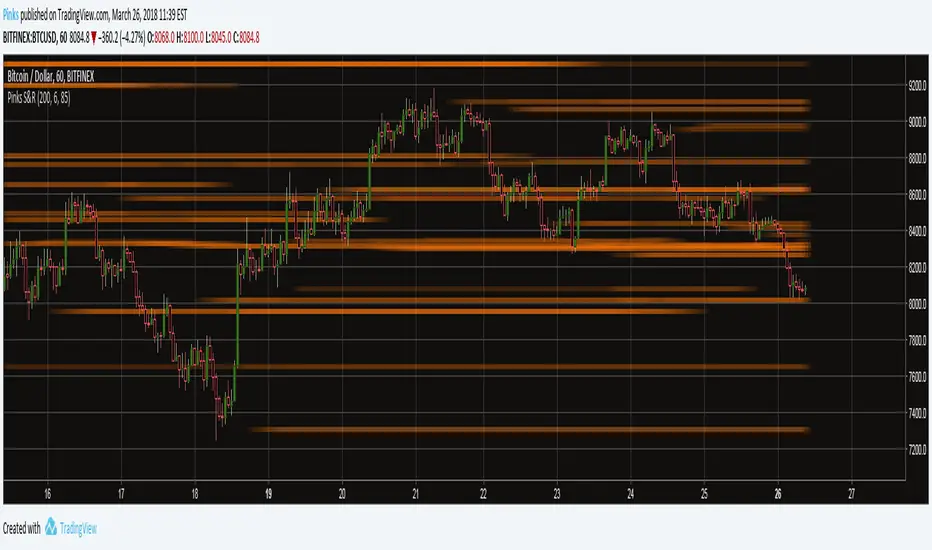
Pinks Statistical Support and ResistanceSupport and Resistance levels based on statistical methods
This is an autonomous Support and Resistance (S&R) indicator that locates levels where the price of an asset is likely to meet resistance or support. It works on all timeframes, and on any asset. It is more advanced than many other indicators that purport to do the same thing.
How to use Pinks Statistical Support and Resistance
It is recommended to turn off Indicator Values when using this indicator. Do do this, perform the following:
Right click somewhere on your chart window background
Click Properties
Click on the "Background" tab
Uncheck "Indicator Values*
Parameters
Length: How many candles in the past the algorithm will use for calculating S&R levels.
Cleanup parameter: How strongly the algorithm will discard certain datapoints it does not consider important in its calculations.
Acceptance: This parameter sets the limit for what the algorithm considers a S&R level. Lower values will display more (and weaker) levels, higher values will show fewer (and stronger) levels.
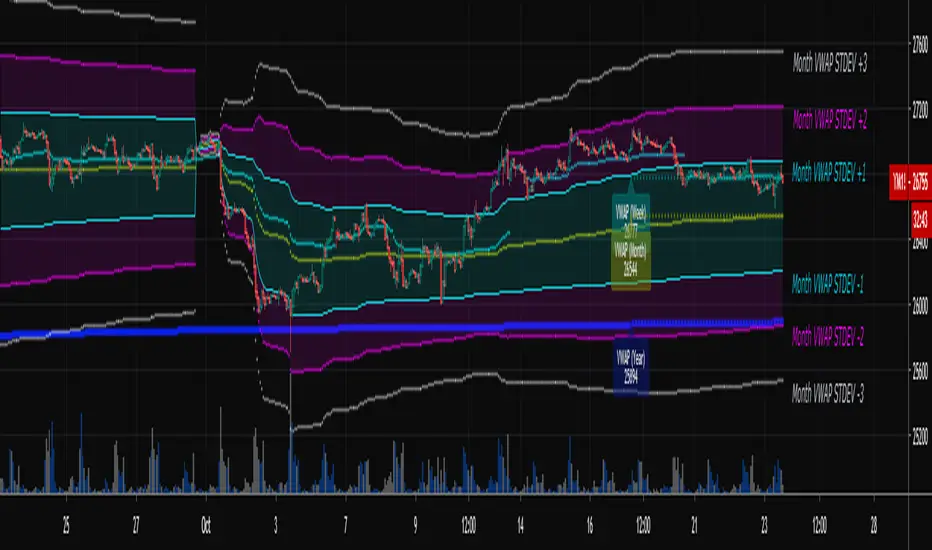
Multi-Timeframe VWAPShows the Daily, Weekly, Monthly, Quarterly, and Yearly VWAP.
Also shows the previous closing VWAP, which is usually very near the HLC3 standard pivot for the previous time frame. i.e. The previous daily VWAP closing price is usually near the current Daily Pivot. Tickers interact well with the previous Daily and Weekly closing VWAP.
Enabling the STDEV bands shows 3 separate standard deviation levels, defaulted at 1, 2, and 3. The lookback period for the bands is always changing with each new bar, since the standard deviation is calculated from the current bar to the beginning of the period. This is different from bollinger bands, as the lookback is constant (usually 20 periods is the textbook default).
The STDEV bands interval of interest can be changed from Day (D), Week (W), Month (M), Quarter (Q), Year (Y).
Tickers tend to bounce very well on Daily, Weekly, and Yearly VWAP (Yes... Year). Use this code and observe the Year VWAP on several major symbols through the past few years and eyes will be opened.
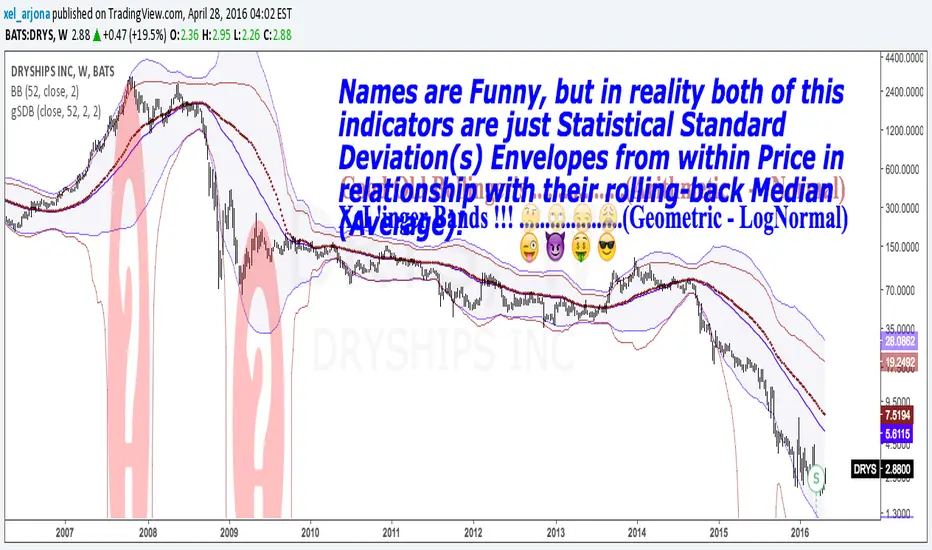
GEOMETRIC STANDARD DEVIATION BANDS v1 by @XeL_ArjonaGEOMETRIC STANDARD DEVIATION BANDS
Ver.1 By Ricardo M Arjona @XeL_Arjona
DISCLAIMER:
The Following indicator/code IS NOT intended to be a formal investment advice or recommendation by the author, nor should be construed as such. Users will be fully responsible by their use regarding their own trading vehicles/assets.
The embedded code and ideas within this work are FREELY AND PUBLICLY available on the Web for NON LUCRATIVE ACTIVITIES and must remain as is.
WHAT'S THIS?
This IS NOT the wheel "Re-Invention"... This is exactly what the name says: A pair of Envelope Bands to measure "volatility", constructed at statistical relation from within price series and their Rolling back MEAN (Simple Moving Average). YES, What Mr. Bollinger did and put it's name to this simple, cleaver and popular formula.
This time, I took the time to make another simple mod, but seems to me to be quite functional in REAL VOLATILE assets like in the example chart: TO USE THEIR GEOMETRIC MODE!!
Cheers!
Any feedback or public modification(s) are quite welcome to the community....!
@XeL_Arjona
Apr 28 2016
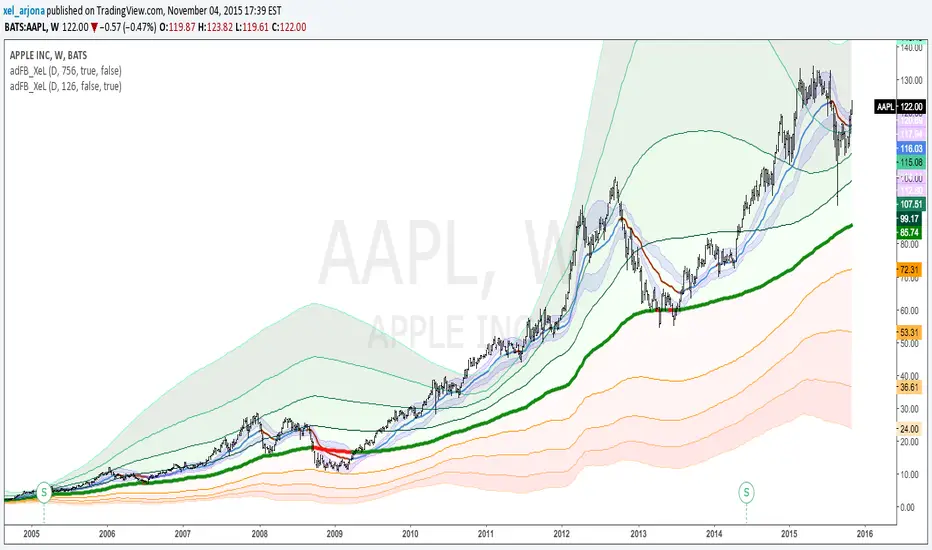
EVWMA Acc/Dist. Pressure & FRACTAL BANDS by @XeL_ArjonaEVWMA ACCUMULATION/DISTRIBUTION PRESSURE & FRACTAL BANDS
Version: 3.0 @ 4.11.2015
By Ricardo M Arjona @XeL_Arjona
DISCLAIMER:
The following indicator IS NOT INTENDED TO BE A FORMAL INVESTMENT ADVICE OR TRADING RECOMMENDATION BY THE AUTHOR, nor should be construed as such. Users will be fully responsible by their use regarding any kind of trading vehicles or assets.
The following script and ideas within this work are FREELY AND PUBLICLY availables on the Web for NON LUCRATIVE ACTIVITIES and must remain as is.
-== IMPORTANT: THIS IS AN EXPERIMENTAL INDICATOR ==-
What is this?
This work is a derivation of my previous Accumulation/Distribution scripts publicly available in TradingView in an effort to clean, speedup and make the indicator cleaner as possible.
The current indicator is based on already tested and Mathematically proof concepts as described below:
The MAIN Rolling back median line or "Vortex" is constructed by a simple and equal weighting of distributed volume along the candle range (This approach is just an "estimator" of Buyers Vs. Sellers given the lack of tick resolution in TradingView, a real "DELTA" can only be 100% reliable with Market Depth (Ask/Bid ticks)), Given this, with each "volume weights", the price is post-processed against a true statistical Average calculation formerly: ELASTIC VOLUME WEIGHTED MOVING AVERAGE.
The FRACTAL BANDS are just Standard Deviation's with GOLDEN RATIO as multiplier (1.618) derived one from each other within it's origin on the former "Vortex Median".
The Standard Error Bands comply as the original indicator described by Jon Andersen but given the true statistical nature of EVWMA, the original LinReg line has been substituted by the former.
ALL NEW IDEAS OR MODIFICATIONS to this indicator are welcome in favor to deploy a better technical tool. Any important addition to this work MUST REMAIN PUBLIC by means of CreativeCommons CC & TradingView user rules. (C) 2015 @XeL_Arjona
Standard Error Bands by @XeL_arjonaStandard Error Bands - Code by @XeL_arjona
Original implementation by:
Traders issue: Stocks & Commodities V. 14:9 (375-379):
Standard Error Bands by Jon Andersen
Version 1
For a quick and publicly open explanation of this Statistical indicator, you can refer at Here!
Extract from the former URL:
Standard Error bands are quite different than Bollinger's. First, they are bands constructed around a linear regression curve. Second, the bands are based on two standard errors above and below this regression line. The error bands measure the standard error of the estimate around the linear regression line. Therefore, as a price series follows the course of the regression line the bands will narrow, showing little error in the estimate. As the market gets noisy and random, the error will be greater resulting in wider bands.

StatArbPair trading is employed by professional traders to outperform the market. This script is a complete trading strategy where you can set your own parameters and the system will generate ready to trade signals. All you have to do is just execute profitable trades based on your own parameters.

Statistical Volatility - Extreme Value Method This indicator used to calculate the statistical volatility, sometime
called historical volatility, based on the Extreme Value Method.
Please use this link to get more information about Volatility.
