RCI3linesこのインジケーターは、異なる3つの期間(短期・中期・長期)のRCI(Rank Correlation Index)を同時に表示します。
複数のRCIを並べて確認することで、相場の過熱感や転換点、トレンドの強弱などをより多角的に判断できます。
それぞれの期間は設定から自由に変更できます。
This indicator displays three RCI (Rank Correlation Index) lines with different periods—short-term, medium-term, and long-term—simultaneously.
By viewing multiple RCIs together, users can make more comprehensive assessments of market conditions such as overbought/oversold signals, potential reversal points, and trend strength.
Each period is fully customizable in the settings.
Statistics

Candle Close Alert# Candle Close Alert ⚡️
A simple and convenient indicator to track candle closes relative to your key price level.
---
### *Key Features:*
* Allows you to set a key price level (*Key Level Price*) 🎯
* Sends alerts when the candle body closes above or below this level 🔔
* Choose the check type in settings:
* **Close only** — triggers if the candle’s close price is above/below the level ⬆️⬇️
* **Whole body** — triggers if the entire candle body (open and close) is above/below the level 🕯️
* The level is shown on the chart as an orange line 📈
* By default, the level is unset and hidden
---
### *How to use:*
1. Enter your desired key level in the indicator settings 🖊️
2. Select the check type (Close only or Whole body) ⚙️
3. Create alerts based on the indicator conditions:
* "↑ Body closed above level"
* "↓ Body closed below level"
4. When creating alerts, **set alert frequency to** ***Once Per Bar Close*** ⏰ — this ensures alerts fire only once per candle close.
⚠️ *Note:* The alert will trigger on the close of **every** candle meeting the condition until the alert is manually turned off.
5. Receive timely notifications about candle closes relative to your key level ⏰
---
# Candle Close Alert ⚡️
Простой и удобный индикатор для отслеживания закрытия свечи относительно ключевого уровня.
---
### *Основные функции:*
* Позволяет задать ключевой уровень цены (*Key Level Price*) 🎯
* Выдаёт уведомление (alert), когда тело свечи закрывается выше или ниже этого уровня 🔔
* В настройках можно выбрать тип проверки:
* **Close only** — срабатывает, если цена закрытия свечи (close) выше/ниже уровня ⬆️⬇️
* **Whole body** — срабатывает, если всё тело свечи (open и close) выше/ниже уровня 🕯️
* Уровень отображается на графике оранжевой линией 📈
* По умолчанию уровень не задан и не отображается
---
### *Как использовать:*
1. Введите желаемый ключевой уровень в настройках индикатора 🖊️
2. Выберите тип проверки (Close only или Whole body) ⚙️
3. Создайте алерты на основе условий индикатора:
* "↑ Тело закрыто выше уровня"
* "↓ Тело закрыто ниже уровня"
4. При создании алерта **обязательно установите частоту срабатывания** ***Один раз за бар (Once Per Bar Close)*** ⏰ — это гарантирует, что алерт сработает ровно один раз при закрытии свечи.
⚠️ *Примечание:* Алерт будет срабатывать на закрытие **каждой** свечи, соответствующей условию, пока не будет выключен вручную.
5. Получайте своевременные уведомления о закрытии свечей относительно важного уровня ⏰

PM20/40/100/200 by Emprendetica📊 PM20/40/100/200 – Custom Moving Averages by Emprendetica
This indicator plots four simple moving averages (SMA): 20, 40, 100, and 200 periods. It’s designed for multi-timeframe traders who need quick and clear visualization of momentum and structural alignment across intraday and daily charts.
✅ Ideal for:
Detecting breakout readiness
Confirming trend strength (e.g., PM20 > PM40, PM100 > PM200)
Monitoring price structure with consistent dynamic support/resistance
📌 Created by Isaías Espinoza and the Emprendetica team.
🌐 More tools at: emprendetica.com

Log Return DistributionThis indicator calculates the statistical distribution of logarithmic returns over a user-defined lookback period and visualizes it as a horizontal profile anchored to the most recent opening price.
Lookback Length: The number of recent bars to include in the distribution analysis. A larger value (e.g., 252) provides a long-term statistical view, while a smaller value (e.g., 20) focuses on recent, short-term volatility.
Bins Count: The number of price levels to divide the distribution into. An odd number is recommended (e.g., 31, 51) to ensure a dedicated central line for the 0% return.
Max Line Length: The horizontal length (in bars) of the line representing the most frequent return bin (the mode). This setting scales the entire profile, allowing you to make differences in frequency more or less pronounced visually.

Fibonacci Sequence Moving Average [BackQuant]Fibonacci Sequence Moving Average with Adaptive Oscillator
1. Overview
The Fibonacci Sequence Moving Average indicator is a two‑part trading framework that combines a custom moving average built from the famous Fibonacci number set with a fully featured oscillator, normalisation engine and divergence suite. The moving average half delivers an adaptive trend line that respects natural market rhythms, while the oscillator half translates that trend information into a bounded momentum stream that is easy to read, easy to compare across assets and rich in confluence signals. Everything from weighting logic to colour palettes can be customised, so the tool comfortably fits scalpers zooming into one‑minute candles as well as position traders running multi‑month trend following campaigns.
2. Core Calculation
Fibonacci periods – The default length array is 5, 8, 13, 21, 34. A single multiplier input lets you scale the whole family up or down without breaking the golden‑ratio spacing. For example a multiplier of 3 yields 15, 24, 39, 63, 102.
Component averages – Each period is passed through Simple Moving Average logic to produce five baseline curves (ma1 through ma5).
Weighting methods – You decide how those five values are blended:
• Equal weighting treats every curve the same.
• Linear weighting applies factors 1‑to‑5 so the slowest curve counts five times as much as the fastest.
• Exponential weighting doubles each step for a fast‑reacting yet still smooth line.
• Fibonacci weighting multiplies each curve by its own period value, honouring the spirit of ratio mathematics.
Smoothing engine – The blended average is then smoothed a second time with your choice of SMA, EMA, DEMA, TEMA, RMA, WMA or HMA. A short smoothing length keeps the result lively, while longer lengths create institution‑grade glide paths that act like dynamic support and resistance.
3. Oscillator Construction
Once the smoothed Fib MA is in place, the script generates a raw oscillator value in one of three flavours:
• Distance – Percentage distance between price and the average. Great for mean‑reversion.
• Momentum – Percentage change of the average itself. Ideal for trend acceleration studies.
• Relative – Distance divided by Average True Range for volatility‑aware scaling.
That raw series is pushed through a look‑back normaliser that rescales every reading into a fixed −100 to +100 window. The normalisation window defaults to 100 bars but can be tightened for fast markets or expanded to capture long regimes.
4. Visual Layer
The oscillator line is gradient‑coloured from deep red through sky blue into bright green, so you can spot subtle momentum shifts with peripheral vision alone. There are four horizontal guide lines: Extreme Bear at −50, Bear Threshold at −20, Bull Threshold at +20 and Extreme Bull at +50. Soft fills above and below the thresholds reinforce the zones without cluttering the chart.
The smoothed Fib MA can be plotted directly on price for immediate trend context, and each of the five component averages can be revealed for educational or research purposes. Optional bar‑painting mirrors oscillator polarity, tinting candles green when momentum is bullish and red when momentum is bearish.
5. Divergence Detection
The script automatically looks for four classes of divergences between price pivots and oscillator pivots:
Regular Bullish, signalling a possible bottom when price prints a lower low but the oscillator prints a higher low.
Hidden Bullish, often a trend‑continuation cue when price makes a higher low while the oscillator slips to a lower low.
Regular Bearish, marking potential tops when price carves a higher high yet the oscillator steps down.
Hidden Bearish, hinting at ongoing downside when price posts a lower high while the oscillator pushes to a higher high.
Each event is tagged with an ℝ or ℍ label at the oscillator pivot, colour‑coded for clarity. Look‑back distances for left and right pivots are fully adjustable so you can fine‑tune sensitivity.
6. Alerts
Five ready‑to‑use alert conditions are included:
• Bullish when the oscillator crosses above +20.
• Bearish when it crosses below −20.
• Extreme Bullish when it pops above +50.
• Extreme Bearish when it dives below −50.
• Zero Cross for momentum inflection.
Attach any of these to TradingView notifications and stay updated without staring at charts.
7. Practical Applications
Swing trading trend filter – Plot the smoothed Fib MA on daily candles and only trade in its direction. Enter on oscillator retracements to the 0 line.
Intraday reversal scouting – On short‑term charts let Distance mode highlight overshoots beyond ±40, then fade those moves back to mean.
Volatility breakout timing – Use Relative mode during earnings season or crypto news cycles to spot momentum surges that adjust for changing ATR.
Divergence confirmation – Layer the oscillator beneath price structure to validate double bottoms, double tops and head‑and‑shoulders patterns.
8. Input Summary
• Source, Fibonacci multiplier, weighting method, smoothing length and type
• Oscillator calculation mode and normalisation look‑back
• Divergence look‑back settings and signal length
• Show or hide options for every visual element
• Full colour and line width customisation
9. Best Practices
Avoid using tiny multipliers on illiquid assets where the shortest Fibonacci window may drop under three bars. In strong trends reduce divergence sensitivity or you may see false counter‑trend flags. For portfolio scanning set oscillator to Momentum mode, hide thresholds and colour bars only, which turns the indicator into a heat‑map that quickly highlights leaders and laggards.
10. Final Notes
The Fibonacci Sequence Moving Average indicator seeks to fuse the mathematical elegance of the golden ratio with modern signal‑processing techniques. It is not a standalone trading system, rather a multi‑purpose information layer that shines when combined with market structure, volume analysis and disciplined risk management. Always test parameters on historical data, be mindful of slippage and remember that past performance is never a guarantee of future results. Trade wisely and enjoy the harmony of Fibonacci mathematics in your technical toolkit.

Weighted Multi-Mode Oscillator [BackQuant]Weighted Multi‑Mode Oscillator
1. What Is It?
The Weighted Multi‑Mode Oscillator (WMMO) is a next‑generation momentum tool that turns a dynamically‑weighted moving average into a 0‑100 bounded oscillator.
It lets you decide how each bar is weighted (by volume, volatility, momentum or a hybrid blend) and how the result is normalised (Percentile, Z‑Score or Min‑Max).
The outcome is a self‑adapting gauge that delivers crystal‑clear overbought / oversold zones, divergence clues and regime shifts on any market or timeframe.
2. How It Works
• Dynamic Weight Engine
▪ Volume – emphasises bars with exceptional participation.
▪ Volatility – inverse ATR weighting filters noisy spikes.
▪ Momentum – amplifies strong directional ROC bursts.
▪ Hybrid – equal‑weight blend of the three dimensions.
• Multi‑Mode Smoothing
Choose from 8 MA types (EMA, DEMA, HMA, LINREG, TEMA, RMA, SMA, WMA) plus a secondary smoothing factor to fine‑tune lag vs. responsiveness.
• Normalization Suite
▪ Percentile – rank vs. recent history (context aware).
▪ Z‑Score – standard deviations from mean (statistical extremes).
▪ Min‑Max – scale between rolling high/low (trend friendly).
3. Reading the Oscillator
Zone Default Level Interpretation
Bull > 80 Acceleration; momentum buyers in control
Neutral 20 – 80 Consolidation / no edge
Bear < 20 Exhaustion; sellers dominate
Gradient line/area automatically shades from bright green (strong bull) to deep red (strong bear).
Optional bar‑painting colours price bars the same way for rapid chart scanning.
4. Typical Use‑Cases
Trend Confirmation – Set Weight = Hybrid, Smoothing = EMA. Enter pullbacks only when WMMO > 50 and rising.
Mean Reversion – Weight = Volatility, reduce upper / lower bands to 70 / 30 and fade extremes.
Volume Pulse – Intraday futures: Weight = Volume to catch participation surges before breakout candles.
Divergence Spotting – Compare price highs/lows to WMMO peaks for early reversal clues.
5. Inputs & Styling
Calculation: Source, MA Length, MA Type, Smoothing
Weighting: Volume period & factor, Volatility length, Momentum period
Normalisation: Method, Look‑back, Upper / Lower thresholds
Display: Gradient fills, Threshold lines, Bar‑colouring toggle, Line width & colours
All thresholds, colours and fills are fully customisable inside the settings panel.
6. Built‑In Alerts
WMMO Long – oscillator crosses up through upper threshold.
WMMO Short – oscillator crosses down through lower threshold.
Attach them once and receive push / e‑mail notifications the moment momentum flips.
7. Best Practices
Percentile mode is self‑adaptive and works well across assets; Z‑Score excels in ranges; Min‑Max shines in persistent trends.
Very short MA lengths (< 10) may produce jitter; compensate with higher “Smoothing” or longer look‑backs.
Pair WMMO with structure‑based tools (S/R, trend lines) for higher‑probability trade confluence.
Disclaimer
This script is provided for educational purposes only. It is not financial advice. Always back‑test thoroughly and manage risk before trading live capital.

Custom Portfolio [BackQuant]Custom Portfolio {BackQuant]
Overview
This script turns TradingView into a lightweight portfolio optimizer with institutional-grade analytics and real-time position management capabilities.
Rank up to 15 tickers every bar using a pair-wise relative-strength "league table" that compares each asset against all others through your choice of 12 technical indicators.
Auto-allocate 100% of capital to the single strongest asset and optionally apply dynamic leverage when the aggregate market is trending, with full position tracking and rebalancing logic.
Track performance against a custom buy-and-hold benchmark while watching a fully fledged stats dashboard update in real time, including 15 professional risk metrics.
How it works
Relative-strength engine – Each asset is compared against every other asset with a user-selectable indicator (default: 9/21 EMA cross). The system generates a complete comparison matrix where Asset A vs Asset B, Asset A vs Asset C, and so on, creating strength scores. The summed scores crown a weekly/daily/hourly "winner" that receives the full allocation.
Regime filter – A second indicator applied to TOTAL crypto-market cap (or any symbol you choose) classifies the environment as trending or mean-reverting . Leverage activates only in trending regimes, protecting capital during choppy or declining markets. Choose from indicators like Universal Trend Model, Relative Strength Overlay, Momentum Velocity, or Custom RSI for regime detection.
Capital & position logic – Equity grows linearly when flat and multiplicatively while invested. The system tracks entry prices, calculates returns including leverage adjustments, and handles position transitions seamlessly. Optional intra-trade leverage rebalancing keeps exposure in sync with market conditions, recalculating position sizes as regime conditions change.
Risk & performance analytics – Every confirmed bar records return, drawdown, VaR/CVaR, Sharpe, Sortino, alpha/beta vs your benchmark, gain-to-pain, Calmar, win-rate, Omega ratio, portfolio variance, skewness, and annualized statistics. All metrics render in a professional table for instant inspection with proper annualization based on your selected trading days (252 for traditional markets, 365 for crypto).
Key inputs
Backtest window – Hard-code a start date or let the script run from series' inception with full date range validation.
Asset list (15 slots) – Works with spot, futures, indices, even synthetic spreads (e.g., BYBIT:BTCUSDT.P). The script automatically cleans ticker symbols for display.
Indicator universe – Switch the comparative metric to DEMA, BBPCT, LSMAz adaptive scores, Volatility WMA, DEMA ATR, Median Supertrend, and more proprietary indicators.
With more always being added!
Leverage settings – Max leverage from 1x to any multiple, auto-rebalancing toggle, trend/reversion thresholds with precision controls.
Visual toggles – Show/hide equity curve, rolling drawdown heat-map, daily PnL spikes, position label, advanced metrics table, buy-and-hold comparison equity.
Risk-free rate input – Customize the risk-free rate for accurate Sharpe ratio calculations, supporting both percentage and decimal inputs.
On-chart visuals
Color-coded equity curve with "shadow" offset for depth perception that changes from green (profitable) to red (losing) based on recent performance momentum.
Rolling drawdown strip that fades from light to deep red as losses widen, with customizable maximum drawdown scaling for visual clarity.
Optional daily-return histogram line and zero reference for understanding day-to-day volatility patterns.
Bottom-center table prints the current winning ticker in real time with clean formatting.
Top-right metrics grid updates every bar with 15 key performance indicators formatted to three decimal places for precision.
Benchmark overlay showing buy-and-hold performance of your selected index (default: SPX) for relative performance comparison.
Typical workflow
Add the indicator on a blank chart (overlay off).
Populate ticker slots with the assets you actually trade from your broker's symbol list.
Pick your momentum or mean-reversion metric and a regime filter that matches your market hypothesis.
Set max leverage (1 = spot only) and decide if you want dynamic rebalancing.
Press the little " L " on the price axis to view the equity curve in log scale for better long-term visualization.
Enable the metrics table to monitor Sharpe, Sortino, and drawdown in real time.
Iterate through different asset combinations and indicator settings; compare performance vs buy-and-hold; refine until you find robust parameters.
Who is it for?
Systematic crypto traders looking for a one-click, cross-sectional rotation model with professional risk management.
Portfolio quants who need rapid prototyping without leaving TradingView or exporting to Python/R.
Swing traders wanting an at-a-glance health check of their multi-coin basket with instant position signals.
Fund managers requiring detailed performance attribution and risk metrics for client reporting.
Researchers backtesting momentum and mean-reversion strategies across multiple assets simultaneously.
Important notes & tips
Set Trading Days in a Year to 252 for traditional markets; 365 for 24/7 crypto to ensure accurate annualization.
CAGR and Sharpe assume the backtest start date you choose—short windows can inflate stats, so test across multiple market cycles.
Leverage is theoretical; always confirm your broker's margin rules and account for funding costs not modeled here.
The script is computationally heavy at 15 assets due to the N×N comparison matrix—reduce the list or lengthen the timeframe if you hit execution limits.
Best results often come from mixing assets with different volatility profiles rather than highly correlated instruments.
The regime filter symbol can be changed from CRYPTOCAP:TOTAL to any broad market index that represents your asset universe.

Directional Market Efficiency [QuantAlgo]🟢 Overview
The Directional Market Efficiency indicator is an advanced trend analysis tool that measures how efficiently price moves in a given direction relative to the total price movement over a specified period. Unlike traditional momentum oscillators that only measure price change magnitude, this indicator combines efficiency measurement with directional bias to provide a comprehensive view of market behavior ranging from -1 (perfectly efficient downward movement) to +1 (perfectly efficient upward movement).
The indicator transforms the classic Efficiency Ratio concept by incorporating directional bias, creating a normalized oscillator that simultaneously reveals trend strength, direction, and market regime (trending vs. ranging). This dual-purpose functionality helps traders and investors identify high-probability trend continuation opportunities while filtering out choppy, inefficient price movements that often lead to false signals and whipsaws.
🟢 How It Works
The indicator employs a sophisticated two-step calculation process that first measures pure efficiency, then applies directional weighting to create the final signal. The efficiency calculation compares the absolute net price change over a lookback period to the sum of all individual bar-to-bar price movements during that same period. This ratio reveals how much of the total price movement contributed to actual progress in a specific direction.
The directional component applies the mathematical sign of the net price change (positive for upward movement, negative for downward movement) to the efficiency ratio, creating values between -1 and +1. The resulting Directional Efficiency is then smoothed using an Exponential Moving Average to reduce noise while maintaining responsiveness. Additionally, the system incorporates a configurable threshold level that distinguishes between trending markets (high efficiency) and ranging markets (low efficiency), enabling regime-based analysis and strategy adaptation.
🟢 How to Use
1. Signal Interpretation and Market Regime Analysis
Positive Territory (Above Zero): Indicates efficient upward price movement with bullish directional bias and favorable conditions for long positions
Negative Territory (Below Zero): Signals efficient downward price movement with bearish directional bias and favorable conditions for short positions
High Absolute Values (±0.4 to ±1.0): Represent highly efficient trending conditions with strong directional conviction and reduced noise
Low Absolute Values (±0.1 to ±0.3): Suggest ranging or consolidating markets with inefficient price movement and increased whipsaw risk
Zero Line Crosses: Mark critical directional shifts and provide primary entry/exit signals for trend-following strategies
2. Threshold-Based Market Regime Classification
Above Threshold (Trending Markets): When efficiency exceeds the threshold level, markets are classified as trending, favoring momentum strategies
Below Threshold (Ranging Markets): When efficiency falls below the threshold, markets are classified as ranging, favoring mean reversion approaches
3. Preset Configurations for Different Trading Styles
Default
Universally applicable configuration optimized for medium-term analysis across multiple timeframes and asset classes, providing balanced sensitivity and noise filtering.
Scalping
Highly responsive setup for ultra-short-term trades with increased sensitivity to quick efficiency changes. Best suited for 1-15 minute charts and rapid-fire trading approaches.
Swing Trading
Designed for multi-day position holding with enhanced noise filtering and focus on sustained efficiency trends. Optimal for 1-4 hour and daily timeframe analysis.
🟢 Pro Tips for Trading and Investing
→ Trend Continuation Filter: Enter long positions when Directional Efficiency crosses above zero in trending markets (above threshold) and short positions when crossing below zero, ensuring alignment with efficient price movement.
→ Range Trading Optimization: In ranging markets (below threshold), take profits on extreme readings and enter mean reversion trades when efficiency approaches zero from either direction.
→ Multi-Timeframe Confluence: Combine higher timeframe trend direction with lower timeframe efficiency signals for optimal entry timing.
→ Risk Management Enhancement: Reduce position sizes or avoid new entries when efficiency readings are weak (near zero), as these conditions indicate higher probability of choppy, unpredictable price movement.
→ Signal Strength Assessment: Prioritize trades with high absolute efficiency values (±0.4 or higher) as these represent the most reliable directional moves with reduced likelihood of immediate reversal.
→ Regime Transition Trading: Watch for efficiency threshold breaks combined with directional changes as these often mark significant trend initiation or termination points requiring strategic position adjustments.
→ Alert Integration: Utilize the built-in alert system for real time notifications of zero-line crosses, threshold breaks, and regime changes to maintain constant market awareness without continuous chart monitoring.

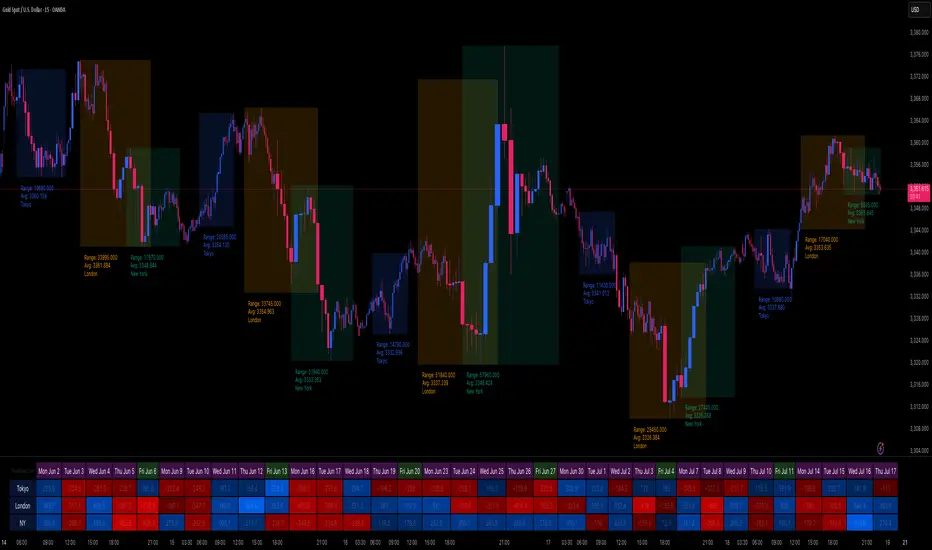
Session Volatility Dashboard█ Session Volatility Dashboard: HOW IT WORKS
This tool is built on transparent, statistically-grounded principles to ensure reliability and build user trust.
Session Logic: The script accurately identifies session periods based on user-defined start and end times in conjunction with the selected UTC offset. This ensures the session boxes and data are correctly aligned regardless of your local timezone or daylight saving changes.
Volatility Calculation: The core of the volatility engine is a comparison of current and historical price action. The script calculates a rolling Average True Range (ATR) over a user-defined lookback period (e.g., the last 20 sessions). It then compares the current session's ATR to this historical baseline to generate a simple percentage. For example, a reading of "135%" indicates the current session is 35% more volatile than the recent average, while "80%" indicates a contraction in volatility.
Dashboard Population : The script leverages TradingView's table object to construct the dashboard. This powerful feature allows the data to be displayed in a fixed position on the screen (e.g., top-right corner). Unlike plotted text, this table does not scroll with the chart's price history, ensuring that the most critical, up-to-date information is always available at a glance.
█ ACTIONABLE INTELLIGENCE: TRADING STRATEGIES & USE CASES
Translate data into action with these practical trading concepts.
Strategy 1: The Breakout Trade: Identify a session with low, coiling volatility (e.g., a Volatility reading below 75%)—often the Asian session. Mark the session high and low plotted by the indicator. These levels become prime targets for a potential breakout trade during the high-volume, high-volatility open of the subsequent London session.
Strategy 2 : The Mean Reversion (Fade) Trade: In a session with extremely high volatility (e.g., >150% of average), watch for price to rapidly extend to a new session high or low and then print a clear reversal candlestick pattern (like a pin bar or engulfing candle). This can signal momentum exhaustion and a high-probability opportunity to "fade" the move back toward the session midpoint.
Strategy 3 : The Trend Continuation: During a clear trending day, use the session midpoint as a dynamic area of value. Look for price to pull back to the midpoint during the London or New York session. If the session's Bias in the dashboard remains aligned with the higher-timeframe trend, this can present a quality entry to rejoin the established momentum.
█ COMPLETE CUSTOMIZATION: SETTINGS
Session Times: Independently set the start and end times for Asia, London, and New York sessions.
Timezone: Select your preferred UTC offset to align all sessions correctly.
Volatility Lookback: Define the number of past sessions to use for calculating the average volatility baseline (default is 20).
Dashboard Settings: Choose the on-screen position of the table, text size, and colors.
Visual Elements: Toggle on/off session background colors, high/low lines, and midpoint lines. Customize all colors.
Alerts: Enable/disable and customize alerts for session high/low breaks and volatility threshold crossings.
AnnualizedReturnCalculatorLibrary "AnnualizedReturnCalculator"
TODO: add library description here
calculateAnnualizedReturn(isStartTime, enableLog)
Parameters:
isStartTime (bool) : 开始时间的BOOL值变量(用于标记策略开始时间)
enableLog (bool) : 是否输出日志
Returns:
返回持仓基准年化收益率、资金基准年化收益率、总收益、平均资金占用

Max Drawdown (Asset-Based Lookback)Max Drawdown (Long-Term Trading)
🟦 Majors BTC, ETH, BNB, LTC 180 – 365
Captures full correction cycles and recovery patterns (6–12 months).
🟩 Altcoins SOL, ADA, DOT, LINK, AVAX 90 – 180
Alts move faster than majors; 3–6 months catches most large swings.
🟥 Meme coins DOGE, SHIB, PEPE, FLOKI 60 – 120
Volatile with quick trend reversals; 2–4 months captures parabolic runs + drawdowns.
📅 Chart Timeframe:
Use Daily (1D) timeframe for all these.
For extra macro insight, try Weekly (1W) with 52 bars (≈ 1 year).
Compare multiple assets using the same period to assess relative risk.
If you're building a long-term portfolio, combine this with:
200-day SMA or EMA for trend context.
Sharpe Ratio or Sortino Ratio if you're looking for risk-adjusted return metrics.

PCR tableOverview
This indicator displays a multi-period table of forward-looking price projections. It combines normalized directional momentum (Positive Change Ratio, PCR) with volatility (ATR) and presents a forecast for upcoming time intervals, adjusted for your local UTC offset.
Concepts & Calculations
Positive Change Ratio (PCR):
((total positive change)/(total change)-0.5)*2, producing a value between –100 and +100.
Synthetic ATR: Calculates average true range over the same lookbacks to capture volatility.
PCR × ATR: Forms a volatility-weighted directional forecast, indicating expected move magnitude.
Future Price Projection: Adds PCR × ATR value to current close to estimate future price at each lookahead interval.
Table Layout
There are 12 forecast horizons—1× to 12× the chart timeframe (e.g., minutes, hours, days). Each row displays:
1. Future Time: Timestamp of each projection (adjustable via UTC offset)
2. PCR: Directional bias per period (–1 to +1)
3. PCR × ATR: E xpected move magnitude
4. Future Price: Close + (PCR × ATR)
High and low PCR×ATR rows are highlighted green for minimum value in the price forecast (buy signal) or red for maximum value in the price forecast (sell signal).
How to Use
1. Set UTC offset to your time zone for accurate future timestamps.
2. View PCR to assess bullish (positive) or bearish (negative) momentum.
3. Use PCR × ATR to estimate move strength and direction.
4. Reference Future Price for potential levels over upcoming intervals, and for buy and sell signals.
Limitations & Disclaimers
* This model uses linear extrapolation based on recent price behavior. It does not guarantee future prices.
* It uses only current bar data and no lookahead logic—compliant with Pine Script rules.
* Designed for analytical insight, not as an automated signal or trade executor.
* Best used on standard bar/candle charts (avoid non-standard types like Heikin‑Ashi or Renko).

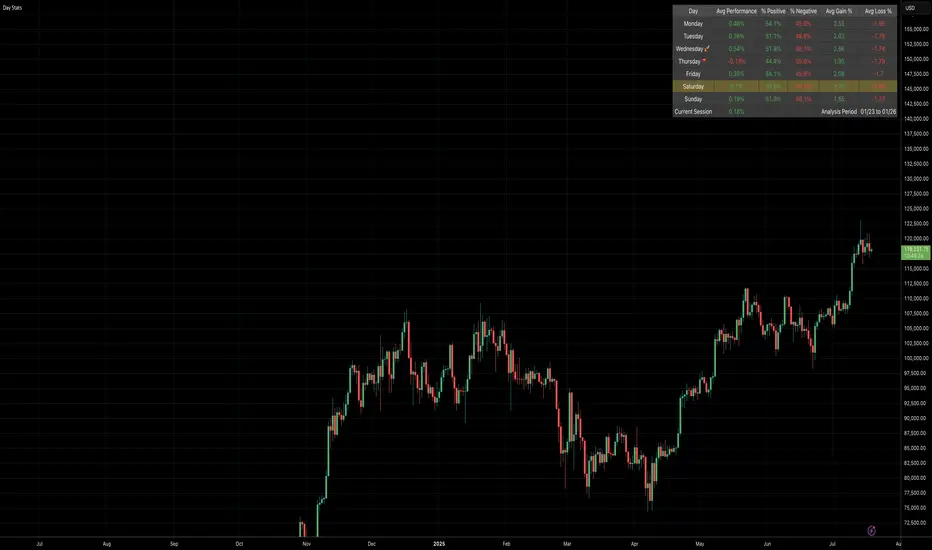
Daily Gain/Loss Statistics by Day of WeekDaily Gain/Loss Statistics by Day of Week
Overview
This Pine Script indicator analyzes historical price data to provide comprehensive day-of-week performance statistics, helping traders identify patterns and optimize their trading strategies based on which days historically perform better or worse.
Key Features
📊 Day-of-Week Analysis
7-day breakdown showing Monday through Sunday statistics
Average Gain % - Average percentage gains on winning days for each day of the week
Average Loss % - Average percentage losses on losing days (displayed with minus sign)
Median High % - Typical percentage move from open to daily high
Median Low % - Typical percentage move from open to daily low
🎯 Visual Performance Indicators
🚀 Rocket symbol - Marks the best performing day (highest average gains)
🔻 Red triangle down - Marks the worst performing day (lowest average gains)
Current day highlighting - Today's row highlighted in yellow (#ffdd444b)
⚡ Real-Time Session Tracking
Current Session row - Shows today's performance percentage in real-time
Color-coded gains/losses - Green for positive, red for negative
🎨 Professional Themes
⚙️ Customization Options
Date range selection - Choose specific time periods for analysis
Table positioning - 9 different screen positions
Table sizing - 6 size options from tiny to huge
Timeframe protection - Works only on 1D timeframe with user-friendly warnings
How It Works
Data Collection - Analyzes daily OHLC data within your selected date range
Day Classification - Categorizes each trading day by day of the week
Statistical Calculation - Computes averages and medians for each day type
Performance Ranking - Identifies best and worst performing days
Real-Time Display - Shows current session performance vs historical patterns
Trading Applications
Entry/Exit Timing - Identify optimal days for opening/closing positions
Risk Management - Avoid trading on historically poor-performing days
Strategy Optimization - Align trading strategies with day-of-week patterns
Market Timing - Understand weekly market cycles and seasonality
This indicator transforms raw price data into actionable intelligence, helping traders make more informed decisions based on proven historical day-of-week performance patterns.
8 AM & 9 AM NY Candle HighlighterThis indicator helps me to know when the 9am NY candle has closed above or below the previous candle.

DOGE 15MIN**Warm Reminder:** This strategy is intended solely for exploratory research and experimentation to evaluate the effectiveness of various signals. Drawing inspiration from patterns observed on the DOGE cryptocurrency 15-minute chart, it provides a tailored framework to identify potential trading opportunities. For optimal results, it is currently recommended exclusively for DOGE 15min charts. Remember, trading involves inherent risks, and past performance is not indicative of future results. We are dedicated to ongoing optimizations and refinements to enhance its robustness across broader applications—stay tuned for updates!
#### **A. Long Entry Signals**
These conditions trigger a long position entry, provided the strategy has no existing position (position_size == 0) and is not blocked. Signals can be enabled/disabled via input toggles (e.g., enable_vix).
- **VIX Reversal (vix_long)**: VIX signal shifts from high to low volatility (non-high volatility), with RSI between 30-50.
- **RSI Oversold (rsi_long)**: RSI crosses above 30.
- **CVD Bullish (cvd_long)**: CVD is rising.
- **Price RSI Bullish (prsi_long)**: Price RSI crosses above 30 or a long signal is triggered.
- **RangeEMA Bullish (rema_long)**: Candlestick is above POC, with KAMA trend flipping upward.
- **ZVWAP Oversold (zvwap_long)**: ZVWAP enters the oversold zone.
- **KAMA + Volume Bullish (kama_long)**: KAMA trend flips upward, candlestick is above POC, volume is rising, and the candle is bullish (green).
- **Volume Burst Bullish (vol_burst_long)**: Volume RSI crosses below threshold (default 70), open > close (bearish/red candle), triggered within the last two candles. **Special: Ignores all blocks** (bypasses not_long, Pivot, OI, RSI/ADX extreme filters).
#### **B. Short Entry Signals**
Similar to long entries: requires no existing position and no blocks.
- **RSI Overbought (rsi_short)**: RSI crosses below 70.
- **CVD Bearish (cvd_short)**: CVD is declining.
- **Price RSI Bearish (prsi_short)**: Price RSI crosses below 70 or a short signal is triggered.
- **RangeEMA Bearish (rema_short)**: Candlestick is below POC, with KAMA trend flipping downward.
- **ZVWAP Overbought (zvwap_short)**: ZVWAP enters the overbought zone.
- **KAMA + Volume Bearish (kama_short)**: KAMA trend flips downward, candlestick is below POC, volume is declining, and the candle is bearish (red).
- **Chop Bearish (chop_short)**: Chop crosses below 38.2, with RSI > 50.
- **Volume Burst Bearish (vol_burst_short)**: Volume RSI crosses below threshold (default 70), RSI > 70, and close > open (bullish/green candle), triggered within the last two candles. **Special: Ignores all blocks** (bypasses not_short, Pivot, OI, RSI/ADX extreme filters).
#### **C. Long Entry Blocks/Filters**
These conditions block long entries unless the signal ignores blocks (e.g., Volume Burst).
- **Base Prohibition (not_long)**: Volume is declining, or ADX is bearish (di_bear), or VIX is in high volatility (vix_flag), or RSI < 30.
- **Pivot Filter**: Recent Pivot is in a disadvantaged position.
- **OI Filter**: OI is declining.
- **RSI/ADX Extreme Filter**: RSI > 70 or ADX is bullish (di_bull).
- **Other**: Strategy already has a position (position_size != 0), or extreme volatility (is_extreme, though disabled in code).
#### **D. Short Entry Blocks/Filters**
Similar to long blocks.
- **Base Prohibition (not_short)**: Volume is rising, or (Chop < 38.2 and RSI > 50), or ADX is bullish (di_bull), or RSI > 70.
- **Pivot Filter**: Recent Pivot is in a disadvantaged position.
- **OI Filter**: OI is rising.
- **RSI/ADX Extreme Filter**: RSI < 30 or ADX is bearish (di_bear).
- **Other**: Existing position, or extreme volatility.
#### **E. Long Exit Signals**
Triggers closing of long positions, based on states (e.g., super_long, weak_long, only_kama).
- **KAMA Bearish Flip (exist_long)**: KAMA trend flips downward, or KAMA is downward with a short signal.
- **VIX Signal**: VIX shifts from low to high volatility, with RSI < 50.
- **Reversal Signal**: Short signal present and KAMA is downward.
- **Weak Trend Stop-Loss (weak_stop_long)**: In weak_long state, candlestick near POC, and close crosses below POC.
- **Weak KAMA Stop-Loss (weak_kama_long)**: In weak_long state, candlestick far from POC, and KAMA trend reverses.
- **Global Exit (exist_all)**: Volume RSI crosses below threshold (vol_under), or KAMA exit (kama_exit_long), or weak stop-loss, etc.
- **Special**: If in strong_long_hold (only_kama and KAMA remains bullish), ignore certain exit signals to hold the position.
#### **F. Short Exit Signals**
Similar to long exits.
- **KAMA Bullish Flip (exist_short)**: KAMA trend flips upward, or KAMA is upward with a long signal.
- **Reversal Signal**: Long signal present and KAMA is upward.
- **Weak Trend Stop-Loss (weak_stop_short)**: In weak_short state, candlestick near POC, and close crosses above short_state.current_max.
- **Weak KAMA Stop-Loss (weak_kama_short)**: In weak_short state, candlestick far from POC, and KAMA flips upward.
- **Global Exit (exist_all)**: Same as above.

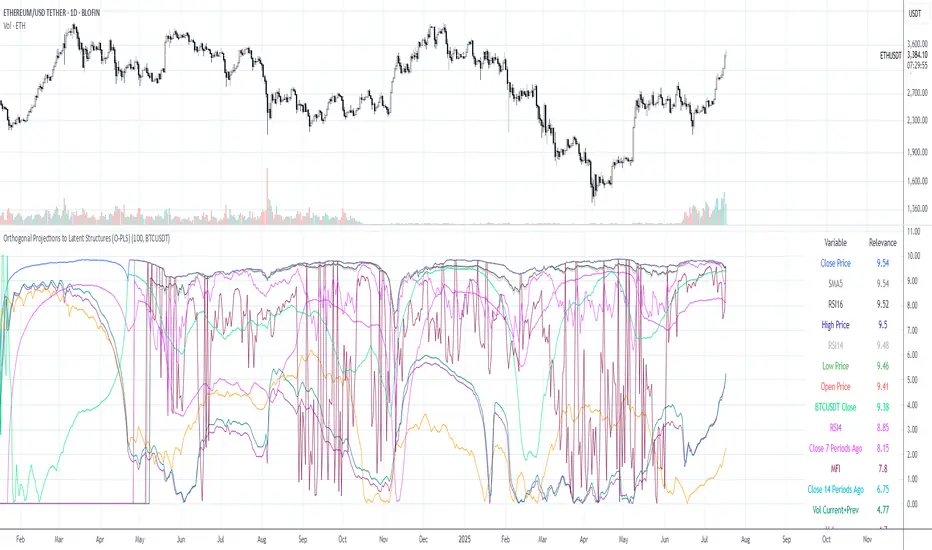
Orthogonal Projections to Latent Structures (O-PLS)Version 0.1
Orthogonal Projections to Latent Structures (O-PLS) Indicator for TradingView
This indicator, named "Orthogonal Projections to Latent Structures (O-PLS)", is designed to help traders understand the relevance or predictive power of various market variables on the future close price of the asset it's applied to. Unlike standard correlation coefficients that show a simple linear relationship, O-PLS aims to separate variables into "predictive" (relevant to Y) and "orthogonal" (irrelevant noise) components. This Pine Script indicator provides a simplified proxy of the relevance score derived from O-PLS principles.
Purpose of the Indicator
The primary purpose of this indicator is to identify which technical factors (such as price, volume, and other indicators) have the strongest relationship with the future price movement of the current trading instrument. By providing a "relevance score" for each input variable, it helps traders focus on the most influential data points, potentially leading to more informed trading decisions.
Inputs
The indicator offers the following user-definable inputs:
* **Lookback Period:** This integer input (default: 100, min: 10, max: 500) determines the number of past bars used to calculate the relevance scores for each variable. A longer lookback period considers more historical data, which can lead to smoother, less reactive scores but might miss recent shifts in variable importance.
* **External Asset Symbol:** This symbol input (default: `BINANCE:BTCUSDT`) allows you to specify an external asset (e.g., `BINANCE:ETHUSDT`, `NASDAQ:TSLA`) whose close price will be included in the analysis as an additional variable. This is useful for cross-market analysis to see how other assets influence the current chart.
* **Plot Visibility Checkboxes (e.g., "Plot: Open Price Relevance", "Plot: Volume Relevance", etc.):** These boolean checkboxes allow you to toggle the visibility of individual relevance score plots on the chart, helping to declutter the display and focus on specific variables.
Outputs
The indicator provides two main types of output:
Relevance Score Plots: These are lines plotted in a separate pane below the main price chart. Each line corresponds to a specific market variable (Open Price, Close Price, High Price, Low Price, Volume, various RSIs, SMAs, MFI, and the External Asset Close). The value of each line represents the calculated "relevance score" for that variable, typically scaled between 0 and 10. A higher score indicates a stronger predictive relationship with the future close price.
Sorted Relevance Table : A table displayed in the top-right corner of the chart provides a clear, sorted list of all analyzed variables and their corresponding relevance scores. The table is sorted in descending order of relevance, making it easy to identify the most influential factors at a glance. Each variable name in the table is colored according to its plot color, and the external asset's name is dynamically displayed without the "BINANCE:" prefix.
How to Use the Indicator
1. **Add to Chart:** Apply the "Orthogonal Projections to Latent Structures (O-PLS)" indicator to your desired trading chart (e.g., ETH/USDT).
2. **Adjust Inputs:**
* **Lookback Period:** Experiment with different lookback periods to see how the relevance scores change. A shorter period might highlight recent correlations, while a longer one might show more fundamental relationships.
* **External Asset Symbol:** If you trade BTC/USDT, you might add ETH/USDT or SPX as an external asset to see its influence.
3. **Analyze Relevance Scores:**
* **Plots:** Observe the individual relevance score plots over time. Are certain variables consistently high? Do scores change before significant price moves?
* **Table:** Refer to the sorted table on the latest confirmed bar to quickly identify the top-ranked variables.
4. **Incorporate into Strategy:** Use the insights from the relevance scores to:
* Prioritize certain indicators or price actions in your trading strategy. For example, if "Volume" has a high relevance score, it suggests volume confirmation is critical for future price moves.
* Understand the influence of inter-market relationships (via the External Asset Close).
How the Indicator Works
The indicator works by performing the following steps on each bar:
1. **Data Fetching:** It gathers historical data for various price components (open, high, low, close), volume, and calculated technical indicators (SMA, RSI, MFI) for the specified `lookback` period. It also fetches the close price of an `External Asset Symbol` .
2. **Standardization (Z-scoring):** All collected raw data series are standardized by converting them into Z-scores. This involves subtracting the mean of each series and dividing by its standard deviation . Standardization is crucial because it brings all variables to a common scale, preventing variables with larger absolute values from disproportionately influencing the correlation calculations.
3. **Correlation Calculation (Proxy for O-PLS Relevance):** The indicator then calculates a simplified form of correlation between each standardized input variable and the standardized future close price (Y variable) . This correlation is a proxy for the relevance that O-PLS would identify. A high absolute correlation indicates a strong linear relationship.
4. **Relevance Scaling:** The calculated correlation values are then scaled to a range of 0 to 10 to provide an easily interpretable "relevance score" .
5. **Output Display:** The relevance scores are presented both as time-series plots (allowing observation of changes over time) and in a real-time sorted table (for quick identification of top factors on the current bar) .
How it Differs from Full O-PLS
This indicator provides a *simplified proxy* of O-PLS principles rather than a full, mathematically rigorous O-PLS model. Here's why and how it differs:
* **Dimensionality Reduction:** A full O-PLS model would involve complex matrix factorization techniques to decompose the independent variables (X) into components that are predictive of Y and components that are orthogonal (unrelated) to Y but still describe X's variance. Pine Script's array capabilities and computational limits make direct implementation of these matrix operations challenging.
* **Orthogonal Components:** A true O-PLS model explicitly identifies and removes orthogonal components (noise) from the X data that are unrelated to Y. This indicator, in its simplified form, primarily focuses on the direct correlation (relevance) between each X variable and Y after standardization, without explicitly modeling and separating these orthogonal variations.
* **Predictive Model:** A full O-PLS model is ultimately a predictive model that can be used for regression (predicting Y). This indicator, however, focuses solely on **identifying the relevance/correlation of inputs to Y**, rather than building a predictive model for Y itself. It's more of an analytical tool for feature importance than a direct prediction engine.
* **Computational Intensity:** Full O-PLS involves Singular Value Decomposition (SVD) or Partial Least Squares (PLS) algorithms, which are computationally intensive. The indicator uses simpler statistical measures (mean, standard deviation, and direct correlation calculation over a lookback window) that are feasible within Pine Script's execution limits.
In essence, this Pine Script indicator serves as a practical tool for gaining insights into variable relevance, inspired by the spirit of O-PLS, but adapted for the constraints and common use cases of a TradingView environment.