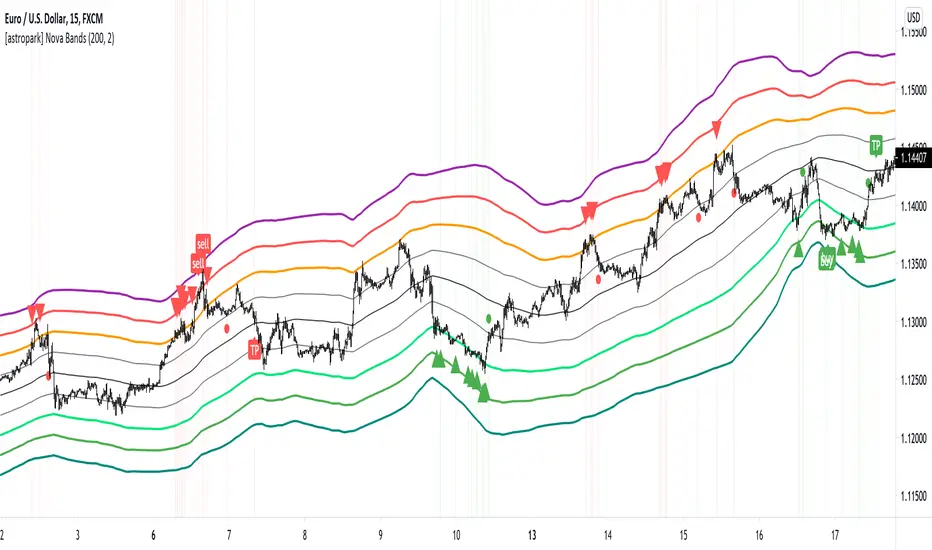
[astropark] Nova BandsDear followers,
today a new analysis and scalping tool for day trading on low timeframes (5-15 minutes) or to plan swing trades on hourly timeframes. It can be used also on high timeframes just for analysis current market trend.
The indicator plots a series of levels which create a nice bands flow.
The slope of levels make you easily understand when price is in consolidation, in uptrend or in downtrend.
The golden rule is always the same: buy low and sell high .
This indicator plots:
3 "price is low here" levels (from dark green to light green)
3 "price is average here" levels
3 "price is high here" levels (from purple to orange)
When bands are flat, price is in consolidation and this is best condition to trade with nova bands.
When price reaches higher bands, you will open a short position with targets below levels, fully closing your position when price hits the average level (black).
Here an example on Bitcoin on 15m using 1h resolution:
The same applies when price reaches lower bands, you will open a long position with targets above levels, fully closing your position when price hits the average level (black).
When bands get nearer and nearer is called "Bands Squeeze": price is next to a main breakout move, volatility is coming!
Here an example of SPX500: after long consolidation and bands getting nearer and neared, we had the breakout, downwards in this case.
In this screenshot you can see what signals algorithm provided:
Our suggestion is to play safe these kind of scenarios, no reason to FOMO buy/sell. Just wait for price consolidation / getting back inside the bands.
For example you would have skip first three buy signals, while you would have longed the last two as price came back inside bands after the big volatility which made price went below bands.
Another example is TSLA stock on 15m with 1h resolution:
Price touched the first bullish level and made a big move upwards, breaking bands with a +90% move.
In this case, you would have skipper first 2 sell signals, while you would have accepted next two with stoploss above recent high.
Acceptable also the other two sell signals, which you may have closed when price retraced to lower levels:
You can of course run trends like this buying on price hitting bullish/lower levels after a long consolidation and sell on price hitting middle and higher levels:
A trader who wants to be a winner must understand that money and risk management are very important, so manage your position size and always have a stop loss in your trades.
Here some examples how the indicator works on different markets:
EURUSD 15m with standard settings and 1h resolution
GOLD (XAUUSD) 15m with standard settings and 1h resolution
Facebook (FB) 15m with standard settings and 1h resolution
This is a premium indicator , so send me a private message in order to get access to this script.
Cổ phiếu
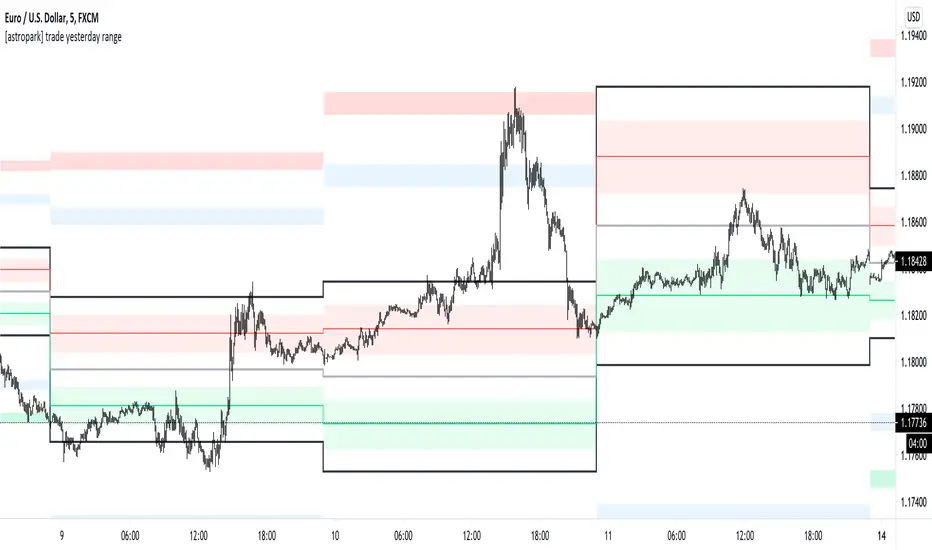
[astropark] trade yesterday rangeDear followers,
today a nice scalping tool for day trading on low time frames (1-3-5 minutes)!
Each day the indicator will print some important levels and ranges related to the trading day before:
yesterday high (black line)
yesterday day range averange (silver line)
yesterday low (black line)
average between yesterday high and yesterday average, together with a resistance range (red)
average between yesterday low and yesterday average, together with a support range (green)
two extension ranges above yesterday high (first is blue, second is red)
two extension ranges below yesterday low (first is blue, second is green)
Trading levels is one of most effective trading tecniques:
once a level is broken upwards, you can long (buy) the bullish retest with stoploss below recent low
once a level is broken downwards, you can short (sell) the bearish retest with stoploss below recent high
consolidation below or at a resistance level is bullish, so long (buy) breakout upwards and long more on a bullish retest of broken level
consolidation above or at a support level is bearish, so short (sell) breakout downwards and short more on a bearish retest of broken level
many times you see a level to be tested 2 or 3 times: short (sell) double and triple top, long (buy) double or triple bottom
Here you can see the levels described above and basic usage in a consolidation trading day:
A trader who wants to be a winner must understand that money and risk management are very important, so manage your position size and always have a stop loss in your trades.
Here you can see many examples on how to use this indicator.
Triple top on yesterday range high: perfect short setup (5 take profits targets in the example)
Resistance levels broken: long setup on bullish retest (2 take profits targets in the example)
Double top and support broken: 2 short setups (2 and 3 take profits targets in the example)
Here some examples how to basically use the indicator in a consolidation trading day: short (sell) resistance levels, long (buy) support levels
This is a premium indicator , so send me a private message in order to get access to this script.
cosmic scalperCosmic Scalper is an intuitive & exotic trading engine, designed to Identify Trend, visually highlight our “Zone of Interest” & plot entry lines at its base, like a barcode, providing critical information to the trader’s mind in a clean, elegant way without cluttering the chart.
Components Of Script :
1. Trend Support Cloud : Based on Fibonacci ratio, the cloud has 3 layers or bands.
2. Entry Engine : The last band of the cloud gets highlighted when we enter “Zone of Interest” & vertical lines appear indicating possible entry points. Together this forms a trend fingerprint.
Mechanism Of Action :
1. Identify trend : The script observers multiple parameters on higher timeframes to identify trend & plots the fibonacci based 3 layer trend support cloud. The script will indicate a change of trend when the last band is breached & sustained.
2. Zone Of Interest : Once a trend is identified, we are looking for entries. But we wait for the other side to get exhausted first. When exhaustion is identified, the last band of the cloud gets highlighted. This “exhaustion” is measured using bespoke datasets created within the protocol. Conventional datasets like RSI, VWAP, MACD etc are only used as secondary or tertiary layer of information.
3. Entries : Once we have entered the highlighted ‘Zone of Interest’ the script will offer entry points represented by vertical lines in the last band, this Highlight + Vertical Lines together forms the trend fingerprint, giving traders crucial visual information to make informed decisions.
How to use :
1. Make a Higher Timeframe Analysis, 4hr, 6hr or Daily timeframe. Use TA or Bollinger Bands.
2. Once you have an informed bias, switch to the Cosmic Scalper on 1min timeframe to take position.
3. Target, Stop, Leverage : at user discretion
Have Questions? Feel free to PM me on TradingView

ETF / Stocks / Crypto - DCA Strategy v1Simple "benchmark" strategy for ETFs, Stocks and Crypto! Super-easy to implement for beginners, a DCA (dollar-cost-averaging) strategy means that you buy a fixed amount of an ETF / Stock / Crypto every several months. For instance, to DCA the S&P 500 (SPY), you could purchase $10,000 USD every 12 months, irrespective of the market price. Assuming the macro-economic conditions of the underlying country remain favourable, DCA strategies will result in capital gains over a period of many years, e.g. 10 years. DCA is the safest strategy that beginners can employ to make money in the markets, and all other types of strategies should be "benchmarked" against DCA; if your strategy cannot outperform DCA, then your strategy is useless.
Recommended Chart Settings:
Asset Class: ETF / Stocks / Crypto
Time Frame: H1 (Hourly) / D1 (Daily) / W1 (Weekly) / M1 (Monthly)
Necessary ETF Macro Conditions:
1. Country must have healthy demographics, good ratio of young > old
2. Country population must be increasing
3. Country must be experiencing price-inflation
Necessary Stock Conditions:
1. Growing revenue
2. Growing net income
3. Consistent net margins
4. Higher gross/net profit margin compared to its peers in the industry
5. Growing share holders equity
6. Current ratios > 1
7. Debt to equity ratio (compare to peers)
8. Debt servicing ratio < 30%
9. Wide economic moat
10. Products and services used daily, and will stay relevant for at least 1 decade
Necessary Crypto Conditions:
1. Honest founders
2. Competent technical co-founders
3. Fair or non-existent pre-mine
4. Solid marketing and PR
5. Legitimate use-cases / adoption
Default Robot Settings:
Contribution (USD): $10,000
Frequency (Months): 12
*Robot buys $10,000 worth of ETF, Stock, Crypto, regardless of the market price, every 12 months since its founding time.*
*Equity curve can be seen from the bottom panel*
Risk Warning:
This strategy is low-risk, however it assumes you have a long time horizon of at least 5 to 10 years. The longer your holding-period, the better your returns. The only thing the user has to keep-in-mind are the macro-economic conditions as stated above. If unsure, please stick to ETFs rather than buying individual stocks or cryptocurrencies.

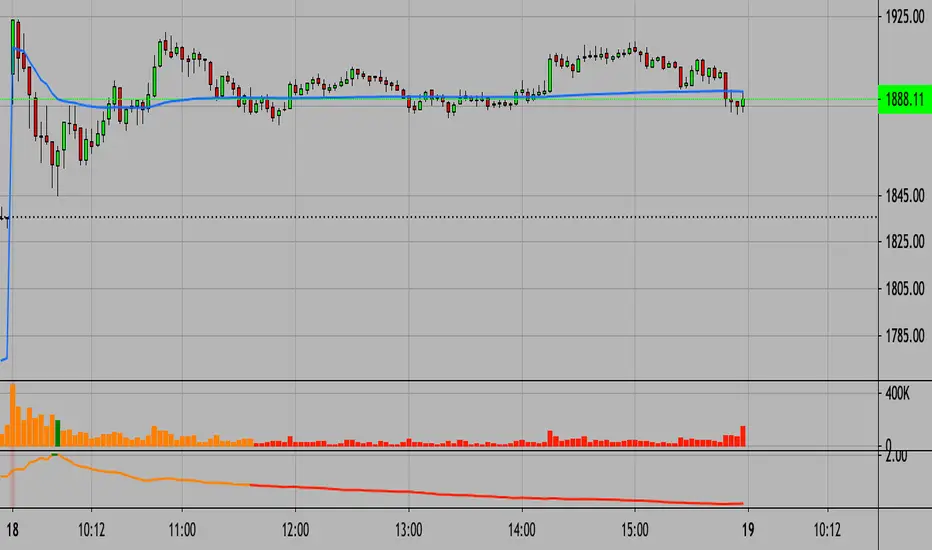
Real Relative Volume - Bar Indicator - Time Adjusted - DE & ENEnglish version below
Die richtige Aktie zu finden, ist nich immer einfach. Eine wichtige Variable bei der Aktienauswahl stellt das relative Volumen dar, welches von vielen erfolgreichen Tradern und Trading Firmen benutzt wird. Stell es Dir so vor: Statt sich das absolute Volumen anzuschauen, schauen wir uns die tatsächliche Stärke an. Wie viel Volumen wird also heute im Vergleich zu einem regulären Tag gehandelt. Dies gibt Aufschluss darüber, ob die Aktie "In-Play" ist.
Merke: Ist das RVOL (Relative Volumen) erhöht, sind mehr Marktteilnehmer an dieser Aktie interessiert als üblich. Dies ist besonders dann wichtig, wenn die Marktrichtung und die Richtung der Aktie nicht übereinstimmen.
Wenn der Markt steigt, steigen auch die meisten Aktien. Dies kann folglich auch ohne erhöhtes RVOL passieren. Was ist aber, wenn der Markt gegen uns geht? Dann werden wir schnell bei RVOL-schwachen Aktien ausgeschüttelt. Daher wollen wir unseren Fokus immer auf Aktien setzen, die ein erhöhtes relatives Volumen haben! Dies sind die Aktien, die gerade wirklich stark gehandelt werden und wahrscheinlich einen Katalysten dafür haben.
Der Real Relative Volume - Bar Indicator zeigt Dir das aktuelle relative Volumen an. Unser Algo benutzt dabei das tatsächliche kumulative Volumen des aktuellen Tages zum jeweiligen (aktuellen) Zeitpunkt und vergleicht dieses mit dem historischen Durchschnittsvolumen zum gleichen Zeitpunkt. Damit bekommen wir ein korrektes Abbild der aktuellen Stärke. Mit Hilfe des Indikators können wir durch die farbliche Veränderung der Volumenbalken ebenfalls sehen, ob diese Stärke zunimmt, gleich bleibt, oder gegebenenfalls schnell and Power verliert. Im Gegensatz zu anderen Skripten nutzen wir eine fortschrittliche Methode, die aktuelle Position am Tag erkennt und damit nicht die Session in gleiche Teile teilt. Vorteil: Der Indikator funktioniert auch in Krypto, Forex, DE-Aktien, Indizes etc.
Funktionen:
Bitte ohne verlängerte Handelszeiten nutzen!
Sessions Back: Verändert die Baseline, die Du mit dem heutigen Volumen vergleichst. Beispiel: 10 - Zur aktuellen Uhrzeit siehst Du das reale relative Volumen von heute in Relation zu den letzten 10 Sessions (zur gleichen Zeit). (*max 5000 Kerzen)
RVOL Threshold: Wert für die RVOL Alarme sowie zur Färbung bei Nutzung des Modus Threshold.
Plot styles: Du hast die Möglichkeit aus 4 verschiedenen Styles zu wählen.
Heatmap (greift auf die Werte und Farben von HM1-HM5 zurück)
Traffic (greift auf die Werte und Farben von T1-T4 zurück) -
Threshold (greift auf den Werte RVOL Threshold zurück)
Kurs (zeigt die normalen Volumenbalken)
HM1-5: Stelle unterschiedliche RVOL Werte für den Plot Style Heatmap ein.
T1-4: Stelle unterschiedliche RVOL Werte für den Plot Style Traffic ein.
Dieser Indikator wird häufig mit unserer zweiten Version Real Relative Volume - Line Indicator - Time Adjusted - DE & EN verwendet. Stelle sicher, dass Du in beiden Indikatoren die gleichen RVOL Werte nutzt!
-------------
English version
Finding the right stock to trade is not always easy. An important variable in stock selection is the relative volume, which is used by many successful traders and trading firms. Think of it like this: Instead of looking at absolute volume, we look at actual strength. So how much volume is traded today compared to a regular day? This gives an indication of whether the stock is "in play".
Note: If the RVOL (relative volume) is increased, more market participants are interested in this share than usual. This is especially important if the market direction and the direction of the stock do not match.
If the market rises, most shares will also rise. This can, therefore, happen without an increased RVOL. But what happens if the market goes against us? Then we are quickly shaken out of RVOL-weak stocks. Therefore, we always want to focus on stocks that have an increased relative volume! These are the stocks that are trading really strongly right now and probably have a catalyst for that.
The Real Relative Volume - Bar Indicator shows you the current relative volume. Our Algo uses the actual cumulative volume of the current day at the respective (current) time and compares it with the historical average volume at the same time. This gives us a correct picture of the current strength. With the help of the indicator, we can also see by the color change of the volume bars whether this strength increases, remains the same, or loses power quickly. Unlike other scripts, we use an advanced method that recognizes the current position on the day and does not split the session into equal parts. Advantage: The indicator also works in crypto, forex, foreign stock markets, indices, etc.
Features:
Please use without extended trading hours!
Sessions Back: Changes the baseline that you compare to today's volume. Example: 10 - At the current time you see the real relative volume of today in relation to the last 10 sessions (at the same time). (*max 5000 candles)
RVOL Threshold: Value for the RVOL alarms as well as for coloring when using the Threshold mode.
Plot styles: You have the possibility to choose from 4 different styles.
Heatmap (uses the values and colors of HM1-HM5)
Traffic (uses the values and colors of T1-T4) -
Threshold (accesses the values RVOL Threshold)
Price (shows the normal volume bars)
HM1-5: Set different RVOL values for the Plot Style Heatmap
T1-4: Set different RVOL values for the Plot Style Traffic.
This indicator is often used with our second version Real Relative Volume - Line Indicator - Time Adjusted - DE & EN. Make sure that you use the same RVOL values in both indicators!

Real Relative Volume - Line Indicator - Time Adjusted - DE & EN// English description below
Die richtige Aktie zu finden, ist nich immer einfach. Eine wichtige Variable bei der Aktienauswahl stellt das relative Volumen dar, welches von vielen erfolgreichen Tradern und Trading Firmen benutzt wird. Stell es Dir so vor: Statt sich das absolute Volumen anzuschauen, schauen wir uns die tatsächliche Stärke an. Wie viel Volumen wird also heute im Vergleich zu einem regulären Tag gehandelt. Dies gibt Aufschluss darüber, ob die Aktie "In-Play" ist.
Merke: Ist das RVOL (Relative Volumen) erhöht, sind mehr Marktteilnehmer an dieser Aktie interessiert als üblich. Dies ist besonders dann wichtig, wenn die Marktrichtung und die Richtung der Aktie nicht übereinstimmen.
Wenn der Markt steigt, steigen auch die meisten Aktien. Dies kann folglich auch ohne erhöhtes RVOL passieren. Was ist aber, wenn der Markt gegen uns geht? Dann werden wir schnell bei RVOL-schwachen Aktien ausgeschüttelt. Daher wollen wir unseren Fokus immer auf Aktien setzen, die ein erhöhtes relatives Volumen haben! Dies sind die Aktien, die gerade wirklich stark gehandelt werden und wahrscheinlich einen Katalysten dafür haben.
Der Real Relative Volume - Line Indicator zeigt Dir das aktuelle relative Volumen an. Unser Algo benutzt dabei das tatsächliche kumulative Volumen des aktuellen Tages zum jeweiligen (aktuellen) Zeitpunkt und vergleicht dieses mit dem historischen Durchschnittsvolumen zum gleichen Zeitpunkt . Damit bekommen wir ein korrektes Abbild der aktuellen Stärke. Mit Hilfe des Indikators können wir ebenfalls sehen, ob diese Stärke zunimmt, gleich bleibt, oder gegebenenfalls schnell and Power verliert. Im Gegensatz zu anderen Skripten nutzen wir eine fortschrittliche Methode, die aktuelle Position am Tag erkennt und damit nicht die Session in gleiche Teile teilt. Vorteil: Der Indikator funktioniert auch in Krypto, Forex, DE-Aktien, Indizes etc.
Funktionen:
Bitte ohne verlängerte Handelszeiten nutzen!
Sessions Back: Verändert die Baseline, die Du mit dem heutigen Volumen vergleichst. Beispiel: 10 - Zur aktuellen Uhrzeit siehst Du das reale relative Volumen von heute in Relation zu den letzten 10 Sessions (zur gleichen Zeit). (*max 5000 Kerzen)
Threshold: Stelle eine bestimmte Schwelle ein, bei der Du dich über die TradingView Funktion alarmieren lassen möchtest.
T1-4: Stelle unterschiedliche RVOL Werte ein.
Use Traffic Color for Line: Die unterschiedlichen T1-4 Werte und Farben werden für das Liniendiagramm genutzt.
Dieser Indikator wird häufig mit unserer zweiten Version Real Relative Volume - Bar Indicator - Time Adjusted - DE & EN verwendet.
/////// English version
Finding the right stock is not always easy. An important variable in stock selection is the relative volume, which is used by many successful traders and trading firms. Think of it like this: Instead of looking at absolute volume, we look at actual strength. So how much volume is traded today compared to a regular day? This gives an indication of whether the stock is "in play".
Note: If the RVOL (relative volume) is increased, more market participants are interested in this stock than usual. This is especially important if the market direction and the direction of the stock do not match.
If the market rises, most shares will also rise. This can, therefore, happen without an increased RVOL. But what happens if the market goes against us? Then we are quickly shaken out of RVOL-weak stocks. Therefore, we always want to focus on stocks that have an increased relative volume! These are the stocks that are trading really strongly right now and probably have a catalyst for that.
The Real Relative Volume - Line Indicator shows you the current relative volume. Our Algo uses the actual cumulative volume of the current day at the respective (current) time and compares it with the historical average volume at the same time . This gives us a correct picture of the current strength. With the help of the indicator, we can also see whether this strength increases, remains the same, or if it loses power quickly. Unlike other scripts, we use an advanced method that recognizes the current position on the day and thus does not split the session into equal parts. Advantage: The indicator also works in crypto, forex, foreign stock markets, indices, and many more.
Functions:
Please use without extended trading hours!
Sessions Back: Changes the baseline that you compare to today's volume. Example: 10 - At the current time you see the real relative volume of today in relation to the last 10 sessions (at the same time). (*max 5000 Bars)
Threshold: Set a certain threshold at which you want to be alerted via the TradingView function.
T1-4: Set different RVOL values.
Use Traffic Color for Line: The different T1-4 values & colors are used for the line plot.
This indicator is often used with our second version Real Relative Volume - Bar Indicator - Time Adjusted - DE & EN .
ETS Breakout LevelsThis indicator mimics the breakout levels a professional trader would draw and watch for trading opportunities. It is a very powerful tool to have.
The lines are drawn as soon as a new breakout level is detected, and the line is then automatically extended to the right, making it easy to see when the market reacts to it.
Knowing where important levels on a chart are, immediately takes you from having no idea where the market might make a big move, to being a trader ready to take action at the right time.
The Breakout Levels indicator is also very good at keeping you out of the market when it's simply choppy and difficult to trade, because the breakout levels will most likely fall outside of the choppy sideways consolidation area, but still prepare you for when the market finally picks a direction again.
This indicator also includes colored time bands that mark times during the trading day where historically stocks often reverse course, or may enter a period of consolidation. These times coincide with tea breaks, lunch breaks or times when news are typically announced.
For Forex traders, there are colored session bands that help you to easily see when the major markets are open.
What Makes It So Powerful?
- Give you a signal as early as possible and does not "repaint" once the bar completes
- Reacts to fast market direction changes like a master trader
- Is super easy to understand and implement in your trading
- Can be used for Forex, Stocks and Crypto
- Works on all timeframes
This indicator also has a number of options you can change in Settings:
1. "Safety Margin" - I keep this at zero, but if you want a bigger "buffer" for safety before entering a trade you can increase this value.
2. "Hidden Above Interval (Minutes)" - The Forex sessions or Stock important daily times can be set to be hidden above a certain timeframe to keep your charts clean.
3. "Show Moving Averages" - All of the moving averages that are included for convenience can be shown or hidden by setting this value.
3.1. The next 5 settings all deal with moving averages that can be shown or hidden individually.
4. "Show Stock Pivot Times" - There are a number of trading times for US Stocks that are important during the trading day, and this setting will highlight them.
4.1. "Show Main Stock Pivot Times" - This shows only the Stock trading times that are deemed the most important, and around these times the market often change direction (e.g. after the morning break, after lunch, etc.)
5. "Show Forex Sessions" - Does pretty much what it says, and you can also adjust the hours if you wish.
6. "Extreme Move Reversal Points" - If an extreme market move has been detected, and this is enabled, a "X" will be shown above or below the bar to indicate that the market might reverse.
7. "More Signals" - If you want to see more potential breakout levels, enable this option.
8. "Show VWAP" - This will include the VWAP indicator as a convenience if selected.
How To Use the ETS Breakout Levels Indicator
1. Add the indicator to any chart you wish to trade, Crypto, Forex or Stocks and set it to the timeframe you prefer. For instance, I use it on 1 minute and 5 minute charts for daytrading Stocks. For Forex I generally use a 15 minute chart, and longer timeframes for Crypto.
2. Open the Settings and change values to suit your requirements as described above.
3. When the indicator has determined that a new breakout level has formed, it will draw a line and extend it to the right so that you can see when future bars come close to it.
4. Price action will either bounce off it, or pierce through it and continue on.
5. If the market is relatively far away from smaller moving averages such as the 9 EMA or 20 EMA, expect that the price action might first move back to the moving averages before continuing in the new direction identified by the indicator.
6. When these levels are broken, it is often an indication of a breakout occurring and it can give you some very significant market moves.
This is an "invite only" script, which means that you will need to let me know that you're interested in it before you can get access to it. This is a paid script, please follow the link in my profile to get the details or ask me directly. It may take up to 48 hours for me to respond, but I do my best to respond as quickly as possible. You will get 7 days to test it for yourself on all your charts with no restrictions.

ETS Trending ArrowsThis indicator is the end result of years of trial and error to create an indicator that aims to mimic market entry points that a professional trader would take.
It has arrows that clearly show potential market entry points, and suggested stop-loss levels. What I like about it is that it generally responds as fast to market changes as a good trader would, leaving you enough time to still validate the move before taking it.
This basically levels the playing field, because even if you're a rookie trader, or maybe an experienced trader in a slump, this indicator can help you to identify possible trading entry points that is responsive to market moves, and that can be used on different timeframes based on how you want to trade. And if you're an experienced trader, this indicator will help you like a good trading buddy to make good trading decisions.
What Makes It So Powerful?
- Give you a signal as early as possible and does not "repaint" once the bar completes
- Reacts to fast market direction changes like a master trader
- Is super easy to understand and implement in your trading
- Can be used for Forex, Stocks and Crypto
- Works on all timeframes
How To Use The ETS Trending Arrows Indicator
1. Add the indicator to any chart you wish to trade, Crypto, Forex or Stocks and set it to the timeframe you prefer. For instance, I use it on 1 minute and 5 minute charts for daytrading Stocks. For Forex I generally use a 15 minute chart, and longer timeframes for Crypto.
2. Open the Settings and change values to suit your requirements:
2.1. "Early Trigger Live Signals / Stable Signals" - When you select "Stable Signals", the arrows will appear once the bar closes, on the new bar. Selecting "Early Trigger" will signal instantly and can give you an early entry, but may update in some cases as conditions change.
2.2 "Show More Signals" - This pretty much does what it says. If you don't want all possible signals, this will scale things back a bit and give you fewer signals.
2.3. "Show 20, 50, 200 Moving Averages" - This is just a convenience, and is provided to help you exit trades, which I typically do when price crosses back over the 9 EMA or 20 EMA.
2.4. "Show 9 Expo Moving Average" - Also provided for convenience, and separate in case you don't want this level of detail.
2.5. "Show Immediate Reversals" - Personally I don't use this setting, but someone requested that I add it. What it will do is if there is a signal, which then immediately passes the "stoploss" dotted line, this will immediately give a signal in the opposite direction.
2.6. "Show Bollinger Bands" - This is also only provided for convenience, I use Bollinger Bands to determine where the market move is in relation to the average deviation.
2.7. "Bollinger Bands Length" - Simply the regular BB length setting.
2.8. "Bollinger Bands Deviation" - I use a 2.5 setting by default in order to better identify areas where the price action is really far beyond where it should be.
3. Now that you've set things up, all you need to do is to wait for a signal. As mentioned earlier, the signals will react differently based on whether you chose "Early Trigger Live Signals" or "Stable Signals". If you opt for "Early Trigger Live Signals", like I do, you should pay attention to where the market currently is in relation to the closest moving average, like the 9 EMA or 20 EMA. Keep in mind that price will often signal a new move, but then first move back to the average, before continuing in the new direction identified by the trading arrow.
4. These signals are intended to identify new trending moves, and for that reason, if the market moves against the signal, you should not hold on to your position hoping that it will turn in your favor.
5. When the market is moving in your favor, resist the urge to exit quickly, and use either (or both) the 9 EMA and 20 EMA to exit your trades. A good approach is to use the 9 EMA to exit a portion (maybe 50%) of your trade, and exit out of the rest once price closes above or below the 20 EMA depending on the direction of your trade.
This is an "invite only" script, which means that you will need to let me know that you're interested in it before you can get access to it. This is a paid script, please follow the link in my profile to get the details or ask me directly. It may take up to 48 hours for me to respond, but I do my best to respond as quickly as possible. You will get 7 days to test it for yourself on all your charts with no restrictions.

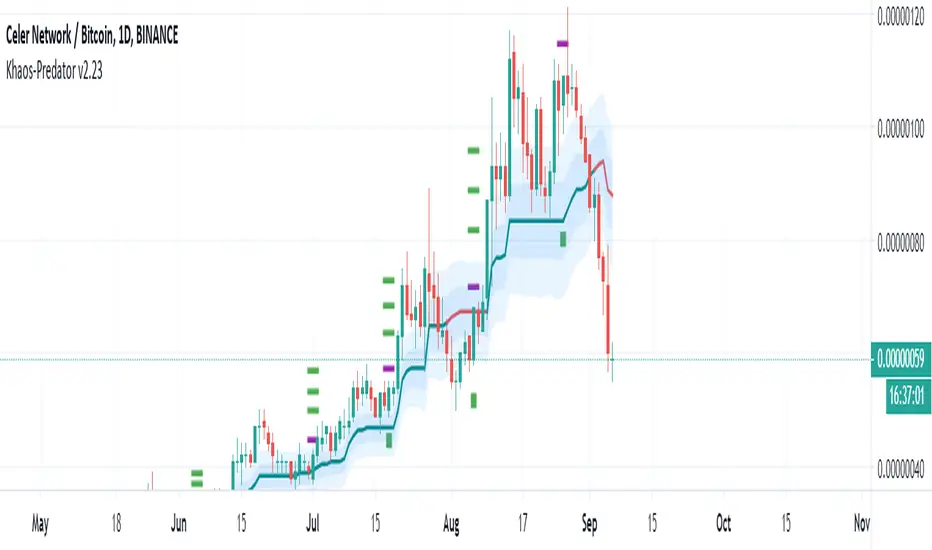
Khaos-PredatorThis Indicator is a full trading system that offers setups with Entries and Targets and Trade Management. This indicator is very accurate because it uses advanced setup detection and filtering logic.
There are 2 conditions that must occur for you to take a trade:
1) Price must move beyond the purple dot
2) The baseline must be green for long trades, or red for short trades.
The setup is triggered if the price passes the purple dot. Do not enter the trade unless price passes the purple dot. (You may wait for pullback to enter if you wish – but only after price traded beyond the purple dot firstly.) Remember, the trade is NOT active unless price moves beyond the purple dot.)
Each setup has 3 possible targets, which are dots colored green for longs and red for shorts.
You can use the baseline (which is a trend-line that is either green for bullish or red for bearish) to filter trades. You should only enter long trades if the baseline is green and only enter short trades if the baseline is red. One strategy would be if you enter a trade long, and reach the first target, you can take some profits, but still let the some of the position run and use the baseline to manage the trade.
Also, you can use the baseline for trailing stops.
To summarize:
• Purple Dot = Entry Trigger
• Green Dots = Long Targets (3 of them, for different price targets: target 1, 2 and 3)
• Green Square = Long Stop
• Red Dots = Short Targets (3 of them, for different price targets: target 1, 2 and 3)
• Red Square = Short Stop
The great thing about this indicator is that its universal, there are no settings necessary -- just put it on the chart and it finds high probability setups and paints it on the chart as they occur. There is NO Repainting with this indicator.
Of course, you can add other indicators if you wish, and even add this indicator to your existing trading system.
Again, this indicator does NOT repaint.
Once a setup is found, the indicator draws the entry trigger price and the targets at the setup bar close.
Setup Alerts are fully supported, via email, sms, and desktop notification.
*If you wish to license this indicator, please contact me via private message for details regarding access. Thank you.
LEGAL STUFF:
Risk Disclosure
Futures , forex, stock, crypto and derivative trading contains substantial risk and is not for every investor. An investor could potentially lose all or more than the initial investment. Risk capital is money that can be lost without jeopardizing ones’ financial security or life style. Only risk capital should be used for trading and only those with sufficient risk capital should consider trading. Past performance is not necessarily indicative of future results
Hypothetical Performance Disclosure
Hypothetical performance results have many inherent limitations, some of which are described below. no representation is being made that any account will or is likely to achieve profits or losses similar to those shown; in fact, there are frequently sharp differences between hypothetical performance results and the actual results subsequently achieved by any particular trading program. One of the limitations of hypothetical performance results is that they are generally prepared with the benefit of hindsight. In addition, hypothetical trading does not involve financial risk, and no hypothetical trading record can completely account for the impact of financial risk of actual trading. for example, the ability to withstand losses or to adhere to a particular trading program in spite of trading losses are material points which can also adversely affect actual trading results. There are numerous other factors related to the markets in general or to the implementation of any specific trading program which cannot be fully accounted for in the preparation of hypothetical performance results and all which can adversely affect trading results
Bitcoin Correlated Market DirectionIdentifies which major market is "controlling" Bitcoin and what direction that market is moving in.
Helps to identify confluence of trend or potential turning points for Bitcoin.
Blue = stocks in control and bullish
Purple = stocks in control and bearish
Orange = gold in control and bullish
Red = gold in control and bearish

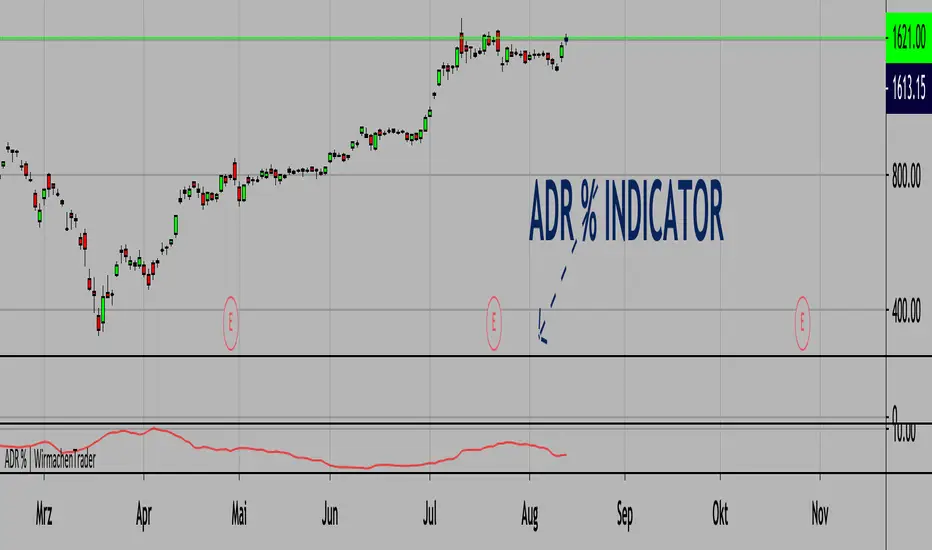
Average Daily Range % | Bigger relative range - better profits.(ENGLISH VERSION BELOW)
Die richtige Auswahl von Instrumenten ist essenziell. Wir können nur dann Profite machen, wenn das Instrument sich bewegt. Bekannte Indikatoren wie der ATR (Average True Range) inkludieren hier ebenfalls Kurslücken. Das ist gut, dennoch wollen wir Volatiltät von einem anderen Standpunkt betrachten. Welche Bewegungen sind also vom Hoch zum Tief möglich gewesen? Verständlicherweise können wir diesen Wert einer kleinen Aktie nicht mit TSLA vergleichen. Aus diesem Grund schauen wir uns die Relation zum Preis an. Somit können wir wirklich Äpfel mit Äpfel vergleichen. Je höher der Wert, desto mehr Range (basierend auf der 20 Tage-Historie und dem jeweiligen Preis). Natürlich funktioniert dieser Indikator auch in anderen Asset-Klassen wie Krypto, Forex etc.
Wichtig: Wende diesen Indikator im Tageschart an!
English version:
Stock selection is pretty important. We can only make decent profits if the underlying stock moves. Well-known indicators like the ATR (Average True Range) also include price gaps here. This is good, nevertheless, we want to look at volatility from another point of view. So, which movements were possible from high to low? Understandably, we cannot compare this value with TSLA for a small share. That's why we look at the relation to price.
The higher the value, the bigger the range (based on the 20-day history and the respective price).
Important: Use this indicator on a daily timeframe!
Cheers,
WirmachenTrader®
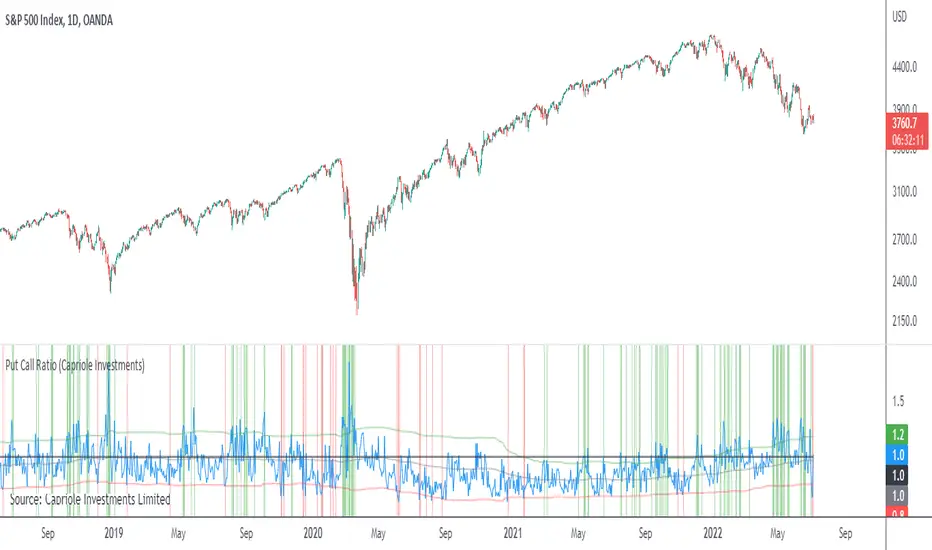
Put Call RatioPlots the CBOE Put Call Ratio and marks up locations of extremities.
Useful as a factor of confluence in identifying extremities in the market.
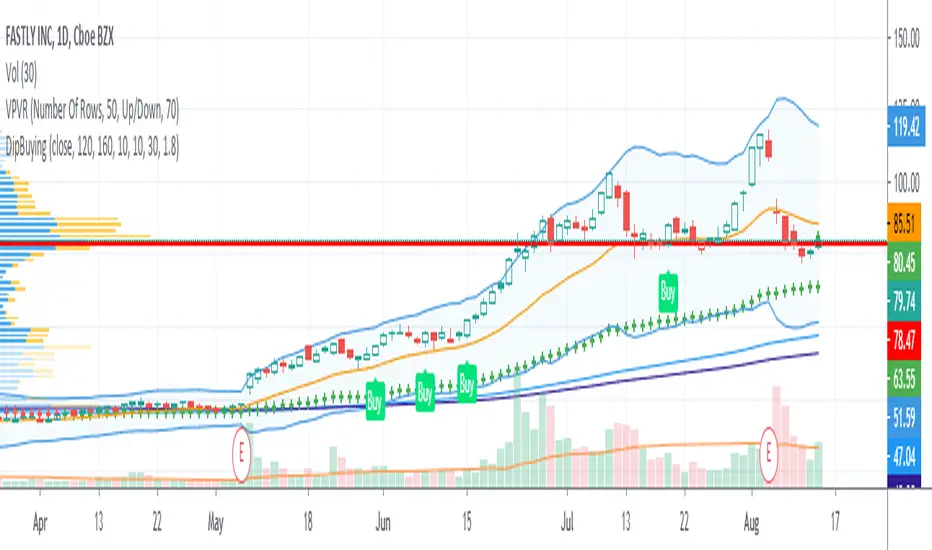
Nerd Dip Buying for StocksThis script is intended to generate BUY signals during pullbacks in stocks which are in the midst of mid to long-term uptrends. The ideal timeframe is Daily.
Signals should be acted upon at or near the close, or at open next bar.
I use 2 simple moving averages (SMA1 and SMA2) to determine whether the stock is currently in an uptrend. The default parameters are:
SMA1 = 120
SMA2 = 160
Buy signals are only produced when SMA1 is above SMA2.
As an additional filter I also use the Adaptive Moving Average (AMA) developed by Perry Kaufman. The settings are (10, 10, 30). Buy signals are allowed only when the bar closes above the AMA.
Lastly, the Buy signal itself is computed utilizing the Greatest Swing Value, a concept pioneered by Larry Williams in his book Long-Term Secrets To Short-Term Trading . You can control how often BUY signals appear by tweaking the parameter GSV Buy Factor . The smaller the number, the more often BUY signals appear. By default,
GSV Buy Factor = 1.8
This indicator has been developed with stocks trading in mind only, in particular US stocks. Feel free to apply it to other markets or asset classes and let me know the results. Thank you very much.
Magic CandleThis indicator is very simple, but surprisingly effective, and I haven't found any mention of something similar, so here it is. I hope it helps you in your stock trading.
Someone made a comment in a trading room that the 8 am candle of the stock looked odd, so I quickly checked all the other stocks I had on my screen, and for all of them, the 8 am candle was just a little strange. What's more, is that the stock would often respond to the high and low values of that 8 am candle later on in the day. It turned out to be quite an important support and resistance level indicator for stocks which I've used in my trading ever since I discovered it.
After testing it out day after day on multiple stocks, I decided to write this indicator, which not only projects the high and low values of the 8 am candle, but also the previous day's closing price.
If you find that there's another "magic candle" out there for Forex or Crypto, please let me know!
You have the option to set the "magic candle" to another time, if you want to experiment with things.

ETS MA Deviation ExtremesWhile trading, I noticed that emphasis is often placed on how far price has moved from the moving average (whichever a trader prefers). In these cases I also found that Bollinger Bands only sometimes played a factor in determining whether price had moved "too far" from the moving average to potentially result in a sharp move back to the average.
Because I wanted something more objective than a "gut feeling" that price has moved away from the average enough to make it move back, I decided to see what I could do to determine the standard deviation of how price action moved away from the average , in order to determine when it could potentially have a "rubber band effect" to jump back to the "norm". The result of that is the ETS MA Deviation Extremes indicator, and I hope that it will help you in your trading.
The indicator also has bar coloring included, which can be turned off, which gives a good on-chart visual to warn you that the price action might reverse. This has often helped me to be a bit more cautious before just jumping into a trade that might be on the brink of reversing and taking my position out, and it actually turned out to be a good indicator for a reversal trade strategy.
The histogram bars give an indication of how far the price has moved away from the average, and I look for a potential reversal as soon as the histograms move back inside the deviation lines after having been outside it. The bar coloration actually depend on more than one set of deviation lines, but putting all of that on the chart just makes it confusing, so I removed the ones that I felt were not essential to make it clearer.
I hope it helps you in your trading and makes it easier for you to trade successfully!

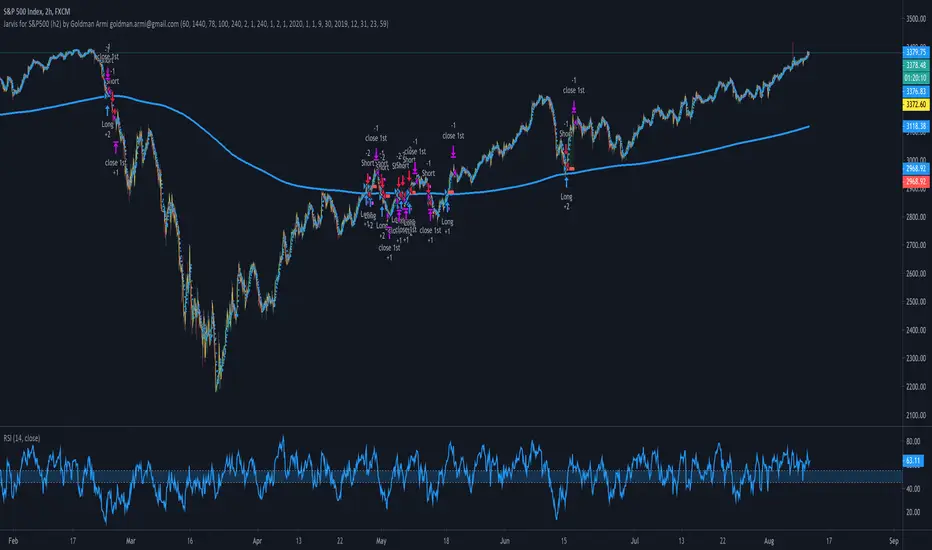
Jarvis for SPX500 (S&P500) by Goldman ArmiThis strategy is called JARVIS after the famous AI from the MARVEL movie Iron Man.
It is an improvement of the Copernicus Strategy to get better results. More exactly I was aiming to obtain over 50% of the number of trades profitable, for every pair provided (see the title).
The strategy tester does not include leverage trading, please keep that in mind and feel free to change the parameters of the volume for the position in the strategy settings to see the closer to reality results.
The setup for this strategy is more complicated because it includes 3 averages, all of them calculated with prices obtain by various formulas for each one of them and I call this: Sophisticated Moving Average (Copyright). Each of the 3 averages are applied to different timeframes and have different values. All of these parameters are configured separately for every trading pair and this is why I am publishing them separately.
There are not a lot of trades in this strategy, the average is around 3/month and the backtest you see here is from January 2020 until the time of this publication.
You can use the Tradingview alert services to configure this to execute (webhook) on your exchange/broker, because strategies have now the possibility to send alerts.
For other questions please send me a message.
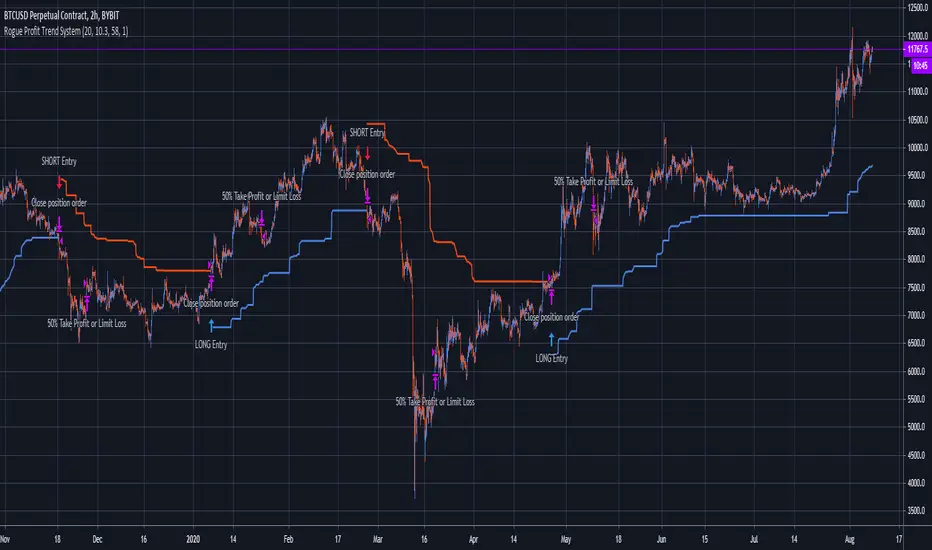
Rogue Profit Trend SystemThis system can be used for all assets. This script identifies trends and when to enter and exit. There is also built in risk management in the form of a take profit target or a reduction of risk to limit a losing trade. Inputs are variable and can be changed to better suit the asset and time frame you are trading. Since the risk management (take profit or limit loss) is calculated by 50% of your position, this system is designed to trade in multiples of two's. For example, you enter into a position with $100 at risk, when your risk management signal fires, it will reduce your position by 50% to either snag some profit or limit a loser leaving you with $50 in the position. Close the trade completely when the trend reverses for either a profit or loss.
Nothing about trading is easy. You will have losing trades. Managing your risk is the key to success which is why this system is so powerful. Markets are fluid and random so you will have to put some time and effort into adjusting the system inputs for each asset and the respective time frame you are trading and continue to adjust as time passes. This system will make you money if you manage it correctly and systematically.
Message me for two day trial access. Happy trading!
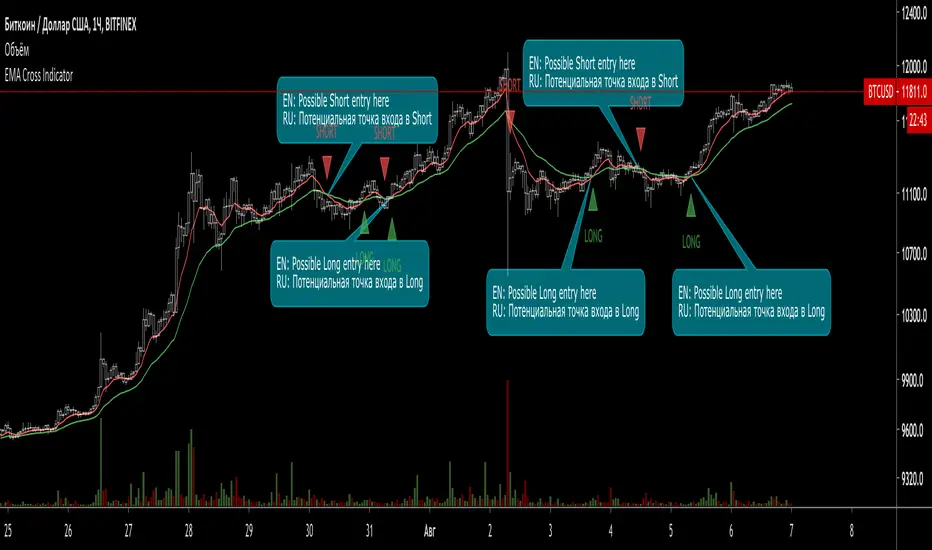
EMA Cross Indicator (with signals)This indicator shows 2 EMA (Long and Short) Cross and gives a possible entry point for a trade.
When Short EMA (red line) line crosses Long EMA (green) from bottom to top - this is a possible Long trade entry point.
When Long EMA (green line) line crosses Short EMA (red) from bottom to top - this is a possible Short trade entry point.
In both cases (basically, all the crossovers) are indicated with "Long" and "Short" labels.
Works with Crypto (from 30 min timeframe and higher)
Stocks (from 1 hour timeframe and higher)
Commodities (from 1 hour timeframe and higher)
Forex (from 1 hour timeframe and higher)
Consider using it with respect to Your trading style, money- and risk-management as well as other indicators.
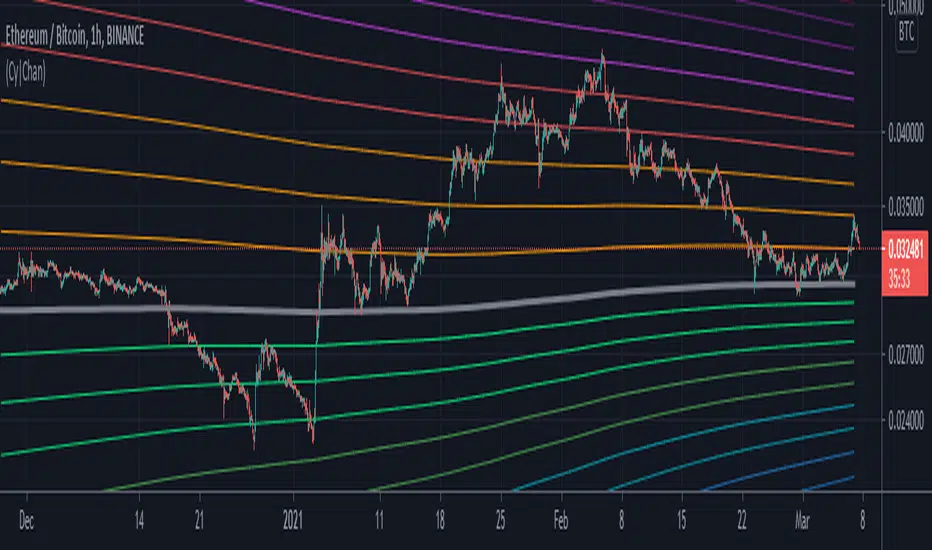
Cyber ChannelStandard deviation levels to determine if the price is over-extended in the positive/negative direction about the user defined MA line.
Historical confluence with the different levels can be used to estimate and predict the probability of a significant price retracement within given time-scale; and to help anticipate if the price is nearing local or all-time highs/lows.
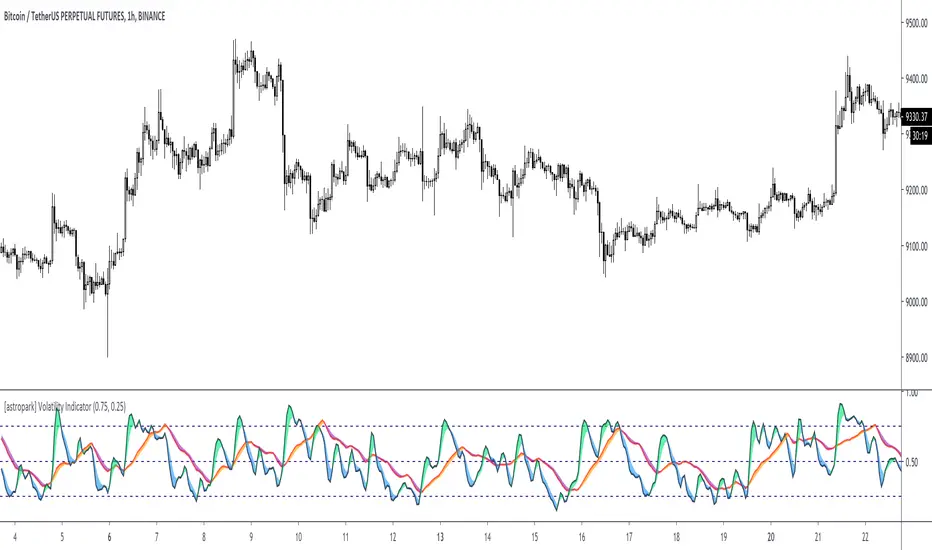
[astropark] Volatility IndicatorDear Followers,
today another interesting script: Volatility Indicator .
This indicator measures the volatility of the market you see in the timeframe you see, in a scale between 0 and 1.
It works on cryptocurrencies, commodities, stocks, indexes and forex.
You will see 2 volatility waves:
a black one (with green and blue shadow for increasing and decreasing mode), which is the "faster" one
a red one (with orange and purple shadow for increasing and decreasing mode), which is the "slower" one
The indicator highlights high volatility when it's near the top (1), while low volatility when near the bottom (0).
You can combine this indicator with your own strategy and indicators to validate them :
on low volatility it often happens that a signal fails to be profitable, as it lacks fuel
while it's better if volatility is over low level as price has more room to run while volatility increasing to the top
This indicator also lets you set alerts when volatility exceeds high level or low level.
This is a premium indicator , so send me a private message in order to get access to this script.
Musashi MTF Trend HeatMapThis indicator compliments the Musashi TrendBars and allows convenient multi time frame analysis.
This HeatMap, shows 5 different time zones, each with color codes to indicate the trend expression of a corresponding timeframe.
- Dark Green = Good Uptrend (ok to enter short)
- Light Green = Uptrend but it can be exhausted (put in protective stops)
- Cyan = In Bull Trend but pulling back (be careful, maybe put in protective stops)
- Dark Red = Good Downtrend (ok to enter short)
- Orange = Downtrend but it can be exhausted (put in protective stops)
- Magenta = In Bear Trend but pulling back (be careful, maybe put in protective stops)
The dark grey markers on the Heat Map show when markets are not having strong trends.
*If you wish to license this indicator, please contact me via private message for details regarding access. Thank you.
LEGAL STUFF:
Risk Disclosure
Futures , forex, stock, crypto and derivative trading contains substantial risk and is not for every investor. An investor could potentially lose all or more than the initial investment. Risk capital is money that can be lost without jeopardizing ones’ financial security or life style. Only risk capital should be used for trading and only those with sufficient risk capital should consider trading. Past performance is not necessarily indicative of future results
Hypothetical Performance Disclosure
Hypothetical performance results have many inherent limitations, some of which are described below. no representation is being made that any account will or is likely to achieve profits or losses similar to those shown; in fact, there are frequently sharp differences between hypothetical performance results and the actual results subsequently achieved by any particular trading program. One of the limitations of hypothetical performance results is that they are generally prepared with the benefit of hindsight. In addition, hypothetical trading does not involve financial risk, and no hypothetical trading record can completely account for the impact of financial risk of actual trading. for example, the ability to withstand losses or to adhere to a particular trading program in spite of trading losses are material points which can also adversely affect actual trading results. There are numerous other factors related to the markets in general or to the implementation of any specific trading program which cannot be fully accounted for in the preparation of hypothetical performance results and all which can adversely affect trading results

Aditya Signal-1.1 for Nifty and Bank NiftyThis is non-repainting indicator which can be used for Index, Stocks, Commodities and Bitcoin or any other securities depending upon the various parameter setting of the indicator. This particular strategy is for Nifty-50 Index which is traded on NSE(India).
The detailed description about the indicator is as follows:
Long Period: Period for calculating Primary Signal Line (Yellow).
Long Period Input Source: Input for calculating Primary Signal Line.
Short Period: Period for smoothing the Primary Signal Line.
Short Period MA: Method for smoothing the Primary Signal Line.
No. of ATR Bars: No. of ATR bars for calculating Primary Signal Line.
ATR Multiplier: ATR multiplier for ATR calculation.
Trade Trigger: Value above or below of Primary Signal Line for Long or Short signal. The dotted lines in Green and Red color represents the same.
Bar Crossover Input Source: Current bar input for additional signal confirmation above Primary Signal Line.
Bars Above Signal High: No. of bars closing above Secondary Signal Line (Blue)
Bars Below Signal Low: No. of bars closing above Secondary Signal Line (Purple)
No. of bars crossover method uses certain no. of bars for closing above High or Low of the crossover of closing price and the Primary Signal Line in combination with Trade Trigger. The idea behind this design is to avoid fake signal due sudden spike in price. Also, this ensures that price consolidates above High in case of Long signal confirmation and vice-versa. By increasing no. of such bars, we can anticipate, how much time it takes for short-term and long-term trend reversal.
Depending upon the time-frame, just by observing the High and Low of previous crossover of closing price and Primary Signal Line, we will have better understanding of undercurrent of market.
By using different combination of Trade Tigger value and no. of bars above and below, we can anticipate better trend confirmation.
The various combinations of price source of Long Period Input Source and Bar Crossover Input Source, the Short Period MA method shows promising results. Kindly PM me for these optimum settings for other financial instruments.
It always better to book partial profit after getting into the trade which increases the odds. The default trade quantity is 2. We book 1 quantity after our partial profit target is reached and let the remaining quantity be in the trade until the reversal of trend. By enabling or disabling the same we can determine the profit or loss from historical trade from when the trade quantity is 1. Just remember to change the default quantity to 1 in Order Size from properties when you disable the Take Partial Profit option.
Take Partial Profit: Whether to book partial or not as explained above.
Partial Profit Points: It always better to book partial profit after trend getting into the trade. The default trade quantity is 2. We book 1 quantity after our partial profit target is hit and let the remaining quantity in the trade until the reversal of trend.
Instrument Type: We can select the which instrument for analysis. By adjusting the Take Partial Profit value by selecting Other Option, you can analyze instrument of your choice other than mentioned in the list for Partial Profit depending upon stock tick value and lot quantity or you can PM me. I have adjusted value for Crude Oil and Silver for MCX(India) future contract values.
This is a premium indicator so send me a private message for 15 days free trial.
"Use the link below to obtain access to this indicator."
Disclaimer: This script/strategy is for educational purpose and individual use only. The author of this script/strategy will not accept any liability for loss or damage as a result of reliance on the information contained in the charts. Please be fully informed regarding the risks and costs associated with trading the financial markets.

Trendflex - Another new Ehlers indicatorSource: Stocks and Commodities V38
Hooray! Another new John Ehlers indicator!
John claims this indicator is lag-less and uses the SPY on the Daily as an example.
This indicator is a slight modification of Reflex, which I have posted here
I think it's better for Stocks and ETFs than Reflex since it factors in long trends. It tends to keep you in winning trades for a long time.
I believe this indicator can be used for entries or exits, potentially both.
Entry
1. Entering Long positions at the pivot low points (Stocks and ETFs)
2. Entering Long when the Reflex crosses above the zero lines (Stocks, ETFs, Commodities )
Exit
1. Exiting Long positions at a new pivot high point (Stocks and ETFs)
2. Exiting Long when the Reflex crosses below the zero lines (Stocks, ETFs, Commodities )
In this example, I place a Long order on the SPY every time the Reflex crosses above the zero level and exit when it crosses below or pops my stop loss, set at 1.5 * Daily ATR.
2/3 Wins
+16.05%
Let me know in the comment section if you're able to use this in a strategy.
