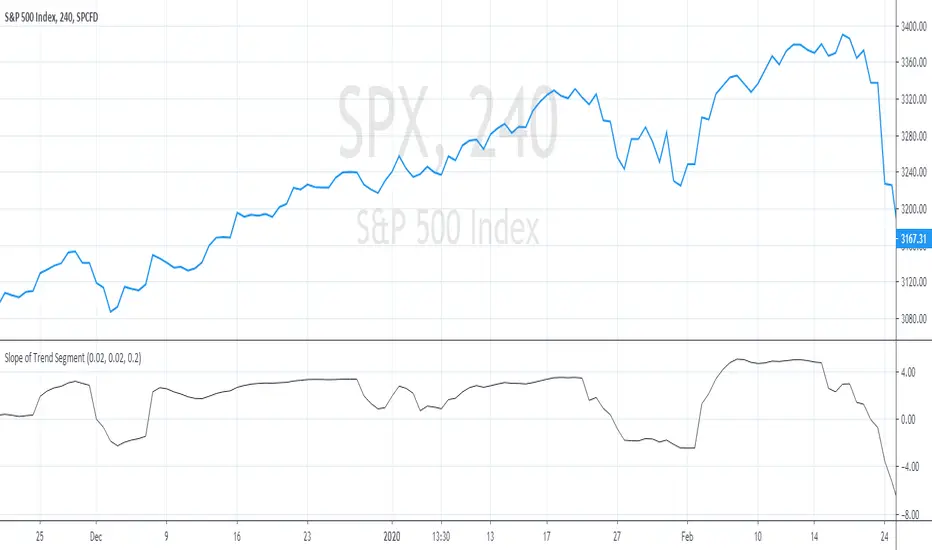
Range StrengthRange Strength is a super simple indicator designed for the mean reversion (range trading) strategy, it shows you how strong the market is ranging or trending. When the indicator is positive (green color) the market is a range mode, when the indicator is negative (red color) it is in a trending mode.
It's best used together with our Buy Sell Bands indicator to identify entry and exit signals within the range, ideally only taking trades when the Range Strength indicator is showing positive (green) readings.
How Is It Different From Other Indicators?
- Designed specifically for the mean reversion (range trading) strategy
- Shows one simple reading and graphical representation of range strength
- Identify the best times to take mean reversion trades versus trend trades
- Works well in conjunction with the Buy Sell Bands indicator to validate entry & exit signals
- Can be applied to all markets and timeframes
How To Use The Indicator?
1) Visit our website URL shown below this description and signup
2) We will then grant your TradingView username permission to use our indicators
3) Go to your Indicators window, then the Invite-Only section and add our indicators to your chart
4) Our indicators will then show on every chart you now look at
5) You can set up alerts to be notified in real time of trading signals from our indicators
6) Read our user manual for all the best tips on how to use our indicators as part of a range trading strategy
7) Feel free to reach out to us for personal one-on-one help with getting setup
What Markets and Conditions Does It Work Best On?
All markets cycle between trending and ranging modes, and the key to successfully using our indicators is identifying when the market is in or about to go into a range trading mode, and as such it can be applied to all markets and timeframes.
Some markets and timeframes trade within ranges more predictably than others, for example Forex, Cryptocurrencies, and Futures on the 15 minute timeframe during the US night session can work well due to the lack of price sensitive news creating lasting trends. With Stocks & ETFs on the 5 minute timeframe during the midday session on large cap blue chip stocks with no recent news releases can show strong range trading environments to use our indicators in.
In addition to single markets, you can also use our indicators on pair charts, for example Coca Cola(KO) versus Pepsi(PEP), you can do this by entering KO/PEP inside your TradingView chart quote box and it will bring up a pair chart. Our indicators will show buy and sell signals right on the pair chart just like any other single instrument chart. You can get very creative with what type of pairs you can come up with.
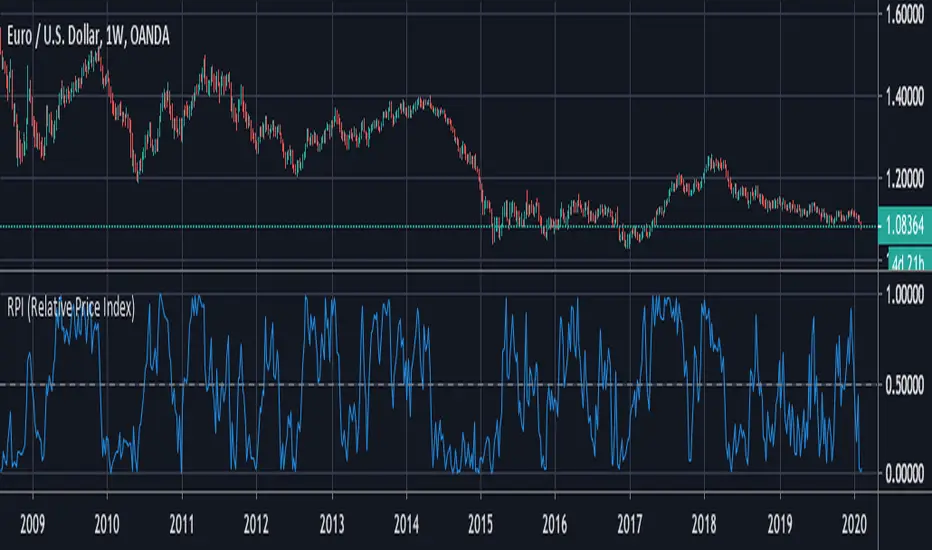
Our indicators are primarily designed for day trading and swing trading, however they can also be used for position trading and investing by identifying technically oversold and overbought range levels that are based on current and past volatility around a dynamic average price, for this we recommend using a weekly chart to identify longer trading opportunities.
As always indicators should be used as part of a trading strategy to assist in making decisions, you can't just blindly follow every signal they produce, you should always seek to compliment technical trading signals with additional analysis to reduce your risk and increase your odds of making a winning trade.
Examples Of Use On Various Markets and Timeframes
GBP vs CHF Forex Pair 15 Minute Chart
Tesla Stock 1 Minute Chart
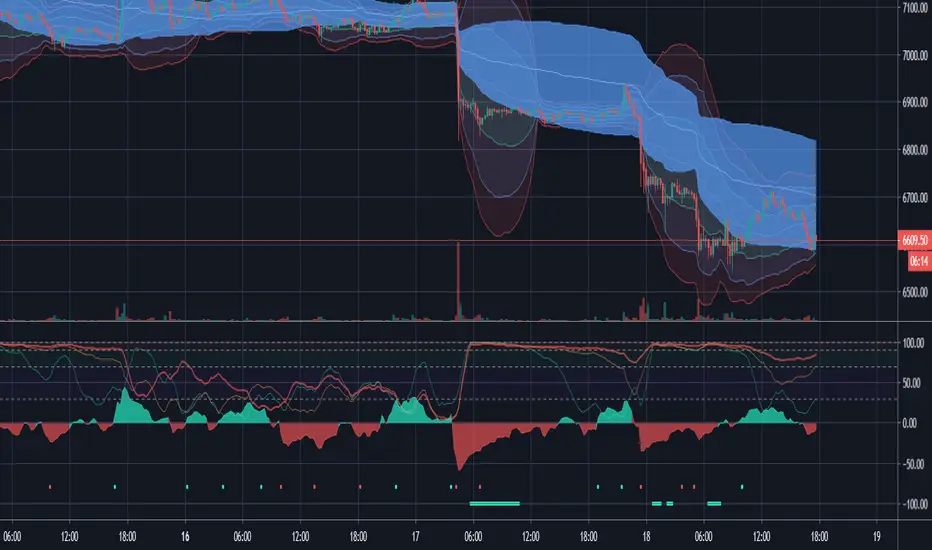
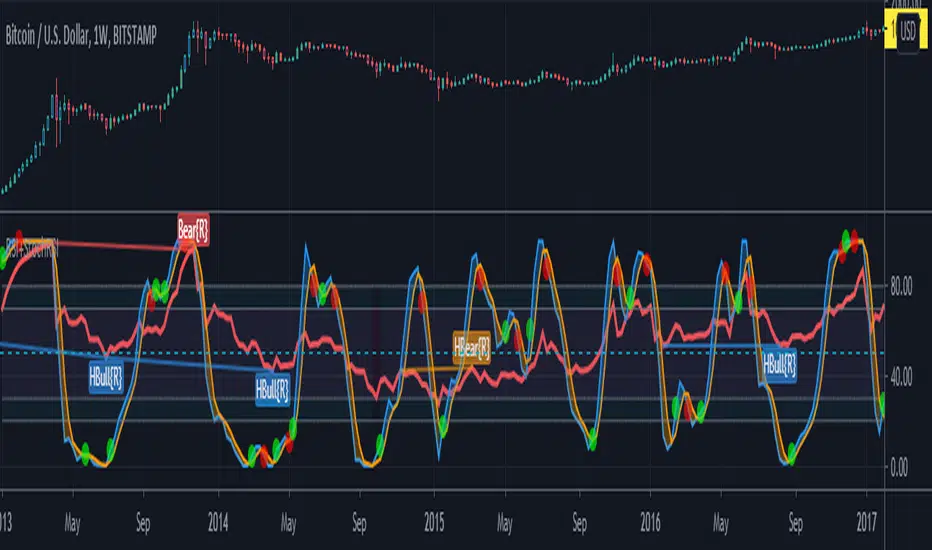
Bitcoin vs USD Crypto Pair 15 Minute Chart
Micro E-Mini SP500 Futures 1 Minute Chart
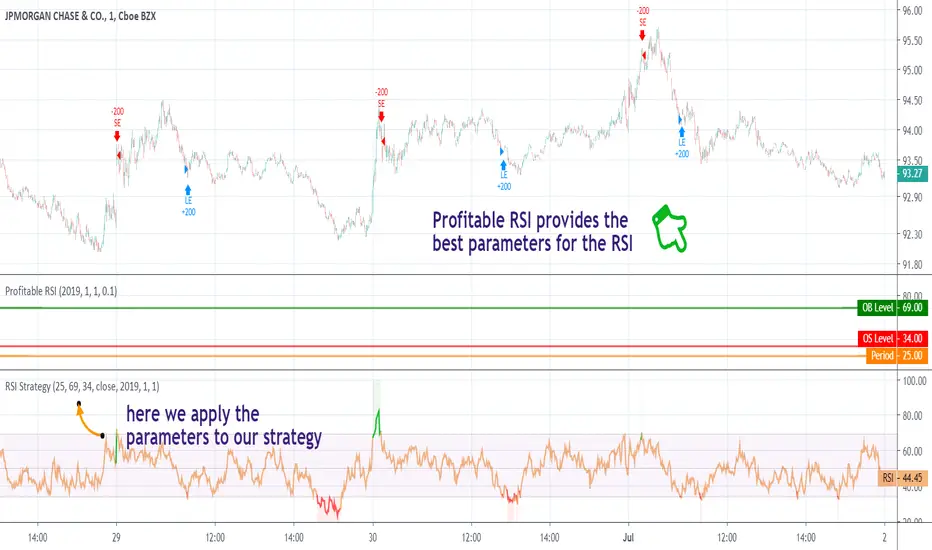
Mastercard vs Visa Stock Daily Pair Chart
To gain access to the Range Strength and Buy Sell Bands Indicators visit our website shown below.
Happy Range Trading :)
Chỉ báo Pine Script®