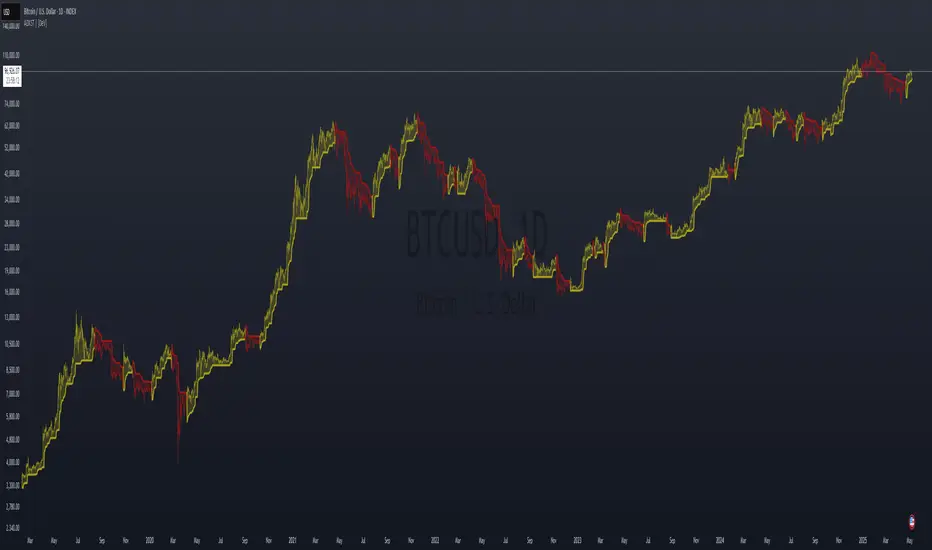
kyle algo v1
Integration of multiple technical indicators: The strategy mainly combines two technical indicators - Keltner Channels and Supertrend, to generate trading signals. It also calculates fifteen exponential moving averages (EMAs) for the high price with different periods ranging from 9 to 51.
Unique combination of indicators: The traditional Supertrend typically uses Average True Range (ATR) to calculate its upper and lower bands. In contrast, this script modifies the approach to use Keltner Channels instead.
Flexible sensitivity adjustment: This strategy provides a "sensitivity" input parameter for users to adjust, which controls the multiplier for the range in the Supertrend calculation. This can make the signals more or less sensitive to price changes, allowing users to tailor the strategy to their own risk tolerance and trading style.
EMA Energy Representation: The code offers a visualization of "EMA Energy", which color-codes the EMA lines based on whether the closing price is above or below the EMA line. This can provide an intuitive understanding of market trends.
Clear visual signals: The strategy generates clear "BUY" and "SELL" signals, represented as labels on the chart. This makes it easy to identify potential entry and exit points in the market.
Customizable: The script provides several user inputs, making it possible to fine-tune the strategy according to different market conditions and individual trading preferences.
EMA (Exponential Moving Average) Principle:
The EMA is a type of moving average that assigns more weight to the most recent data.
It responds more quickly to recent price changes and is used to capture short-term price trends.
Principle of Color Change :
In this trading strategy, the color of the EMA line changes based on whether the closing price is above or below the EMA. If the closing price is above the EMA, the EMA line turns green,
indicating an upward price trend. Conversely, if the closing price is below the EMA, the EMA line turns red,
indicating a downward price trend. These color changes help traders to more intuitively identify price trends
In short, our team provides a lot of practical space
That is your development space
Supertrend
Smooth Trail V1Please, enjoy your new game changing tradingview indicator, may I present you: the Smooth Trail (first version).
The Smooth Trail is an indicator that works just like a super trend, but it has a completely different usage and potential.
The super trend works following the price and displaying a line that uses the ATR to determine how far it has to be from the actual price, and many new trader like to use the indicator thanks to his easy readability and the buy sell signals that it shows, unfortunately this is not the best usage of the indicator and it often leads to lose money on the markets.
The main characteristics that this indicator has is that, not like the normal super trend, it follow the trend the better adapting itself in the retracement phases.
The second feature that dictate the best usage of this indicator, is that it shows a zone in which to buy or sell to have the best risk to reward ratio.
The indicator also works as dynamic level of support and resistance and can be used the best for trend following strategies to maximize the profits.
The first input, the multiplier, is used to determine how many times the ATR has to be added or subtracted in order to plot the indicator.
The second input, the length, is used to determine how many candle the indicator and the ATR have to consider for the calculation.
The third and last input, the zone width, is used to calculate the width of the zone displayed by the indicator, and is the factor that will be multiplied to the ATR, this means that if you leave the settings as default, the zone will be 1 ATR or 34 candle width.
This indicator is great to use in confluence with other indicator or with various candlestick pattern.
[JL] Supertrend Zone Pivot Point with zigzag fibThis is an open-source Pine script that generates a Supertrend Zone Pivot Point with Zigzag Fib indicator for TradingView. The indicator displays the Supertrend Zone, pivot points, and Fibonacci levels on the chart.
One of the unique features of this indicator is that it uses a Zigzag that does not repaint, ensuring accurate high and low points for the pivot points.
Another feature is that when the Supertrend is in an uptrend, only the highest points are taken as pivot points, and when it's in a downtrend, only the lowest points are taken as pivot points.
The Fibonacci levels are calculated based on the previous high and low pivot points, with labels displaying the corresponding levels on the chart.
The indicator also includes options to show/hide the Zigzag and Fibonacci levels.
Overall, this indicator is useful for identifying key pivot points and Fibonacci levels in the Supertrend Zone, providing valuable information for traders to make informed decisions.
Volume-Weighted Supertrend Strategy [wbburgin]This is a script that can be used as a strategy or a standalone indicator.
The Volume-Weighted Supertrend is a supertrend based on a rolling VWAP, instead of a normal price source. The strategy has two components - a supertrend based off of this VWAP (shown on the chart) and a supertrend from volume itself (not plotted on the chart directly). The supertrend from volume is an example of my "Supertrend Any Source" indicator, where a custom ATR is created from non-OHLC data; this is available as both a separate public script and also in my "wbburgin_utils" library for you to use in your own script creation.
The supertrend from volume acts as a confirmation filter for the VWAP-supertrend shown on-chart. If the volume supertrend is trending up and the VWAP-based supertrend is also trending up, a buy signal is generated. Likewise, if the volume supertrend is trending down and the VWAP-supertrend is trending down, a sell signal is generated. The colors are based off of whether both supertrends are trending up or down: green for both up, blue for only price up, orange for only price down, and red for both down.
The settings enable you to change the volume length and the ATR length separately, as well as the multiplier and the source for the price supertrend. If you load the indicator for the first time and see no entries and exits, this is because "Show Strategy Entries and Exits" is disabled in the settings. This is if you plan on using the strategy as an indicator and don't want to be bothered by the entry and exit symbols on the chart. Additionally, for those who like clean charts (like me), you can turn all the labels off in the settings, as well as the highlighting.
My default strategy settings for the strategy results shown below are as follows: 5% equity per trade, 5 degrees of pyramiding, commissions of 0.08% per trade. This strategy doesn't come with stops yet, so please be aware of that before using it to trade - I highly suggest you create your own stops based off of your R/R ratio and personal risk tolerance. Additionally, it works best on trending assets (b/c of the supertrends) with high volume. This might mean it does not work as well on lower timeframes.
SupertrendThis indicator is based on Multi timeframe supertrend . i use pine script function ta.supertrend() ..
The Multiple Timeframe Supertrend is a technical analysis indicator that helps traders identify the overall market trend across different timeframes. It is based on the concept of the Supertrend indicator, which is designed to follow the trend and provide buy or sell signals.
The Multiple Timeframe Supertrend takes into account the Supertrend indicator's values on multiple timeframes, typically a higher timeframe (e.g., daily or weekly) and a lower timeframe (e.g., hourly or 15 minutes). By considering the trend direction on both timeframes, traders can get a broader perspective on the market trend and potentially improve their trading decisions.
general approach to using the Multiple Timeframe Supertrend indicator
Determine the timeframes: Choose the higher timeframe and the lower timeframe you want to analyze. For example, you might use the daily and hourly charts.
Calculate the Supertrend on each timeframe: Apply the Supertrend indicator separately on each timeframe, using the appropriate parameters (such as period and multiplier).
Analyze the trend: Compare the Supertrend values on both timeframes. If the Supertrend is bullish (indicating an uptrend) on both timeframes, it suggests a stronger bullish bias. Conversely, if both timeframes show a bearish Supertrend, it indicates a stronger bearish bias.
Trading decisions: Based on the analysis, you can make trading decisions. For example, if the higher timeframe shows an uptrend and the lower timeframe confirms the same trend, you might look for buying opportunities. Conversely, if both timeframes indicate a downtrend, you might consider selling or shorting.
MTF Fusion - SuperTrend [TradingIndicators]SuperTrend is undoubtedly one of the most popular and influential indicators ever developed, and by combining it with our MTF Fusion algorithm, we believe we have made it more useful and powerful than ever with MTF Fusion SuperTrend .
Let's start with a brief review of what the original SuperTrend indicator is and how it works.
What is SuperTrend?
The SuperTrend indicator is a popular technical analysis tool used in financial markets to identify the direction of a trend and potential entry and exit points for trading. It was developed by Olivier Seban, a French trader, and first introduced in his book "Tout le monde peut gagner en bourse" ("Everyone Can Win in the Stock Market") published in 2008.
SuperTrend is based on the concept of Average True Range (ATR) and uses two parameters: the multiplier and the period. The ATR measures the volatility of a financial instrument, and the SuperTrend indicator utilizes this information to plot a line above or below the price chart. It is an 'AITM' (Always In The Market) indicator, which, in its original form, is always 'long' or 'short' - and never 'flat'.
Here's a brief overview of how the SuperTrend indicator works:
Calculation of the ATR: The ATR is calculated using historical price data over a specified period. It measures the average range between high and low prices, reflecting the market's volatility.
Calculation of the upward (long/bullish) and downward (short/bearish) SuperTrend lines: The SuperTrend indicator multiplies the ATR by a specified multiplier (typically 2 or 3) and adds/subtracts the result from the current closing price. This calculation determines the upward and downward SuperTrend lines.
Plotting the Indicator: The SuperTrend indicator plots a line above the price chart when the price is trending upwards, and below the price chart when the price is trending downwards. The distance between the price and the indicator line provides insights into the strength of the trend.
Traders commonly use the SuperTrend indicator to identify potential buy or sell signals. For example, a buy signal may be generated when the price crosses above the indicator line, indicating an uptrend. Conversely, a sell signal may be triggered when the price crosses below the indicator line, signaling a downtrend.
What is MTF Fusion?
Multi-Timeframe (MTF) Fusion is the process of combining calculations from multiple timeframes higher than the chart's into one 'fused' value or indicator. It is based on the idea that integrating data from higher timeframes can help us to better identify short-term trading opportunities within the context of long-term market trends.
How does it work?
Let's use the context of this indicator, which calculates SuperTrend lines, as an example to explain how MTF Fusion works and how you can perform it yourself.
Step 1: Selecting Higher Timeframes
The first step is to determine the appropriate higher timeframes to use for the fusion calculation. These timeframes should typically be chosen based on their ability to provide meaningful price levels and action which actively affect the price action of the smaller timeframe you're focused on. For example, if you are trading the 5 minute chart, you might select the 15 minute, 30 minute, and hourly timeframe as the higher timeframes you want to fuse in order to give you a more holistic view of the trends and action affecting you on the 5 minute. In this indicator, four higher timeframes are automatically selected depending on the timeframe of the chart it is applied to.
Step 2: Gathering Data and Calculations
Once the higher timeframes are identified, the next step is to calculate the data from these higher timeframes that will be used to calculate your fused values. In this indicator, for example, the values of SuperTrend lines are calculated by determining the value of the SuperTrend indicator for all four higher timeframes.
Step 3: Fusing the Values From Higher Timeframes
The next step is to actually combine the values from these higher timeframes to obtain your 'fused' indicator values. The simplest approach to this is to simply average them. If you have calculated the value of a SuperTrend line from three higher timeframes, you can, for example, calculate your 'multi-timeframe fused level' as (HigherTF_SuperTrend_1 + HigherTF_SuperTrend_2 + HigherTF_SuperTrend_3) / 3.0.
Step 4: Visualization and Interpretation
Once the calculations are complete, the resulting fused indicator values are plotted on the chart. These values reflect the fusion of data from the multiple higher timeframes, giving a broader perspective on the market's behavior and potentially valuable insights without the need to manually consider values from each higher timeframe yourself.
What makes this script unique? Why is it closed source?
While the process described above is fairly unique and sounds simple, the truly important key lies in determining which higher timeframes to fuse together, and how to weight their values when calculating the fused end result in such a way that best leverages their relationship for useful TA.
This MTF Fusion indicator employs a smart, adaptive algorithm which automatically selects appropriate higher timeframes to use in fusion calculations depending on the timeframe of the chart it is applied to. It also uses a dynamic algorithm to adjust and weight the SuperTrend calculations depending on each higher timeframe's relationship to the chart timeframe. These algorithms are based on extensive testing and are the reason behind this script's closed source status.
Unlike in the original indicator, flat/'No Trend' areas exist in MTF Fusion SuperTrend!
MTF Fusion SuperTrend only shows a Fusion SuperTrend when the majority of SuperTrends from higher timeframes are in agreement and signaling the same trend direction . So, unlike the original SuperTrend indicator, MTF Fusion SuperTrend sometimes shows no SuperTrend line at all - typically in flat or indecisive areas, which we think is beneficial and helps to filter out noise on smaller timeframes.
Included Features
Fusion SuperTrend lines
Dynamic Multi-Timeframe SuperTrends
Filled zones to highlight trends
Full customization of SuperTrend parameters
Pre-built color stylings
Options
Fusion View: Show/hide the Fusion SuperTrends calculated from multiple higher timeframes
MTF View: Show/hide the SuperTrends from multiple higher timeframes used to calculate the Fusion SuperTrends
Fill Trending Zones: Show/hide the fill for 'trending zones' between price and the Fusion SuperTrends
Multiplier: Sets the multiplier for all SuperTrend calculations
ATR Period: Sets the ATR period for all SuperTrend calculations
Pre-Built Color Styles: Use a pre-built color styling (uncheck to use your own colors)
Manual Color Styles: When pre-built color styles are disabled, use these color inputs to define your own
Dodge Trend [MyTradingCoder]Introducing the "Dodge Trend" indicator, an innovative variant of the Supertrend indicator designed to help traders better avoid fakeouts and maintain positions in established trends.
Like the Supertrend, the Dodge Trend uses Average True Range (ATR) but incorporates a unique adaptive adjustment feature that differentiates it from its counterparts. While the conventional Supertrend rises with the trend and only descends when the price crosses it, the Dodge Trend is designed to 'dodge' potential fakeouts.
This 'dodging' mechanism works by allowing the Dodge Trend to fall slightly during pullbacks, reducing the risk of a premature exit due to a temporary price drop. The recovery rate after the pullback is quicker but is slightly lower than the rate at which a new Dodge Trend high would be established in an uptrend. This unique adjustment feature allows the Dodge Trend to chase price action in an exponential fashion, potentially enabling a quicker exit when the trend shifts.
Key Settings:
Length: Adjust how much price action is taken into consideration for the ATR average. Lower values yield higher responsiveness to recent price action.
Size: Determines the initial deviation of the Dodge Trend when it resets after every flip/break.
Source: Specifies the data point (close, high, open, low, hl2, etc.) used for the Dodge Trend.
Dodge Intensity: Adjusts the intensity of the pullback effect. Higher values result in more intense pullbacks. Range is limited between 0 and 99, with 95 as the recommended default.
Bullish Color Setting: Sets the color for the uptrend Dodge Trend.
Bearish Color Setting: Sets the color for the downtrend Dodge Trend.
Dodge Trend is a powerful tool for traders looking to ride trends and avoid unnecessary exits due to short-term price fluctuations. While it offers a unique feature that may potentially improve trading outcomes, it should be used in conjunction with other indicators and analysis methods for a comprehensive trading strategy. As with all tools, it does not guarantee profitable trades but aims to give traders more actionable and precise information to base their decisions on.
Experience trend-following in a more adaptive and efficient manner with the Dodge Trend indicator, a tool designed to help you 'dodge' false exits and stay in line with the overall trend.
TASC 2023.07 Keeping With The Larger Trend█ OVERVIEW
TASC's July 2023 edition of Traders' Tips features an article by Barbara Star titled "Stay On Track With The Supertrend Indicator". The article explores how the supertrend indicator , whether used as a standalone tool or in conjunction with other indicators, can assist traders in aligning with the larger trend. Drawing inspiration from the article, this script enhances the supertrend indicator with additional visual and analytical features, making it easier to analyze the readings and make informed trading decisions.
█ CONCEPTS
Over the past few years, the supertrend indicator has gained significant popularity among traders. Unlike moving averages, it incorporates both price and volatility information, enabling traders to navigate upward or downward trends despite occasional price disruptions.
When using the supertrend indicator, a trader may consider entering a long position when the price surpasses the supertrend line or retraces to it after the initial crossover. Similarly, for short positions, a trader could enter when the price drops below the supertrend line or retests it. Exiting these positions can be triggered by the opposite scenario, such as a price drop below the supertrend line for long positions or a price rise above the supertrend line for short positions. To assist in monitoring the distance between the price and the indicator line, this script introduces the following display features:
Breach levels, representing fractions of the most recent maximum distance.
On-chart signals indicating crossings of the highest and lowest breach levels.
An infobox displaying the average value of the maximum distance.
█ CALCULATIONS
For calculating the supertrend line, this script uses the built-in function ta.supertrend() . Additionally, the script showcases the use of state-of-the-art PineScript® functionality, including methods and tables .
MTF SuperTrends Nexus [DarkWaveAlgo]🧾 Description:
A nexus is a connection, link, or neuronal junction where signals and information are transmitted between different elements.
The MTF SuperTrends Nexus indicator serves as a nexus between MTF SuperTrends by facilitating the visualization of up to eight multi-timeframe SuperTrends, each with its own customizable timeframe, period, factor, and coloring customization. By combining these various SuperTrends, it helps you create a comprehensive view of MTF trend dynamics and cross-timeframe confluence according to the SuperTrend indicator.
It acts as a utility/control center that brings together multiple MTF SuperTrends and allows you to visualize the interactions between them with exceptional ease-of-use and customizability, helping to provide you with valuable insights into potential trend reversals, momentum shifts, and trading opportunities.
💡 Originality and Usefulness:
While there are other multi-timeframe SuperTrend indicators available, MTF SuperTrends Nexus' semi-transparent fills create a compounding opaqueness when SuperTrends from multiple timeframes coalesce - making visual assessment of cross-timeframe confluence extremely easy. We also believe it stands above the rest with its sheer quantity and quality of settings, features, and usability.
✔️ Re-Published to Avoid Misleading Values
This script has been re-published to ensure that it does not use `request.security()` calls using lookahead_on to access future data when referencing SuperTrend calculations from other timeframes. This decreases the likelihood that the indicator will provide deceiving values. This change has been made in accordance with the PineScript documentation: "Using barmerge.lookahead_on at timeframes higher than the chart's without offsetting the `expression` argument like in `close [ ]` will introduce future leak in scripts, as the function will then return the `close` price before it is actually known in the current context" and the Publishing Rule: "Do not use `request.security()` calls using lookahead to access future data". Historical and real-time values may differ when referencing timeframes other than the chart's.
💠 Features:
8 toggleable MTF SuperTrends with customizable timeframes, periods, and factors
Compounding filled areas for easy MTF SuperTrend confluence analysis
Aesthetic and flexible coloring and color theme styling options
End-of chart labels and options for ease-of-use and legibility
⚙️ Settings:
Use a Color Theme: When this setting is enabled, all manual 'Bullish and Bearish Colors' are overridden. All plots will use the colors from your selected Color Theme - excepting those plots set to use the 'Single Color' coloring method.
Color Theme: When 'Use a Color Theme' is enabled, this setting allows you to select the color theme you wish to use.
Fill SuperTrend Areas: When enabled, the area between any MTF SuperTrend and the price bars will be filled with semi-transparent coloring.
Hide SuperTrends on Timeframes Lower Than the Chart: When this setting is enabled, any MTF SuperTrend with a timeframe smaller than that of the chart the indicator is applied to will be hidden from view.
Enable: Show/hide a specific MTF SuperTrend.
Timeframe: Set the timeframe for a specific MTF SuperTrend.
Period: Set the lookback period for a specific MTF SuperTrend.
Factor: Set the multiplier factor used for a specific MTF SuperTrend's calculation.
Bullish Color: When 'Use a Color Theme' is disabled, this will set the 'bullish color' for this specific MTF SuperTrend.
Bearish Color: When 'Use a Color Theme' is disabled, this will set the 'bearish color' for this specific MTF SuperTrend.
Enable Label: When enabled, a label will show at the end of the chart displaying the timeframe, period, factor, and current price value of this specific MTF SuperTrend.
Size: Sets the font size of this specific MTF SuperTrend's label.
Label Offset (in Bars): Sets the distance from the latest bar, in bars, at which this specific MTF SuperTrend's label is displayed.
Show Label Line: When enabled, this specific MTF SuperTrend's label will be accommodated by a dashed line connecting it to its plot.
📈 Chart:
The chart shown in this original publication displays the 5 minute chart on BTCUSDT. Displayed on the chart are 6 MTF SuperTrends: the 5m 50-period/3-factor SuperTrend, 15m 50-period/3-factor SuperTrend, 30m 50-period/3-factor SuperTrend, 1h 50-period/3-factor SuperTrend, 4h 50-period/3-factor SuperTrend, and the 1D 25-period/1.5-factor SuperTrend - offering an exemplary view of how you can easily use these MTF SuperTrends to your advantage in analyzing SuperTrend relationships across multiple timeframes.
AIR Supertrend (Average Interpercentile Range)Supertrend (ST) is a popular stop loss and trend identification script. The simplicity of seeing a clean trend on a chart makes it attractive, yet it is restricted by only allowing the source, length and multiplier to be adjusted, & these tend to have a limited effect on the properties of the identified trend.
There is a wide variety of interesting ST scripts on TradingView that give the user more control, but none to my knowledge, based on measuring the statistical dispersion of Average Interpercentile Range (AIR).
Two more levels of control:
Normally, ATR Average True Range is used to calculate the range in ST. ATR is initially calculated using RMA to smooth out True Range. This script gives the user the option of changing the MA to some more interesting varieties & modifying their parameters.
The default range setting when you load the indicator on a chart will be AIR.
The real strength of the indicator, however, and the reason I am publishing it, is to release AIR. Play round with the percentile range setting. Lowering it will allow you to stay longer in a trade in a volatile market. Raising it will make it tighter.
For comparison, you can switch back the range setting to ATR and load up RMA to see how the original, classic ST plots.
Alerts are included in this version. Alway use a stop loss.
DISCLAIMER: None of this is financial advice.
Credits to these authors, whose hard work inspired parts of this script:
@ KivancOzbilgic - SuperTrend
@ KioseffTrading - Tillson T3 MA
@ cheatcountry - Hann Window Smoothing
@ mutantdog - Interquartile Range function in his 'Blaze' script
Trend hunter strategy - buy & sellThe indicator combines multiple technical indicators and conditions to generate buy and sell signals.
Here's how the indicator works and how to use it:
Strategy Selection:
The indicator provides a dropdown menu to choose the type of strategy. The available options are "Pullback" and "Simple."
Supertrend Settings:
The Supertrend indicator is used to identify the trend direction.
The indicator takes two input parameters:
ATR Length: Specifies the length of the Average True Range (ATR) used in the Supertrend calculation. The default value is 10.
Factor: Specifies the factor used in the Supertrend calculation. The default value is 3.0.
EMA Settings:
The indicator also includes an Exponential Moving Average (EMA) condition.
You can enable or disable the EMA condition using the "Ema Condition On/Off" checkbox.
If enabled, the indicator calculates an EMA based on the close price.
You can specify the length of the EMA using the "Ema Length" input parameter. The default value is 200.
RSI Settings:
The Relative Strength Index (RSI) indicator is used to generate additional conditions.
You can enable or disable the RSI condition using the "Rsi Condition On/Off" checkbox.
If enabled, the indicator calculates the RSI based on the close price.
You can specify the length of the RSI using the "Rsi Length" input parameter. The default value is 14.
Additionally, you can set the overbought and oversold levels for the RSI using the "RSI BUY Level" and "RSI SELL Level" input parameters, respectively. The default value for both is 50.
Final Conditions:
The indicator combines the Supertrend, EMA, and RSI conditions to generate buy and sell signals.
The specific conditions depend on the chosen strategy:
For the "Simple" strategy, the buy condition is when the Supertrend is in an up trend, not in a previous long position, the RSI is above the overbought level, and the close price is above the EMA.
For the "Pullback" strategy, the buy condition is when there is a cross under of the previous low with the Supertrend, the Supertrend is in an up trend, the RSI is above the overbought level, and the close price is above the EMA.
The sell conditions are the opposite of the respective buy conditions.
Backtest Period:
You can specify the start and end dates for the backtesting using the "Start calculations from" and "End calculations" inputs, respectively. The default start date is "2005-01-01" and the default end date is "2045-03-01." (this is work in progress) Still working on the table part, it is a bit tricky.
Trade Direction:
You can choose the trade direction using the "Trade Direction" input parameter. The available options are "Long," "Short," and "Both."
Depending on the selected trade direction, the indicator will generate signals accordingly.
Visual Display:
The indicator plots the Supertrend line on the price chart.
Buy signals are shown as green labels below the price bars.
Sell signals are shown as red labels above the price bars.
Adjust the input parameters according to your preferences, and then apply the indicator to a chart to see the generated signals. Please note that this indicator should be used for educational purposes only and should be thoroughly tested before using it for real trading.
Super Momentum Trend IndicatorThis is a trend momentum indicator that uses some of Ichimoku Cloud's core trading concepts and Supertrend, so before using this indicator, you can first understand Ichimoku Cloud, which is very helpful for understanding this indicator.
There are mainly the following ways to identify trends in Ichimoku Cloud.
1. The price is above or below the Tenkan-sen and the Kijun-sen
2. The Tenkan-sen crosses the Kijun-sen
3. The price breaks or falls below Leading Span B
4. Leading Span A crosses Leading Span B
I converted the above signal into the following expression (see chart):
1. Green dot: the price is above the Tenkan-sen and Kijun-sen
2. Red dot: the price is below Tenkan-sen and the Kijun-sen
3. Orange or blue dot: the price is between Tenkan-sen and Kijun-sen
4. Triangular symbol: the Tenkan-sen crosses the Kijun-sen, and the price continues to stand firmly above or below Kijun-sen by 2 candles (prevent fake moves)
5.B1 signal: the price breaks or falls below Leading Span B
6. B2 signal: Leading Span A crosses Leading Span B (this expresses whether the color of the cloud is green or red in Ichimoku cloud)
The default for this indicator is Ichimoku Cloud turned off so that the charts are simpler, but you can turn it on if you want to check Ichimoku Cloud.
When you use this indicator, you can observe the changes of the dots:
1. The upward trend reverses to a downward trend (see chart)
What you will see is: green dots, orange dots, red dots, unless the price suddenly falls below the Tenkan-sen and the Kijun-sen, then you will see red dots directly without orange dots .
2. The downward trend reverses to an upward trend (see chart)
What you will see is: red dots, blue dots, green dots, unless the price suddenly breaks through the Tenkan-sen and Kijun-sen, then you will see the green dots directly without the blue dots.
The dot is usually the signal on the left-hand side, the triangle is between the left-hand side and the right-hand side, and B1/B2 is the signal on the right-hand side.
I recommend entry trades separately , and using Supertrend to judge the trend. This is why this indicator also adds two Supertrends.
Why not just use the Super Trend indicator?
Because SuperTrend only provides a pure uptrend or downtrend, it does not show the upcoming reversal.
And with the momentum dots added, when you see orange or blue dots, the trend may be about to reverse.
Therefore, this indicator can better capture the changing process of the trend.
What if the momentum dots are not trending as indicated by the SuperTrend indicator?
If the Super Trend shows a downward trend, but you frequently see green and blue dots, it means that the trend is likely to reverse upwards.
On the contrary, if the Super Trend shows an upward trend, but you frequently see red or orange dots, it means that it is likely to reverse downward.
Please remember that when you want to open a position, the trend direction of SuperTrend should be consistent with the direction of the dots momentum and signals. If they are inconsistent, you need more patience to judge the trend direction.
Which signal is most important?
When using these signals, you must remember that the dot belongs to the left-hand side signal, the triangle belongs to the half left-hand side and half right-hand side signal, and B1/B2 is the right-hand side signal. So I think the B1/B2 signal is the most important because of the meaning of B1 It means that the price has broken through the support or resistance of the cloud layer, and the meaning of B2 in Ichimoku Cloud is that the cloud (kumo) has reversed.
I backtested COINBASE:BTCUSDT for several signals of this indicator, and the B2 signal has a higher win rate.
Why two SuperTrends are used?
Because I found that there are many fake moves in the market, using two SuperTrends with different ATR multipliers can effectively identify fake moves.
Most Important Reminder:
The dot display, triangle signal, and B1/B2 signals have a sequential relationship with the timing of their appearance. During the process of trend change, you will definitely see the change of the dot first, then the triangle, and finally B1/B2, this is why I suggest that you should add positions separately.
If the signals on the chart are not displayed in sequence, it means that the trend has not reversed. Then adding positions separately at the beginning can just reduce your loss.
In addition, it is strongly recommended that you must understand the formula of Ichimoku Cloud, otherwise you may misuse this indicator.
How do I use this indicator?
1. I will build positions in batches when I see the triangle, B1, and B2 signals.
2. When you see Supertrend changing trend, or reverse triangle, you can consider ending position.
3. Triangle/B1/B2 and other signals should be in the same direction as Supertrend before entering the market.
4. When you see the green dot, you don’t need to rush to get into the market, you can wait for a triangle signal, because the triangle means that the conversion line (Tenkan-sen) crosses the base line (Kijun-sen), and the price stands firm on the base line (Kijun-sen) two candles above or below
5. If you are not sure why there is a triangle/B1/B2 signal in a certain place, you can open Ichimoku Cloud in settings to confirm for yourself.
========== 中文說明 (Chinese Explanation) ==========
這是一隻趨勢動量指標,使用了部分 Ichimoku Cloud 的核心交易理念與Supertrend,所以在使用這支指標之前,您可以先搞懂 Ichimoku Cloud,對於理解這隻指標很有幫助。
在 Ichimoku Cloud 中主要有以下幾種方式來確定趨勢。
1.價格在轉換線(Tenkan-sen)與 基準線(Kijun-sen)上方或下方
2.轉換線(Tenkan-sen)與 基準線(Kijun-sen)交叉
3.價格突破或跌破 Leading Span B
4. Leading Span A 與 Leading Span B 交叉
我將上述訊號轉換成以下表達方式(看圖):
1.綠點:價格在轉換線(Tenkan-sen)與 基準線(Kijun-sen)之上
2.紅點:價格在轉換線(Tenkan-sen)與 基準線(Kijun-sen)之下
3.橘點或藍點:價格在轉換線(Tenkan-sen)與 基準線(Kijun-sen)之間
4.三角形符號:轉換線(Tenkan-sen)與 基準線(Kijun-sen)交叉,並且價格持續站穩 Kijun-sen 兩根K線(防止假突破)
5.B1 訊號:價格突破或跌破 Leading Span B
6.B2 訊號:Leading Span A 與 Leading Span B 交叉(這表達為雲的顏色是綠色還是紅色)
這隻指標的預設 Ichimoku Cloud 是關閉的,這樣圖表會更簡單,但如果你想檢查 Ichimoku Cloud ,可以隨時打開。
在你使用這支指標時,可以觀察圓點的變化:
1、向上趨勢反轉成向下趨勢(看圖)
你會看到的點順序是:綠點、橘點、紅點,除非價格突然跌破轉換線(Tenkan-sen)與 基準線(Kijun-sen),這時會直接看到紅點而沒有橘點。
2、向下趨勢反轉成向上趨勢(看圖)
你會看到的點順序是:紅點、藍點、綠點,除非價格突然突破轉換線(Tenkan-sen)與 基準線(Kijun-sen),這時會直接看到綠點而沒有藍點。
圓點通常是左側訊號,三角形介於左側與右側之間,而B1/B2則是右側訊號,我建議將倉位根據訊號顯示的前後順序分批下單,並且搭配 Supertrend來判斷趨勢,這也是為什麼這隻指標還加上了兩條 Supertrend 的原因。
為什麼不單純使用 Super Trend 指標?
因為 SuperTrend 只提供了單純的向上趨勢或向下趨勢,而不會顯示即將到來的反轉。
而加上動量圓點之後,當你看見橘點或藍點時,代表趨勢可能即將反轉。
因此這隻指標更能捕捉到趨勢的變化過程。
如果動量圓點跟 SuperTrend 指標顯示的趨勢不一樣怎麼辦?
如果 Super Trend 顯示向下趨勢,而你卻頻繁看到綠點跟藍點,代表趨勢很可能會向上反轉。
相反的,如果 Super Trend 顯示向上趨勢,而你卻頻繁看到紅點或橘點,代表很可能要向下反轉。
請記得,當你要建立倉位時,SuperTrend 的趨勢方向應該跟原點動量的方向是一致的,如果這兩個方向不一致,你需要更多的耐心來判別趨勢方向。
哪個訊號最重要?
使用這些訊號時必須記得,圓點屬於左側訊號,三角形屬於半左側半右側訊號,而B1/B2則是右側訊號,真的要我說的話,我認為B1/B2訊號最重要,因為B1的意義代表價格突破了雲層支撐或阻力,而B2在 Ichimoku Cloud 裡面的意義是雲朵(kumo)發生了反轉。
我針對這隻指標的幾個訊號對COINBASE:BTCUSDT進行了回測,B2訊號有較高的勝率。
為什麼使用了兩條 SuperTrend ?
因為我發現在市場經常會產生假突破,使用兩條 SuperTrend 並設置不同的 ATR 乘數,可以有效識別假突破。
最重要的提醒:
圓點的顯示、三角形訊號、B1/B2 這幾種訊號,它們出現的時間點是有順序關係的,趨勢轉變的過程,你一定會先看見圓點的變化,然後是出現三角形,最後出現B1/B2,這也是為什麼我建議你應該分批下單,如果圖表上的訊號沒有按照順序先後顯示,表示趨勢並沒有反轉,那麼一開始的分批下單,剛好可以降低你的虧損。
另外強烈建議,務必搞懂 Ichimoku Cloud 的公式,否則你可能會誤用這個指標。
我是如何使用這隻指標?
1.我會在看見三角形、B1、B2訊號時,分批建倉。
2.當你看到Supertrend改變趨勢,或是反向三角形時,可以考慮賣出。
3.三角形/B1/B2等訊號應該跟Supertrend是同一個方向時才可以進場。
4.當你看見綠點時,可以不用著急做多,可以再等一個三角形的訊號,因為三角形表示轉換線(Tenkan-sen)與 基準線(Kijun-sen)交叉,並且價格站穩在基準線(Kijun-sen)之上或之下兩天
5.如果你不確定某個地方為什麼會有三角形/B1/B2訊號,可以打在設定中打開Ichimoku Cloud自行確認。
BB Squeeze + SuperTrend + Keltner ChannelBollinger Bands and Keltner Channel are two of my favorite channels. When you use them correctly, they can bring great help to your trading.
I like to use Bollinger Bands and Keltner Channels to identify when you can trade and when you can not trade, which is also known as the "squeeze".
When the opening of the Bollinger Bands is very small, it is a range that you can enter a trade, the range is called "Squeeze Zone" or "Trade zone".
When the opening of the Bollinger Bands is very large, it is a range that you cannot enter a trade, because the market fluctuates big when BB's opening is large.
I use two ways to identify when the Bollinger Bands's opening is very small or large, one is the Bollinger Bands entering Keltner Bands and one is using specific ATR ranges,. The first one allows you to identify when the market is squeezing and the second one allows you to identify when the market has entered Squeeze zone, that is, the market is already in a trading range suitable for entering a trade.(see chart.)
When the market is squeezed and you enter the trade, you can also use ATR as the stop loss price of the trade, I recommend using 2 ATR as your stop loss, and I also display them on the chart (see chart).
In addition, I also added SuperTrend to this indicator. SuperTrend is a very suitable for identifying trends. You can use SuperTrend to help you identify whether to go long or short.
This is how I use this indicator(See chart):
1.Only trade when market is in Squeeze Zone. (Thick yellow line in chart)
2.When entry a trade, use 2 ATR as stop loss. (Label in Chart)
3.Use Super trend to know to go long or short.
4.Keltner Channel helps to know when the market is squeezing. (Thin yellow line in chart.)
======== 中文說明 (Chinese Explanation) ========
Bollinger Bands(布林帶)跟 Keltner Channel(肯特納通道)是我最喜歡的兩個通道,當你正確使用它們時,它們可以替你的交易帶來非常大的幫助。
我喜歡用 Bollinger Bands 跟 Keltner Channel 來識別何時可以交易,何時不能交易,這個又稱做“擠壓操作”。當布林帶的開口很小時,便是可以交易的區間,而當布林帶的開口很大時,對我來說此時就是不可以交易的區間,因為此時市場的波動很大。
我使用兩種方式來識別當布林帶開口很小的時候,一種是布林帶進入肯特納通道,一種則使用特定的ATR範圍,前者可以讓你識別市場正在擠壓,後者則可以識別市場已經進入擠壓區間,也就是市場已經處於適合進入交易的交易區間。
當市場進入擠壓之後,而你也進入了交易,你還可以使用ATR來作為交易的止損價格,我建議使用2個ATR 來當作你的止損,而我也將他們顯示在圖表上了(見圖表)。
另外,我還在這個指標中加入了 SuperTrend(超級趨勢),SuperTrend 是一個非常適合用來辨別趨勢的指標,你可以使用 SuperTrend 來幫助你識別要做多還是做空。
這是我使用該指標的方式(見圖表):
1.僅在市場處於交易區間時進行交易。 (圖中黃色粗線)
2.入場時,使用2個ATR作為止損。 (圖表中的標籤)
3.使用超級趨勢知道做多或做空。
4.Keltner Channel 有助於了解市場何時擠壓。 (圖表中的黃色細線。)
Supertrend - Optimised Exit We created a small script that will allow you to have a quick look into static SL/PT to choose from. This might save you time, replacing the manual search for optimal SL/PT.
We're checking signals of the strategy and computing its performance with a grid of SL/PT selected.
We used SuperTrend signals in this example, but it will be straightforward to integrate your signals.
In addition to total Return, we compute MAX Dd and Profit Factor. Other metrics can be implemented as well.
Thanks to @MUQWISHI for helping code it.
Disclaimer
Please remember that past performance may not indicate future results.
Due to various factors, including changing market conditions, the strategy may no longer perform as well as in historical backtesting.
This post and the script don’t provide any financial advice.
SuperBollingerTrend (Expo)█ Overview
The SuperBollingerTrend indicator is a combination of two popular technical analysis tools, Bollinger Bands, and SuperTrend. By fusing these two indicators, SuperBollingerTrend aims to provide traders with a more comprehensive view of the market, accounting for both volatility and trend direction. By combining trend identification with volatility analysis, the SuperBollingerTrend indicator provides traders with valuable insights into potential trend changes. It recognizes that high volatility levels often accompany stronger price momentum, which can result in the formation of new trends or the continuation of existing ones.
█ How Volatility Impacts Trends
Volatility can impact trends by expanding or contracting them, triggering trend reversals, leading to breakouts, and influencing risk management decisions. Traders need to analyze and monitor volatility levels in conjunction with trend analysis to gain a comprehensive understanding of market dynamics.
█ How to use
Trend Reversals: High volatility can result in more dramatic price fluctuations, which may lead to sharp trend reversals. For example, a sudden increase in volatility can cause a bullish trend to transition into a bearish one, or vice versa, as traders react to significant price swings.
Volatility Breakouts: Volatility can trigger breakouts in trends. Breakouts occur when the price breaks through a significant support or resistance level, indicating a potential shift in the trend. Higher volatility levels can increase the likelihood of breakouts, as they indicate stronger market momentum and increased buying or selling pressure. This indicator triggers when the volatility increases, and if the price is near a key level when the indicator alerts, it might trigger a great trend.
█ Features
Peak Signal Move
The indicator calculates the peak price move for each ZigZag and displays it under each signal. This highlights how much the market moved between the signals.
Average ZigZag Move
All price moves between two signals are stored, and the average or the median is calculated and displayed in a table. This gives traders a great idea of how much the market moves on average between two signals.
Take Profit
The Take Profit line is placed at the average or the median price move and gives traders a great idea of what they can expect in average profit from the latest signals.
-----------------
Disclaimer
The information contained in my Scripts/Indicators/Ideas/Algos/Systems does not constitute financial advice or a solicitation to buy or sell any securities of any type. I will not accept liability for any loss or damage, including without limitation any loss of profit, which may arise directly or indirectly from the use of or reliance on such information.
All investments involve risk, and the past performance of a security, industry, sector, market, financial product, trading strategy, backtest, or individual's trading does not guarantee future results or returns. Investors are fully responsible for any investment decisions they make. Such decisions should be based solely on an evaluation of their financial circumstances, investment objectives, risk tolerance, and liquidity needs.
My Scripts/Indicators/Ideas/Algos/Systems are only for educational purposes!
SuperTrend Long Strategy +TrendFilterThis strategy aims to identify long (buy) opportunities in the market using the SuperTrend indicator. It utilizes the Average True Range (ATR) and a multiplier to determine the dynamic support levels for entering long positions. This presentation will provide an overview of the strategy's components, explain its usage, and highlight that it focuses on long trades.
Components of the Strategy:
1. ATR Period: This input determines the period used for calculating the Average True Range (ATR). A higher value may result in smoother trend lines but may lag behind recent price changes.
2. Source (src): This input determines the price source used for calculations, with "hl2" (the average of high and low prices) set as the default.
3. ATR Multiplier: This input specifies the multiplier applied to the ATR value to determine the distance of the support levels from the source.
4. Change ATR Calculation Method: This input allows toggling between two methods of ATR calculation: the default method using atr() or a simple moving average (SMA) of ATR values (sma(tr, Periods)).
5. Show Buy/Sell Signals: This input enables or disables the display of buy and sell signals on the chart.
6. Highlighter On/Off: This input controls whether highlighting of up and down trends is displayed on the chart.
7. Bar Coloring On/Off: This input determines whether the bars on the chart are colored based on the trend direction.
8. The "SuperTrend Long STRATEGY" has been enhanced by incorporating a trend filter. A moving average is used as the filter to confirm the prevailing trend before executing trades. This addition effectively reduces false signals and improves the strategy's reliability, all while maintaining its original name.
Strategy Logic:
1. The strategy calculates the upper (up) and lower (dn) trend lines based on the ATR value and the chosen multiplier.
2. The trend variable keeps track of the current trend, with 1 indicating an uptrend and -1 indicating a downtrend.
3. Buy and sell signals are generated based on the change in trend direction.
4. The strategy includes an optional highlighting feature that colors the chart background based on the current trend.
5. Additionally, the bar coloring feature colors the bars based on the direction of the last trend change.
Usage:
1. ATR Period and ATR Multiplier can be adjusted based on the desired sensitivity and risk tolerance.
2. Buy and sell signals can be displayed using the Show Buy/Sell Signals input, providing clear indications of entry and exit points.
3. The Highlighter On/Off input allows users to visually identify the prevailing trend by coloring the chart background.
4. The Bar Coloring On/Off input offers a quick visual reference for the most recent trend change.
Long Strategy:
The SuperTrend Long Strategy is specifically designed to identify long (buy) opportunities. It generates buy signals when the current trend changes from a downtrend to an uptrend, indicating a potential entry point for long positions. The strategy aims to capture upward price movements and maximize profits during bullish market conditions.
The SuperTrend Long Strategy provides traders with a systematic approach to identifying long trade opportunities. By leveraging the SuperTrend indicator and dynamic support levels, this strategy aims to generate buy signals in uptrending markets. Traders can customize the inputs and utilize the visual features to adapt the strategy to their specific trading preferences.
The modification adds a trend filter to the "SuperTrend Long STRATEGY" to improve its effectiveness. The trend filter uses a moving average to confirm the prevailing trend before taking trades. This addition helps filter out false signals and enhances the strategy's reliability without changing its name.
SuperTrend with Chebyshev FilterModified Super Trend with Chebyshev Filter
The Modified Super Trend is an innovative take on the classic Super Trend indicator. This advanced version incorporates a Chebyshev filter, which significantly enhances its capabilities by reducing false signals and improving overall signal quality. In this post, we'll dive deep into the Modified Super Trend, exploring its history, the benefits of the Chebyshev filter, and how it effectively addresses the challenges associated with smoothing, delay, and noise.
History of the Super Trend
The Super Trend indicator, developed by Olivier Seban, has been a popular tool among traders since its inception. It helps traders identify market trends and potential entry and exit points. The Super Trend uses average true range (ATR) and a multiplier to create a volatility-based trailing stop, providing traders with a dynamic tool that adapts to changing market conditions. However, the original Super Trend has its limitations, such as the tendency to produce false signals during periods of low volatility or sideways trading.
The Chebyshev Filter
The Chebyshev filter is a powerful mathematical tool that makes an excellent addition to the Super Trend indicator. It effectively addresses the issues of smoothing, delay, and noise associated with traditional moving averages. Chebyshev filters are named after Pafnuty Chebyshev, a renowned Russian mathematician who made significant contributions to the field of approximation theory.
The Chebyshev filter is capable of producing smoother, more responsive moving averages without introducing additional lag. This is possible because the filter minimizes the worst-case error between the ideal and the actual frequency response. There are two types of Chebyshev filters: Type I and Type II. Type I Chebyshev filters are designed to have an equiripple response in the passband, while Type II Chebyshev filters have an equiripple response in the stopband. The Modified Super Trend allows users to choose between these two types based on their preferences.
Overcoming the Challenges
The Modified Super Trend addresses several challenges associated with the original Super Trend:
Smoothing: The Chebyshev filter produces a smoother moving average without introducing additional lag. This feature is particularly beneficial during periods of low volatility or sideways trading, as it reduces the number of false signals.
Delay: The Chebyshev filter helps minimize the delay between price action and the generated signal, allowing traders to make timely decisions based on more accurate information.
Noise Reduction: The Chebyshev filter's ability to minimize the worst-case error between the ideal and actual frequency response reduces the impact of noise on the generated signals. This feature is especially useful when using the true range as an offset for the price, as it helps generate more reliable signals within a reasonable time frame.
The Great Replacement
The Modified Super Trend with Chebyshev filter is an excellent replacement for the original Super Trend indicator. It offers significant improvements in terms of signal quality, responsiveness, and accuracy. By incorporating the Chebyshev filter, the Modified Super Trend effectively reduces the number of false signals during low volatility or sideways trading, making it a more reliable tool for identifying market trends and potential entry and exit points.
In-Depth Guide to the Modified Super Trend Settings
The Modified Super Trend with Chebyshev filter offers a wide range of settings that allow traders to fine-tune the indicator to suit their specific trading styles and objectives. In this section, we will discuss each setting in detail, explaining its purpose and how to use it effectively.
Source
The source setting determines the price data used for calculations. The default setting is hl2, which calculates the average of the high and low prices. You can choose other price data sources such as close, open, or ohlc4 (average of open, high, low, and close prices) based on your preference.
Up Color and Down Color
These settings control the color of the trend line when the market is in an uptrend (up_color) and a downtrend (down_color). You can customize these colors to your liking, making it easier to visually identify the current market trend.
Text Color
This setting controls the color of the text displayed on the chart when using labels to indicate trend changes. You can choose any color that contrasts well with your chart background for better readability.
Mean Length
The mean_length setting determines the length (number of bars) used for the Chebyshev moving average calculation. A shorter length will make the moving average more responsive to price changes, while a longer length will produce a smoother moving average. It is crucial to find the right balance between responsiveness and smoothness, as a too-short length may generate false signals, while a too-long length might produce lagging signals. The default value is 64, but you can experiment with different values to find the optimal setting for your trading strategy.
Mean Ripple
The mean_ripple setting influences the Chebyshev filter's ripple effect in the passband (Type I) or stopband (Type II). The ripple effect represents small oscillations in the frequency response, which can impact the moving average's smoothness. The default value is 0.01, but you can experiment with different values to find the best balance between smoothness and responsiveness.
Chebyshev Type: Type I or Type II
The style setting allows you to choose between Type I and Type II Chebyshev filters. Type I filters have an equiripple response in the passband, while Type II filters have an equiripple response in the stopband. Depending on your preference for smoothness and responsiveness, you can choose the type that best fits your trading style.
ATR Style
The atr_style setting determines the method used for calculating the Average True Range (ATR). By default (false), it uses the traditional high-low range. When set to true, it uses the absolute difference between the open and close prices. You can choose the method that works best for your trading strategy and the market you are trading.
ATR Length
The atr_length setting controls the length (number of bars) used for calculating the ATR. Similar to the mean_length, a shorter length will make the ATR more responsive to price changes, while a longer length will produce a smoother ATR. The default value is 64, but you can experiment with different values to find the optimal setting for your trading strategy.
ATR Ripple
The atr_ripple setting, like the mean_ripple, influences the ripple effect of the Chebyshev filter used in the ATR calculation. The default value is 0.05, but you can experiment with different values to find the best balance between smoothness and responsiveness.
Multiplier
The multiplier setting determines the factor by which the ATR is multiplied before being added
Super Trend Logic and Signal Optimization
The Modified Super Trend with Chebyshev filter is designed to minimize false signals and provide a clear indication of market trends. It does so by using a combination of moving averages, Average True Range (ATR), and a multiplier. In this section, we will discuss the Super Trend's logic, its ability to prevent false signals, and the early warning crosses added to the indicator.
Super Trend Logic
The Super Trend's logic is based on a combination of the Chebyshev moving average and ATR. The Chebyshev moving average is a smooth moving average that effectively filters out market noise, while the ATR is a measure of market volatility.
The Super Trend is calculated by adding or subtracting a multiple of the ATR from the Chebyshev moving average. The multiplier is a user-defined value that determines the distance between the trend line and the price action. A larger multiplier results in a wider channel, reducing the likelihood of false signals but potentially missing out on valid trend changes.
Preventing False Signals
The Super Trend is designed to minimize false signals by maintaining its trend direction until a significant change in the market occurs. In a downtrend, the trend line will only decrease in value, and in an uptrend, it will only increase. This helps prevent false signals caused by temporary price fluctuations or market noise.
When the price crosses the trend line, the Super Trend does not immediately change its direction. Instead, it employs a safety logic to ensure that the trend change is genuine. The safety logic checks if the new trend line (calculated using the updated moving average and ATR) is more extreme than the previous one. If it is, the trend line is updated; otherwise, the previous trend line is maintained. This mechanism further reduces the likelihood of false signals by ensuring that the trend line only changes when there is a significant shift in the market.
Early Warning Crosses
To provide traders with additional insight, the Modified Super Trend with Chebyshev filter includes early warning crosses. These crosses are plotted on the chart when the price crosses the trend line without the safety logic. Although these crosses do not necessarily indicate a trend change, they can serve as a valuable heads-up for traders to monitor the market closely and prepare for potential trend reversals.
In conclusion, the Modified Super Trend with Chebyshev filter offers a significant improvement over the original Super Trend indicator. By incorporating the Chebyshev filter, this modified version effectively addresses the challenges of smoothing, delay, and noise reduction while minimizing false signals. The wide range of customizable settings allows traders to tailor the indicator to their specific needs, while the inclusion of early warning crosses provides valuable insight into potential trend reversals.
Ultimately, the Modified Super Trend with Chebyshev filter is an excellent tool for traders looking to enhance their trend identification and decision-making abilities. With its advanced features, this indicator can help traders navigate volatile markets with confidence, making more informed decisions based on accurate, timely information.
Double Supertrend Entry with ADX Filter and ATR Exits/EntriesThe Double Supertrend Entry with ADX Filter and ATR Exits/Entries indicator is a custom trading strategy designed to help traders identify potential buy and sell signals in trending markets. This indicator combines the strengths of multiple technical analysis tools, enhancing the effectiveness of the overall strategy.
Key features:
Two Supertrend Indicators - The indicator includes two Supertrend indicators with customizable parameters. These trend-following indicators calculate upper and lower trendlines based on the ATR and price. Buy signals are generated when the price crosses above both trendlines, and sell signals are generated when the price crosses below both trendlines.
ADX Filter - The Average Directional Index (ADX) is used to filter out weak trends and only generate buy/sell signals when the market exhibits a strong trend. The ADX measures the strength of the trend, and a customizable threshold level ensures that trades are only entered during strong trends.
ATR-based Exits and Entries - The indicator uses the Average True Range (ATR) to set profit target and stop-loss levels. ATR is a measure of market volatility, and these levels help traders determine when to exit a trade to secure profit or minimize loss.
Performance Statistics Table - A table is displayed on the chart, recording and showing the total number of winning trades, losing trades, percentage of profitable trades, average profit, and average loss. This information helps traders evaluate the performance of the strategy over time.
The Double Supertrend Entry with ADX Filter and ATR Exits/Entries indicator is a powerful trend-following strategy that can assist traders in making more informed decisions in the financial markets. By combining multiple technical analysis tools and providing performance statistics, this indicator helps traders improve their trading strategy and evaluate its success.
Kitchen [ilovealgotrading]
OVERVIEW:
Kitchen is a strategy that aims to trade in the direction of the trend by using supertrend and stochRsi data by calculating at different time values.
IMPLEMENTATION DETAILS – SETTINGS:
First of all, let's understand the supertrend and stocrsi indicators.
How do you read and use Super Trend for trading ?
The price is often going upwards when it breaks the super trend line while keeping its position above the indication level.
When the market is in a bullish trend, the indicator becomes green. The indicator level will act as trendline support in such a scenario. The color of the indicator changes to red to indicate a negative trend once the price crosses the support line. The price uses the super trend level as a trendline resistance during a bearish move.
In our strategy, if our 1-hour and 4-hour supertrend lines show the up or down train in the same direction at the same time, we can assume that a train is forming here.
Why do I use the time of 1 hour and 4 hours ?
When I did a backtest from the past to the present, I discovered that the most accurate and consistent time zones are the 1 hour and 4 hour time zones.
By the way we can change our short term timeframe(1H) and long term timeframe(4H) from settings panel.
How do you read and use the Stoch-RSI Indicator?
This indicator analyzes price dynamics automatically to detect overbought and oversold locations.
The indicator includes:
- The primary line, which typically has values between 0 and 100;
- Two dynamic levels for overbought and oversold conditions.
IF our stoch-rsi indicator value has fallen below our lower boundary line, the oversold event has been observed in the price, if our stoch-rsi value breaks up our bottom line after becoming oversold, we think that the price will start the recovery phase.(The case is also true for the opposite.)
However, this does not always apply and we need additional approvals, Therefore, our 1H and 4H supertrrend indicator provides us with additional confirmation.
Buy Condition:
Our 1H(short term) and 4H(long term) supertrrend indicator, has given the buy signal(green line and yellow line), and if our stochrsi indicator has broken our oversold line up on the past 15 bars, the buy signal is formed here.
Sell Condition:
Our 1H(short term) and 4H(long term) supertrrend indicator, has given the sell signal(red line and orange line), and if our stochrsi indicator has broken our overbuy line down on the past 15 bars, the sell signal is formed here.
Stop Loss or Take Profit Conditions:
Exit Long Senerio:
All conditions are completed, the buy signal has arrived and we have entered a LONG trade, the 1-hour supertrend line follows the price rise(yellow line), if the price breaks below the 1-hour super trend line and a sell condition occurs for 1H timeframe for supertrend indcator, LONG trade will exit here.
Exit Short Senerio:
All conditions are completed, the Sell signal has arrived and we have entered a SHORT trade, the 1-hour supertrend line follows the price down(orange line), if the price breaks up the 1-hour super trend line and a buy condition occurs for 1H timeframe for supertrend indcator, SHORT trade will exit here.
What can you change in the settings panel?
1-We can set Start and End date for backtest and future alarms
2-We can set ATR length and Factor for supertrend indicator
3-We can set our short term and long term timeframe value
4-We can set StochRsi Up and Low limit to confirm buy and sell conditions
5-We can set stochrsi retroactive approval length
6-We can set stochrsi values or the length
7-We can set Dollar cost for per position
8- We can choose the direction of our positions, we can set only LONG, only SHORT or both directions.
9-IF you want to place automatic buy and sell orders with this strategy, you can paste your codes into the Long open-close or Short open-close message sections.
For example
IF you write your alert window this code {{strategy.order.alert_message}}.
When trigger Long signal you will get dynamically what you pasted here for Long Open Message
ALSO:
Please do not open trades without properly managing your risk and psychology!!!
If you have any ideas what to add to my work to add more sources or make calculations cooler, suggest in DM .
Reversal PointsHi , in this script i tried to find reversal points on big trends. For this purpose i have used Supertrend and Donchian channels. I combined both in a single indicator for finding reversal points. I am suggesting for using higher time frames like 4 hours or 1 day. It will be work in lower time frames too. But the signals will be less reliable than higher timeframes. Here is settings in this script:
New low sensitiity : this setting for donchian channels lookback. Bigger value result as less signals.
Atr Period: Period for Atr , it is for supertrend indicator in it.
Source: Source for supertrend indicator.
Atr Multiplier : Atr multiplier setting for Supertrend. Bigger value will be result as less signals.
Good luck.
Enes.
Supertrend ANY INDICATOR (RSI, MFI, CCI, etc.) + Range FilterThis indicator will generate a supertrend of your chosen configuration on any of the following indicators:
RSI
MFI
Accum/Dist
Momentum
On Balance Volume
CCI
There is also a RANGE FILTER built into the scripts so that you can smooth the indicators for the supertrend. This is an optional configuration in the settings. Also, you can change the oversold/overbought bounds in the settings (they are removed entirely for indicators without bounds).
If you find this indicator useful, please boost it and follow! I am open to suggestions for adding new indicators to this script, it's very simple to add new ones, just suggest them in the comments.
High/Low SupertrendThe High/Low supertrend uses an ATR produced from the highest and lowest points within the ATR lookback range, instead of from current highs and lows. This makes it less susceptible to false breakout attempts.
In the settings, you can choose whether you want the supertrend to calculate from the highest highs and lowest lows within the period, or the maxima of the opens and closes.
USAGE: I recommend using this supertrend as the arming mechanism to the buy or sell, instead of the trigger itself. This is because in ranging markets the supertrend will flip on the current high or current low.
Supertrend Mean Reversion Index [HODLER]This indicator was created primarily as an experiment. While the supertrend can be powerful, in many cases, the trend has already started before the time it's identified, resulting in a price decrease. After conducting my own research, I discovered that the reversal point is often more nearby during the downtrend, rather than at the beginning of the uptrend. Surprisingly, this point is always based on the average percentage below or above the supertrend. The indicator calculates these averages, usually starting below the uptrend point, and in most cases, the trend continues upward from there.
This indicator can be very useful for checking corrections. For example, setting the percentages manually to around 50-60% on BTC 1d, I am impressed by how accurate the indication is. Although there might be other more professional ways to calculate this, I still find it amusing that we can use this indicator to make these calculations as well.
To use the indicator, you will need to set the ATR length and ATR factor, which are self-explanatory. The next settings are the ATR lookback and Percentages Stored. The ATR lookback is the ladder price from which the calculation begins, and Percentages Stored is the maximum number of the highest and lowest percentages from previous data points that are stored to calculate the average percentage.
The supertrend percentage settings can be manually set to adjust your percentage up or down, but if left at 0, it will be calculated automatically based on the above-mentioned settings. You can also set an offset to slightly deviate above or below the average to yield better results. The last supertrend setting is the minimum number of bars that must be considered before checking whether the value is above or below the average.
To filter out some noise, I have added Relative Strength Index (RSI). The values above and below are determined by whether the RSI moving average is above or below certain thresholds.
Please note that this indicator was created for my own research. While it can be very accurate with the right settings, you should always use it in combination with other technical analyses to validate your entry and exit points. If you have any suggestions to improve the indicator, please let me know in the comments. I would really appreciate it!
BankNifty 5min Supertrend Based StrategyBankNifty 5min Supertrend Based Strategy, Intraday.
Work Best at 5mint chart on BankNifty.
The strategy is designed to trade using the Supertrend indicator with session-based rules, and risk management. It allows for customization through input variables and aims to provide a clear visual representation of the Supertrend by changing the color .
The script also includes input variables for the trading session and date range, which allows the trader to specify the time period in which they want the strategy to run. The session variable specifies the start and end times of the trading session, which in this case is set to the Indian trading session from 9:15 am to 3:10 pm.
The strategy starts by defining input variables such as the session time, start and end date for the backtesting, the length of the ATR, and the Supertrend factor. It also includes options for delay at session start and stop loss points and trail percentage .
The code then checks if the current time is within the specified session and date range . If it is, the Supertrend and its direction are calculated using the defined input variables. The strategy then waits for N numbers of candles (defined by the User) to form at the start of every session i.e. 09:15 AM before entering a trade.
The entry and exit conditions for long and short trades are defined based on the change in the Supertrend direction and the number of candles formed at the session start i.e. 09:15 AM . After that, it takes entry and exit for long and short trades on the change in the Supertrend direction . Stop-loss and trailing stop-loss are also defined based on the input variables.
Stop-loss (Defined by the user) is fixed points either below or above the Entry Price for Long and Short entries.
The Supertrend plot is displayed with changing colors depending on the direction. Finally, the strategy closes all trades at the end of the session if there are any open trades.
Overall, this strategy aims to trade with the Supertrend indicator using session-based rules and risk management.
However, as with any trading strategy, it is important to thoroughly test it before using it in live trading .