Options Series - P_SAR And Supertrend
The provided PineScript combines two well-known indicators—Parabolic SAR (P_SAR) and Supertrend—to create a comprehensive trading tool. Here are some powerful insights and the importance of this script:
⭐ 1. Supertrend Indicator:
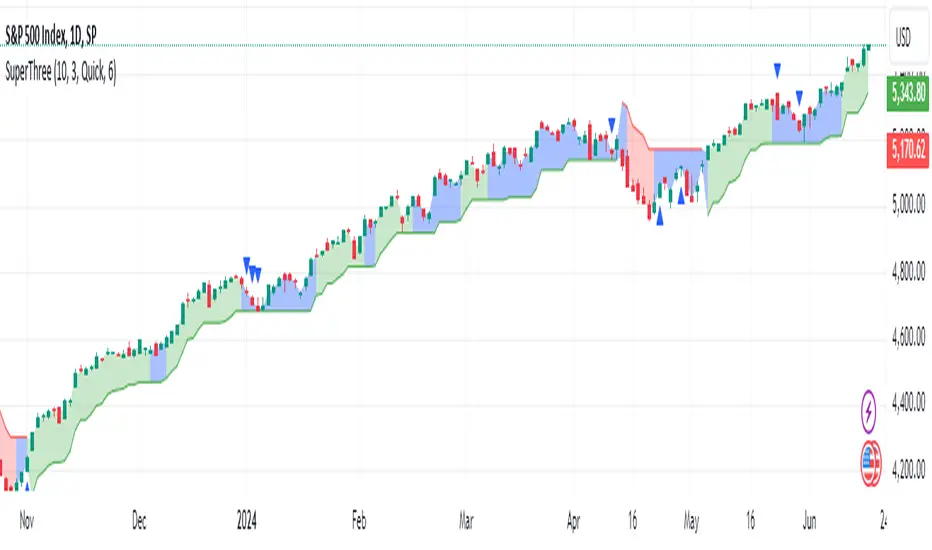
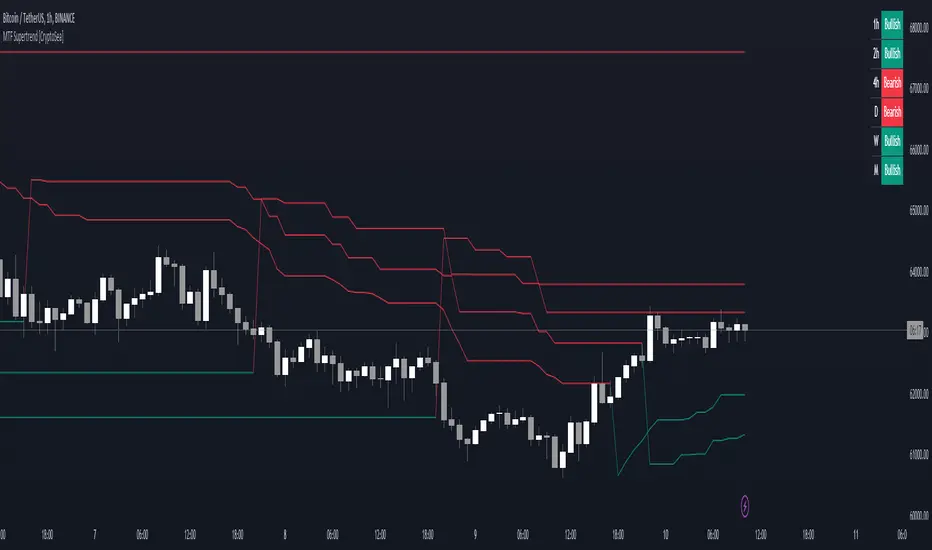
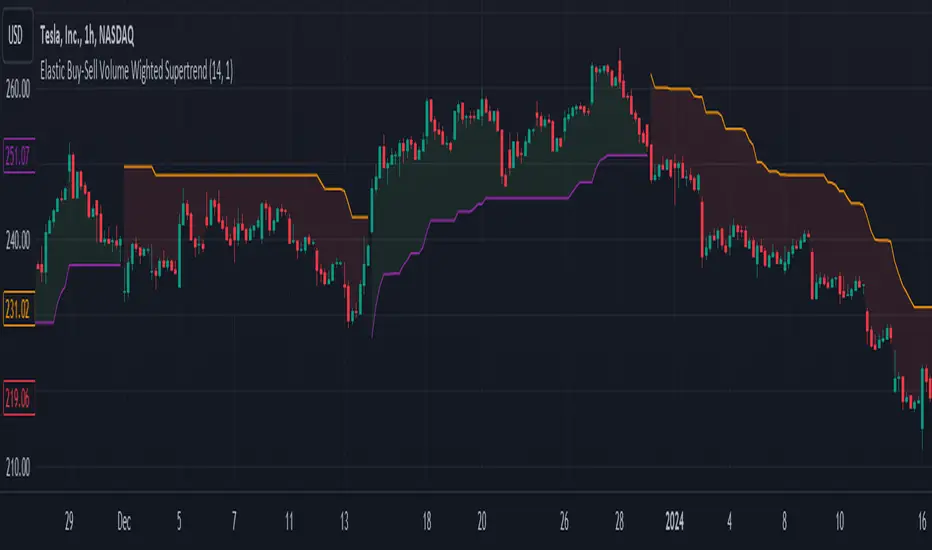
What it does: The Supertrend indicator is based on the Average True Range (ATR) and is used to identify trend direction. When the price is above the Supertrend line, it suggests an uptrend, and when below, a downtrend.
Insights:
Trend Following: By adjusting the ATR length (atrPeriod) and the multiplier (factor), you can fine-tune the sensitivity of the Supertrend. A smaller ATR or factor results in more frequent trend changes, whereas larger values make the indicator more robust but slower to react.
Trend Visualization: The script highlights trends with the help of green and red lines, offering a clear visual cue for traders. The uptrend is filled with a translucent green and the downtrend with red, allowing quick identification of market momentum.
⭐ 2. Parabolic SAR (P_SAR):
What it does: The Parabolic SAR is a time/price-based indicator that helps identify potential reversals in the market. The dots (SAR) follow the price and move closer to it as the trend progresses.
Insights:
Trailing Stops: This is commonly used by traders to trail stop losses, as the SAR moves closer to price as the trend strengthens.
Combining with Supertrend: The SAR dots in this script act as an additional confirmation for trend direction. For instance, when the price is above both the SAR and Supertrend, it strongly suggests an uptrend.
⭐ 3. Bar Coloring Based on Trend Confirmation:
What it does: The script calculates conditions based on whether the price is above or below both the Supertrend and SAR values.
Insights:
Bullish/Bearish Confirmation: The combination of these two indicators provides a stronger confirmation of trend direction compared to using either one alone. For example:
Green Bars: If the price is above both the Supertrend and SAR, it signals a strong uptrend (bullish).
Red Bars: If the price is below both, it suggests a strong downtrend (bearish).
Visual Alerts: The candle colors are adjusted based on these conditions, providing a quick visual alert for traders to take action.
⭐ 4. Importance of Using Both Supertrend and P_SAR:
Multiple Confirmations: Combining the Supertrend and Parabolic SAR increases the accuracy of trend-following strategies. Each indicator has its strengths: Supertrend is good for identifying the overall trend, while the SAR excels at identifying potential reversals.
Risk Management: This script can help you not only identify trends but also manage your positions more effectively. The Parabolic SAR, for example, can serve as a dynamic stop-loss level, while the Supertrend can help you stay in trades longer by smoothing out noise in the market.
⭐ 5. Customizable Inputs:
Adaptability: The user can adjust the ATR period, factor, start, increment, and maximum values, tailoring the script to different market conditions and timeframes. This flexibility is essential, as each asset class or market may require different parameter settings.
⭐ 6. Practical Application in Trading:
Entry and Exit Signals: The script can be used to generate entry and exit signals. For instance:
Buy Signal: When the bar turns green (price is above Supertrend and SAR), it could be a signal to go long.
Sell Signal: When the bar turns red (price is below Supertrend and SAR), it could be a signal to go short or exit a long position.
Stop-Loss Placement: The Parabolic SAR dots can act as trailing stop-loss levels, helping traders lock in profits as trends progress.
Trend Continuation vs. Reversal: The Supertrend provides a broader view of the trend, while the Parabolic SAR provides pinpoint entry/exit signals for reversals.
🚀 Conclusion:
This script is a robust combination of trend-following and reversal indicators, making it a versatile tool for traders. The dual confirmation from Supertrend and Parabolic SAR reduces false signals, and the color-coded bars provide quick insights into market conditions. When used properly, this can greatly improve your ability to catch trends early, exit at the right moment, and manage risk effectively.
Chỉ báo Pine Script®