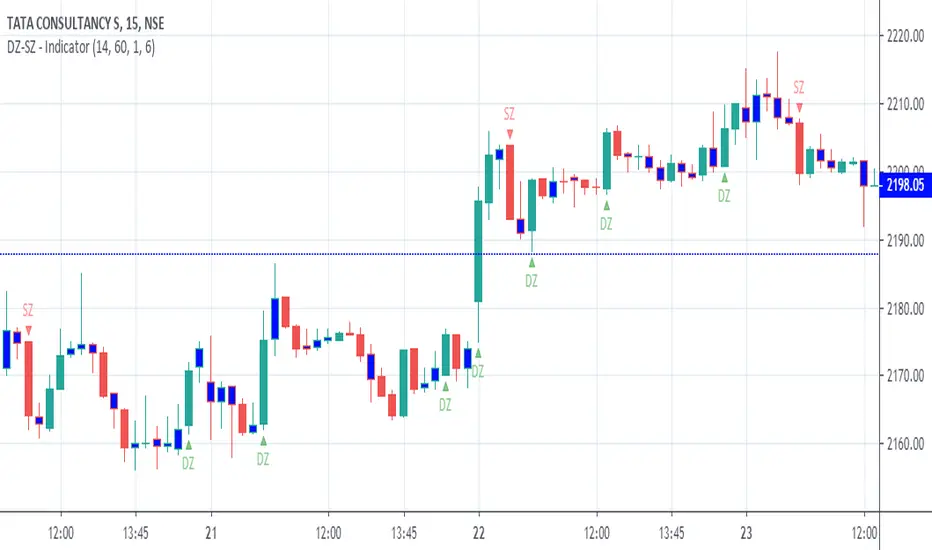
I got a question if it would be possible to Automatically draw S/R levels based on Volume rather than RSI as I had earlier done in this script; Well it certainly is and it looks as though it might even be tradeable. The indicator compares the size of volume bars so that if there is a noticeable increase in volume (noticeable here meaning above the indicator...
First off, a huge thank you to the following people: LEGION: LazyBear: www.tradingview.com xSilas: www.tradingview.com Ni6HTH4awK: www.tradingview.com sco77m4r7and: SNOW_CITY: www.tradingview.com oh92: www.tradingview.com alexgrover: www.tradingview.com cI8DH: www.tradingview.com DonovanWall: www.tradingview.com shtcoinr: www.tradingview.com This is the...
💪 Support / Resistenace 👊 Finder (SRF) dynamically finds support and resistance (supply and demand) levels automatically and weights them accordingly. This is a great tool to use when determining entry/exit upon S/R areas. 💰This indicator is given FREE to all our premium indicator subscribers. 📡SRF calculates the levels working from the current price. So...
Script to visualize 5 EMAS at period 5, 13, 50, 200, 800 for Daily timeframe and also it shows 50% bodycandle. Use it to understand the trend and domand/supply zone.
It tells you to go short or long. If you find the square under go long, if it's above, go short. Make your own multiplier and time frame. As fas as I testing it myself on 1H with 1D resolution, finding no repaint. It will appear and disappear sometimes but once you refresh it, it will be the same. If you find any repainting, change the position and please comment...
Allows 3 time frames, current resolution and two others. Will take the 3rd TF and bring forward one cycle it's history so it can be seen on the chart without scrolling... clearly all elements can be turned off in style.
Support & Resistance Level and Supply & Demand Zone are very common and popular jargon in technical analysis. What is the difference between Support & Resistance Level and Supply & Demand Zone? In my opinion, Support & Resistance Level is the value of price that tested couple times and hard to break. The zone is formed by two adjacent levels where price may...
ZONE BUY STRATEGY In this method look for recent block of black candles and take the before black candle as base handle ,Draw a line forward with the value open and close of the base candle ,When the price falls into this region next in near future execute buy order. Stop loss wont work.
Easy script to find candles which body is less than 50% of candle range.
Dynamic SUPRES can be interpreted in different ways. Each square marks an area of congestion that could serve as support and resistance. FLASH UPDATE: Now is possible to choose the timeframe and the bars color on/off.
Dynamic SUPRES can be interpreted in different ways. Each square marks an area of congestion that could serve as support and resistance.
Relative Volume Indicator ------------------------------ RVI is a support-resistance technical indicator developed by Melvin E. Dickover. Unlike many conventional support and resistance indicators, the Relative Volume Indicator takes into account price-volume behavior in order to detect the supply and demand pools. These pools are marked by "Defended Price...