OCM Quarter Point Autopilot - A Multi-Timeframe Quarter TheoryDescription:
The OCM Quarter Point Autopilot indicator automates the application of Quarters Theory across multiple timeframes and instruments. It creates a comprehensive grid of support and resistance levels based on two user-defined price points (Monthly QTPs).
Key Features:
- Automatically calculates and displays quarter points across 5 timeframes:
• Monthly (Black lines)
• Weekly (Blue lines)
• Daily (Green lines)
• 4-Hour (Red lines)
• 1-Hour (Purple lines)
- Shows both upper and lower ranges, which can be toggled on/off
- Visual hierarchy through color-coding for easy timeframe identification
- Extends lines 2 years into the past and 6 months into the future
Usage:
1. Enter two Monthly Quarter Trading Points (QTPs)
2. The indicator automatically:
- Calculates midpoints (weekly)
- Quarter points (daily)
- Eighth points (4-hour)
- Further subdivisions (1-hour)
Benefits:
- Identifies potential support/resistance levels
- Helps spot key price targets
- Works on any instrument where psychological levels matter
- Provides multiple timeframe analysis in one view
Best suited for traders who:
- Follow multi-timeframe analysis
- Trade using support/resistance levels
- Want to identify potential price targets
- Need structured price levels for entries/exits
The indicator combines the systematic approach of Quarters Theory with automated calculation and visualization, making it easier to identify key price levels across multiple timeframes.
Hỗ trợ và kháng cự

Max The Minner: RSI Bands with Min/Max [by Oberlunar]This Pine Script, titled "Max The Minner: RSI Bands with Min/Max " is a technical indicator designed to visualize RSI-based dynamic bands with local minimum and maximum levels on a chosen timeframe. The script incorporates user-configurable parameters for RSI thresholds, resolution, and color settings, providing traders with a highly customizable tool for analyzing price behavior in relation to overbought and oversold conditions.
Core Functionality
The script begins by calculating the RSI (Relative Strength Index) using user-defined inputs for overbought and oversold levels, the RSI length, and the resolution (default set to daily). The RSI is computed through an exponential moving average (EMA) approach that smooths the upward and downward price movements, creating adaptive upper (ub) and lower (lb) bands based on the overbought and oversold thresholds.
These bands are then dynamically adjusted based on the current price (src) and the EMA calculations. The upper band (ub) represents a potential resistance zone aligned with the RSI overbought level, while the lower band (lb) represents a support zone aligned with the RSI oversold level. The script employs additional calculations to ensure the adaptive nature of these bands, depending on whether the RSI is pushing higher or lower relative to its thresholds.
Local Minima and Maxima
A key feature of the indicator is its ability to track and update local minima and maxima based on the chosen timeframe. The script uses a buffer system that refreshes these levels every three bars to smooth out noise and avoid excessive sensitivity to short-term fluctuations. These local extrema (localMin and localMax) are retrieved from the lower and upper prices of the selected timeframe and act as dynamic benchmarks for evaluating the RSI bands.
Conditional Logic
The script includes conditional logic to determine when the RSI bands intersect with or approach the local maxima or minima. For example:
The upper band (ub) is plotted only if it is below the local maximum, suggesting that price may encounter resistance.
Similarly, the lower band (lb) is plotted only if it is above the local minimum, indicating potential support.
This logic ensures that the bands are contextually relevant to the prevailing market structure, rather than being static overlays.
Visualization
The RSI bands and local extrema are plotted on the chart using color-coded lines, with transparency adjustable through user inputs. The upper band and local maximum are linked with a fill area, visually representing the resistance zone. Similarly, the lower band and local minimum are filled to highlight the support zone. These fills provide a clear depiction of price boundaries, making it easier for traders to spot key levels.
Additionally, the script marks breakout conditions. If the price exceeds the local maximum, a label is plotted at the breakout point with a distinctive style and color. Similarly, a breakout below the local minimum is labeled, providing a visual cue for significant price movements.
Customization
The script offers extensive customization options for both functionality and appearance:
Users can define the overbought and oversold levels for RSI, along with the RSI length and the resolution (timeframe).
Colors for the upper and lower bands, along with transparency (alpha) levels, can be adjusted, allowing for seamless integration with different chart styles.
The periodicity of the local minima and maxima updates is hardcoded to three bars but could be further parameterized for greater flexibility.
This indicator is particularly useful for traders who rely on RSI-based strategies and need a dynamic representation of overbought and oversold conditions in conjunction with local price extremes. By combining RSI bands with the context provided by local minima and maxima, it allows traders to:
Identify potential support and resistance levels.
Visualize price behavior relative to RSI thresholds.
Spot breakout opportunities when price exceeds predefined levels.

Support Resistance Major/Minor [TradingFinder] Market Structure🔵 Introduction
Support and resistance levels are key concepts in technical analysis, serving as critical points where prices pause or reverse due to the interaction of supply and demand. These foundational elements in price action and classical technical analysis assist traders in understanding market behavior and making better trading decisions.
Support levels are zones where demand is strong enough to prevent further price declines, while resistance levels act as barriers that hinder price increases.
Support and resistance levels are divided into two main types: static and dynamic. Static levels are fixed horizontal lines on charts, formed based on historical price points, and are crucial due to repeated price reactions in these areas.
Dynamic levels, on the other hand, move with market trends and are often identified using tools like moving averages and trendlines. These levels are particularly useful for analyzing dynamic trends and identifying potential reversal points in financial markets.
The importance of support and resistance in technical analysis lies in their ability to pinpoint price reversal or continuation points. Professional traders use these levels to determine optimal entry and exit points and combine them with tools such as Fibonacci retracements or moving averages for precise strategies.
Detailed analysis of price behavior at these levels provides insights into trend strength and the likelihood of price breaks or reversals. By understanding these concepts, technical analysts can forecast future price movements and optimize their trading decisions using tools such as indicators and price action. Support and resistance levels, as a cornerstone of technical analysis, form the foundation for many trading strategies.
🔵 How to Use
The Static Support and Resistance Indicator is a vital tool for identifying significant price zones in financial markets. It automatically detects major and minor support and resistance levels in both short-term and long-term intervals, enabling traders to analyze price behavior accurately and develop optimal entry and exit strategies.
🟣 Major Long-Term Support and Resistance
Major Long-Term Support : The lowest price points recorded over long-term intervals that prevent further declines.
Major Long-Term Resistance : The highest price points in long-term intervals that limit further price increases.
🟣 Minor Long-Term Support and Resistance
Minor Long-Term Support : Temporary halts in price decline within a downtrend over long-term intervals.
Minor Long-Term Resistance : Short-term zones within long-term intervals where prices react negatively in an uptrend.
🟣 Major Short-Term Support and Resistance
Major Short-Term Support : The lowest price points in short-term intervals that act as barriers against sharp price drops.
Major Short-Term Resistance : The highest points in short-term intervals that prevent further price surges.
🟣 Minor Short-Term Support and Resistance
Minor Short-Term Support : Temporary halts in price decline within short-term downtrends.
Minor Short-Term Resistance : Zones where price reacts quickly and reverses in short-term uptrends.
🔵 Settings
Long Term S&R Pivot Period : Defines the interval for identifying long-term support and resistance levels (default: 21).
Short Term S&R Pivot Period : Defines the interval for identifying short-term support and resistance levels (default: 5).
🟣 Long-Term Lines
Major Line Display : Enable/disable major long-term lines.
Minor Line Display : Enable/disable minor long-term lines.
Major Line Colors : Green for support, red for resistance (long-term major levels).
Minor Line Colors : Light green for support, light red for resistance (long-term minor levels).
Major Line Style : Choose between solid, dotted, or dashed lines for major long-term levels.
Minor Line Style : Choose between solid, dotted, or dashed lines for minor long-term levels.
Major Line Width : Adjust the thickness of major long-term lines.
Minor Line Width : Adjust the thickness of minor long-term lines.
🟣 Short-Term Lines
Major Line Display : Enable/disable major short-term lines.
Minor Line Display : Enable/disable minor short-term lines.
Major Line Colors : Gray-green for support, gray-red for resistance (short-term major levels).
Minor Line Colors : Dark green for support, dark red for resistance (short-term minor levels).
Major Line Style : Choose between solid, dotted, or dashed lines for major short-term levels.
Minor Line Style : Choose between solid, dotted, or dashed lines for minor short-term levels.
Major Line Width : Adjust the thickness of major short-term lines.
Minor Line Width : Adjust the thickness of minor short-term lines.
🔵 Conclusion
Static support and resistance levels are among the most critical tools in technical analysis, helping traders identify key reversal or continuation points.
This indicator simplifies and enhances the analysis process by automatically detecting major and minor levels in both short-term and long-term intervals. It allows traders to customize settings to suit their trading strategies and analyze different market levels effectively.
Using this indicator improves price action analysis, enhances market understanding, and identifies trading opportunities. Applicable to all trading styles, from day trading to long-term investing, it is an essential tool for technical analysis.
Combining this indicator with other tools like trendlines, Fibonacci retracements, and moving averages enables comprehensive analysis and allows traders to navigate financial markets with greater confidence.

Pre-Market and First 5-Minute LevelsThis will plot the pre-market high an the pre-market low right when market opens after the first five minutes, this will also apply for the first five minute high and five minute low with horizontal rays. Pre-Market levels are blue and 5 minute levels are orange

Premarket and Opening Range (First 30 minutes) LevelsThis indicator is for people who like to utilize the pre-market highs and pre-market Low's as well as the first 30 minutes high and low, or some people like to call the opening range. I hope you find value in this. Note, the levels will only appear after tracking. Premarket levels will happen after pre-market closes. Opening Range levels will show right after the first 30 minutes.
Nimu Market on DemandNimu Market On Demand is an innovative tool designed to provide a visual representation of market demand levels on a scale of 1 to 100. This scale is displayed at specific intervals , making it easy for users to understand market demand fluctuations in real time.
To enhance analysis, Nimu Market On Demand also incorporates the Relative Strength Index (RSI) with key thresholds at . RSI is a widely-used technical indicator that measures market strength and momentum, offering insights into overbought (excessive buying) or oversold (excessive selling) conditions.
The combination of the Demand graph and RSI enables users to:
Identify the right time to buy when the RSI falls below 30, signaling an oversold condition.
Determine the optimal time to sell when the RSI rises above 70, indicating an overbought condition.
With an integrated visualization, users can effortlessly observe demand patterns and combine them with RSI signals to make smarter and more strategic trading decisions. This tool is designed to help traders and investors maximize opportunities in a dynamic market environment.

Profitability Visualization with Bid-Ask Spread ApproximationOverview
The " Profitability Visualization with Bid-Ask Spread Approximation " indicator is designed to assist traders in assessing potential profit and loss targets in relation to the current market price or a simulated entry price. It provides flexibility by allowing users to choose between two methods for calculating the offset from the current price:
Bid-Ask Spread Approximation: The indicator attempts to estimate the bid-ask spread by using the highest (high) and lowest (low) prices within a given period (typically the current bar or a user-defined timeframe) as proxies for the ask and bid prices, respectively. This method provides a dynamic offset that adapts to market volatility.
Percentage Offset: Alternatively, users can specify a fixed percentage offset from the current price. This method offers a consistent offset regardless of market conditions.
Key Features
Dual Offset Calculation Methods: Choose between a dynamic bid-ask spread approximation or a fixed percentage offset to tailor the indicator to your trading style and market analysis.
Entry Price Consideration: The indicator can simulate an entry price at the beginning of each trading session (or the first bar on the chart if no sessions are defined). This feature enables a more realistic visualization of potential profit and loss levels based on a hypothetical entry point.
Profit and Loss Targets: When the entry price consideration is enabled, the indicator plots profit target (green) and loss target (red) lines. These lines represent the price levels at which a trade entered at the simulated entry price would achieve a profit or incur a loss equivalent to the calculated offset amount.
Offset Visualization: Regardless of whether the entry price is considered, the indicator always displays upper (aqua) and lower (fuchsia) offset lines. These lines represent the calculated offset levels based on the chosen method (bid-ask approximation or percentage offset).
Customization: Users can adjust the percentage offset, toggle the bid-ask approximation and entry price consideration, and customize the appearance of the lines through the indicator's settings.
Inputs
useBidAskApproximation A boolean (checkbox) input that determines whether to use the bid-ask spread approximation (true) or the percentage offset (false). Default is false.
percentageOffset A float input that allows users to specify the percentage offset to be used when useBidAskApproximation is false. The default value is 0.63.
considerEntryPrice A boolean input that enables the consideration of a simulated entry price for calculating and displaying profit and loss targets. Default is true.
Calculations
Bid-Ask Approximation (if enabled): bidApprox = request.security(syminfo.tickerid, timeframe.period, low) Approximates the bid price using the lowest price (low) of the current period. askApprox = request.security(syminfo.tickerid, timeframe.period, high) Approximates the ask price using the highest price (high) of the current period. spreadApprox = askApprox - bidApprox Calculates the approximate spread.
Offset Amount: offsetAmount = useBidAskApproximation ? spreadApprox / 2 : close * (percentageOffset / 100) Determines the offset amount based on the selected method. If useBidAskApproximation is true, the offset is half of the approximated spread; otherwise, it's the current closing price (close) multiplied by the percentageOffset.
Entry Price (if enabled): var entryPrice = 0.0 Initializes a variable to store the entry price. if considerEntryPrice Checks if entry price consideration is enabled. if barstate.isnew Checks if the current bar is the first bar of a new session. entryPrice := close Sets the entryPrice to the closing price of the first bar of the session.
Profit and Loss Targets (if entry price is considered): profitTarget = entryPrice + offsetAmount Calculates the profit target price level. lossTarget = entryPrice - offsetAmount Calculates the loss target price level.
Plotting
Profit Target Line: Plotted in green (color.green) with a dashed line style (plot.style_linebr) and increased linewidth (linewidth=2) when considerEntryPrice is true.
Loss Target Line: Plotted in red (color.red) with a dashed line style (plot.style_linebr) and increased linewidth (linewidth=2) when considerEntryPrice is true.
Upper Offset Line: Always plotted in aqua (color.aqua) to show the offset level above the current price.
Lower Offset Line: Always plotted in fuchsia (color.fuchsia) to show the offset level below the current price.
Limitations
Approximation: The bid-ask spread approximation is based on high and low prices and may not perfectly reflect the actual bid-ask spread of a specific broker, especially during periods of high volatility or low liquidity.
Simplified Entry: The entry price simulation is basic and assumes entry at the beginning of each session. It does not account for specific entry signals or order types.
No Order Execution: This indicator is purely for visualization and does not execute any trades.
Data Discrepancies: The high and low values used for approximation might not always align with real-time bid and ask prices due to differences in data aggregation and timing between TradingView and various brokers.
Disclaimer
This indicator is for educational and informational purposes only and should not be considered financial advice. Trading involves substantial risk, and past performance is not indicative of future results. Always conduct thorough research and consider your own risk tolerance before making any trading decisions. It is recommended to combine this indicator with other technical analysis tools and a well-defined trading strategy.

Order Blocks - VK TradingOrder Blocks - VK Trading
This script in Pine Script identifies and highlights Order Blocks, key tools in institutional trading. Designed for traders of all levels, it provides clear and customizable visualization, helping you anticipate market movements with greater accuracy.
Key Features:
Order Block Visualization: Highlights relevant bullish and bearish zones directly on the chart.
Customizable Settings: Adjust sensitivity, colors, and other parameters to suit your analysis needs.
Dual Block Detection: Uses two independent settings to cover different market perspectives.
Visual Alerts: Automatic line drawing for key levels.
Automatic Clearing: Dynamic clearing of already invalidated blocks.
User Benefits:
Clear Visual Analysis: Identifies key supply and demand points used by institutions.
Improved Trading Decisions: Anticipate entry and exit zones more accurately.
Time Saver: Automates level plotting, allowing you to focus on strategy and execution.
Strategy Adaptability: Compatible with Smart Money, Wyckoff, and Price Action approaches.
Disclaimer:
This script is an educational and analytical tool. It does not guarantee specific results or eliminate trading risk. Trading in the financial markets involves significant risks; use this script at your own risk.

OBV Divergence Indicator [TradingFinder] On-Balance Vol Reversal🔵 Introduction
The On-Balance Volume (OBV) indicator, introduced by Joe Granville in 1963, is a powerful technical analysis tool used to measure buying and selling pressure based on trading volume and price.
By aggregating trading volume—adding it on positive days and subtracting it on negative days—OBV creates a cumulative line that reflects market volume pressure, making it valuable for confirming trends, identifying entry and exit points, and forecasting potential price movements.
Divergences between price and OBV often provide significant signals. A bearish divergence occurs when the price forms higher highs while the OBV line forms lower highs. This discrepancy indicates that upward momentum is weakening, increasing the likelihood of a downward trend.
In contrast, a bullish divergence happens when the price makes lower lows, but the OBV line forms higher lows. This suggests increasing buying pressure and the potential for an upward trend reversal.
For instance, if the price is rising but the OBV trendline is falling, it may signal a bearish divergence, warning of a possible price decline. Conversely, if the price is falling while the OBV line is rising, this could signal a bullish divergence, indicating a possible price recovery. These signals are particularly useful for identifying market turning points.
OBV often acts as a leading indicator, moving ahead of price changes. For example, a rising OBV alongside stable or declining prices can signal an impending upward breakout.
Conversely, a declining OBV with rising prices may indicate that the current uptrend is losing strength. Traders using this strategy often consider entering positions at breakout levels while setting stop losses near recent swing highs or lows to manage risk effectively.
This integration highlights how OBV divergences can provide actionable insights for predicting price movements and managing trades efficiently.
Bullish Divergence :
Bearish Divergence :
🔵 How to Use
The OBV indicator, as a cumulative tool, assists analysts in comparing volume and price changes to identify new trends and key levels for entering or exiting trades. Beyond confirming existing trends, it is particularly effective in analyzing positive and negative divergences between price and volume, providing valuable signals for trading decisions.
🟣 Bullish Divergence
A bullish divergence occurs when the price continues its downward or stable trend, but the OBV line starts rising, forming a higher low compared to its previous low. This suggests increasing volume on up days relative to down days and often signals a reversal to the upside.
For instance, if an asset's price stabilizes near a support level but the OBV line shows an upward trend, this divergence could present an opportunity to enter a long position.
🟣 Bearish Divergence
A bearish divergence occurs when the price forms higher highs, but the OBV line declines, creating lower highs compared to previous peaks. This indicates decreasing volume on up days relative to down days and often acts as a warning for a reversal to the downside.
For example, if an asset’s price approaches a resistance level while OBV starts declining, this divergence may signal the beginning of a downtrend and could indicate a good time to exit long trades or enter short positions.
🔵 Setting
Period : The "Period" setting allows you to define the number of bars or intervals for "Periodic" and "EMA" modes. A shorter period captures more short-term movements, while a longer period smooths out the fluctuations and provides a broader view of market trends.
You can enable or disable labels to highlight key levels or divergences and tables to show numerical details like values and divergence types. These options allow for a customized chart display.
🔵 Table
The following table breaks down the main features of the oscillator. It covers four critical categories: Exist, Consecutive, Divergence Quality, and Change Phase Indicator.
Exist : If divergence is detected, a "+" will appear in this row.
Consecutive: Shows the number of consecutive divergences that have formed in a short period.
Divergence Quality : Evaluates the quality of the divergence based on the number of occurrences. One is labeled "Normal," two are "Good," and three or more are considered "Strong."
Change Phase Indicator : If a phase change is detected between two oscillation peaks, this is marked in the table.
🔵 Conclusion
The OBV (On Balance Volume) indicator is a simple yet effective tool in technical analysis that combines volume and price changes to provide a comprehensive view of market buying and selling pressure. By identifying positive and negative divergences, OBV enables analysts to detect early signs of trend reversals and refine their trading strategies.
Divergences in OBV often precede price changes, making it a leading indicator for predicting market movements. Using OBV alongside other technical tools can enhance decision-making accuracy and help traders identify better entry and exit points. However, it is essential to consider the limitations of OBV, such as the potential for signal errors and the impact of sudden news events.
Ultimately, OBV serves as a complementary tool in technical analysis, aiding in trend identification, signal confirmation, and risk management. A thoughtful application of this indicator, in combination with other analytical tools, can create valuable opportunities for profiting in financial markets.

Bitcoin Pi Cycle TrackerThe Bitcoin Pi Cycle Tracker is based on the widely recognized Pi Cycle Top Indicator, a concept used to identify potential market cycle tops in Bitcoin's price. This implementation combines the 111-day Simple Moving Average (SMA) and the 350-day SMA (multiplied by 2) to detect key crossover points. When the 111-day SMA crosses above the 350-day SMA x2, it signals a potential market peak.
Key Features:
Plots the 111-day SMA (blue) and the 350-day SMA x2 (red) for clear visualization.
Displays visual markers and vertical lines at crossover points to highlight key moments.
Sends alerts for crossovers, helping traders stay ahead of market movements.
This tool is an implementation of the Pi Cycle concept originally popularized by Bitcoin market analysts. Use it to analyze historical price cycles and prepare for significant market events. Please note that while the Pi Cycle Indicator has been historically effective, it should be used alongside other tools for a comprehensive trading strategy.

Multi-Timeframe Liquidity LevelsMulti-Timeframe Liquidity Levels – Overview
The Multi-Timeframe Liquidity Levels indicator automatically displays significant highs and lows from various timeframes (Daily, Weekly, Monthly, and Quarterly) on your current chart. This allows traders to quickly identify potential support and resistance zones without frequently switching between different timeframe charts. Additionally, the script offers extra lines for special reference points (e.g., the “Midnight” midpoint of the current day and the previous day’s open/close) to highlight potential liquidity zones even more clearly.
1. Core Idea and Benefits
Time-Saving: Instead of manually reviewing charts in different timeframes, the indicator fetches relevant high/low levels automatically and shows them on your active timeframe.
Clear Layout: Traders instantly see where the Daily, Weekly, Monthly, and Quarterly highs and lows lie—areas often associated with institutional orders or liquidity hunts.
Customizable: You can tailor the color scheme, line style (Solid, Dashed, Dotted), and line width, ensuring the displayed levels fit your personal charting style.
2. How It Works
Multi-Timeframe High/Low
For each timeframe (Day, Week, Month, Quarter), the indicator references the previous candle’s high and low (high , low ).
Using request.security(...), these values are plotted on the chart you’re currently viewing.
Flexible Display
You can individually enable or disable the Daily, Weekly, Monthly, and Quarterly lines, depending on which levels are most relevant to your trading.
With Line Style (Solid, Dashed, Dotted) and Line Width, you can easily emphasize certain lines you consider more important.
Additional Lines
“Midnight” Line: A theoretical midpoint between today’s high and low, which can be useful for gauging daily pivot areas.
Previous Day’s Open/Close: Many traders track these reference points to anticipate market reactions. You can show or hide these lines as desired.
Automatic Line Removal & Creation
When a particular timeframe (e.g., “Show Monthly Levels”) is disabled, the script automatically removes the existing monthly lines.
Enabling it again recreates those lines without hassle.
3. Usage and Interpretation
Identifying Support and Resistance
Highs and lows from higher timeframes are often key zones for entries, exits, or major market reactions.
A Daily level may be crucial for short-term traders, whereas Monthly or Quarterly levels can indicate long-term liquidity areas.
Spotting Market Shifts
If price decisively moves above a Higher-Timeframe line, it could signal strong momentum.
Conversely, a failed breakout (where price quickly returns under or above a level) might warn of a potential reversal.
Extra Lines as Filters
The “Midnight” Line helps visualize a rough central price for the current day, aiding in intraday directional bias.
Previous Day’s Open/Close: Common reference points for day traders, where swift approaches and rejections can indicate potential entries or partial take-profit zones.
4. Practical Tips
Use Color-Coding Wisely: Assign distinct colors (e.g., Blue for Daily, Green for Weekly, Orange for Monthly, Purple for Quarterly) so you can easily discern which timeframe you’re looking at.
Toggle On/Off As Needed: Day traders might focus on Daily and Weekly, while long-term traders may pay closer attention to Monthly and Quarterly.
Combine with Price Action: Lines alone don’t constitute a trading strategy. Use them alongside candlestick patterns, volume analysis, or other indicators for a more complete market perspective.
5. Important Notes & Recommendations
Not Financial Advice: This indicator simply reflects historical high/low data across multiple timeframes and does not constitute a buy or sell recommendation.
Trader Responsibility: Observe how the market actually behaves around these lines and adapt your risk management accordingly.

Intelligent Support & Resistance Lines (MTF)This script automatically detects and updates key Support & Resistance (S/R) levels using a higher timeframe (MTF) approach. By leveraging volume confirmation, levels are only identified when significant volume (relative to the SMA of volume) appears. Each level is drawn horizontally in real time, and whenever the market breaks above a resistance level (and retests it), the script automatically converts that resistance into support. The opposite occurs if the market breaks below a support level.
Key Features:
Multi-Timeframe (MTF) Data
Select a higher timeframe for more robust S/R calculations.
The script fetches High, Low, Volume, and SMA of Volume from the chosen timeframe.
Automatic Role Reversal
Resistance becomes Support if a breakout retest occurs.
Support becomes Resistance if a breakdown retest occurs.
Dynamic Line Width & Labeling
Each S/R line’s thickness increases with additional touches, making frequently tested levels easier to spot.
Labels automatically display the number of touches (e.g., “R 3” or “S 2”) and can have adjustable text size.
Volume Threshold
Only significant pivots (where volume exceeds a specified multiplier of average volume) are plotted, reducing noise.
Horizontal Offset for Clarity
Lines are drawn with timestamps instead of bar_index, ensuring that old levels remain visible without chart limitations.
Adjustable Maximum Levels
Maintain a clean chart by limiting how many S/R lines remain at once.
How It Works:
Pivot Detection: The script identifies swing highs and lows from the higher timeframe (timeframeSR).
Volume Check: Only pivots with volume ≥ (SMA Volume * volumeThreshold) qualify.
Line Creation & Updates: New lines are drawn at these pivots, labeled “R #” or “S #,” indicating how many times they’ve been touched.
Role Reversal: If price breaks above a resistance and retests it from above, that line is removed from the resistance array and re-created in the support array (and vice versa).
Inputs:
Timeframe for S/R: Choose the higher timeframe for S/R calculations.
Swing Length: Number of bars to consider in a pivot calculation.
Minimum Touches: Minimum required touches before drawing or updating a level.
Volume Threshold (Multiplier): Determines how much volume (relative to SMA) is needed to confirm a pivot.
Maximum Number of Levels: Caps how many S/R lines can be shown at once.
Color for Resistance & Color for Support: Customize your preferred colors for lines and labels.
Label Size: Select from "tiny", "small", "normal", "large", or "huge" to resize the labels.
Disclaimer:
This script is intended for educational purposes and should not be interpreted as financial or investment advice. Always conduct your own research or consult a qualified professional before making trading decisions.

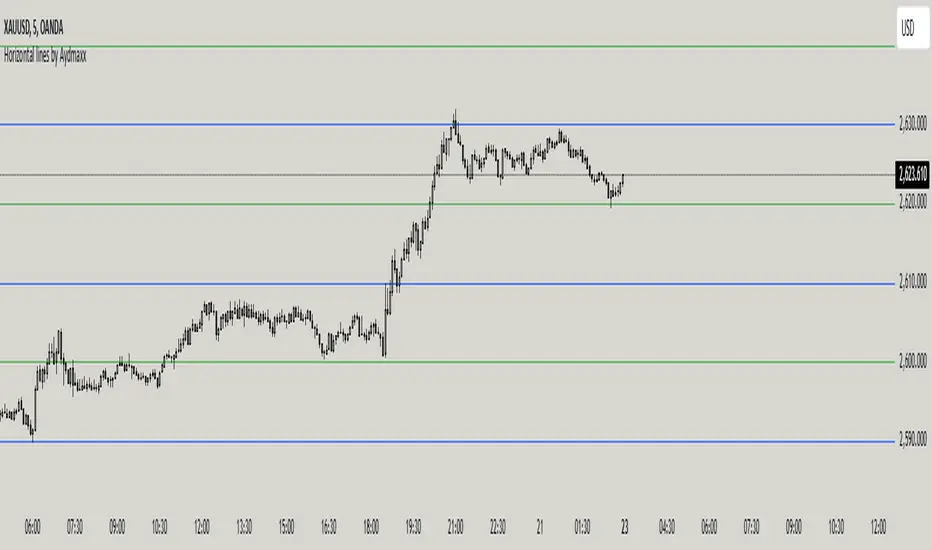
Horizontal lines by AydmaxxIndicator Description: Horizontal Lines by Aydmaxx
This indicator plots customizable horizontal lines on the chart to assist with technical analysis. It allows traders to define a starting price and a step size (gap) between the lines, making it versatile for a variety of strategies, such as identifying support, resistance, or key price levels.
How to Use:
Starting Price (Bottom): Enter the price level where the first (lowest) line should begin. This is your base level.
Example: If you're analyzing a market with prices around 2550, you can set this value to 2550 to align the indicator with your focus.
Gap (Step Size): Specify the interval or step size between consecutive lines.
Example: If you want lines every 10 points, set this value to 10.
Number of Lines: Adjust the total number of lines to display on the chart.
Line Style and Width: Customize the appearance of the lines (solid, dashed, dotted) and their thickness.
Line Colors and Transparency: Choose primary and secondary colors for alternating lines, and adjust the transparency to match your visual preferences.
This indicator is ideal for visualizing price zones and can be tailored to suit any trading style. Adjust the parameters based on your market analysis to highlight key price levels effectively.
Fibonacci Time-Price Zones🟩 Fibonacci Time-Price Zones is a chart visualization tool that combines Fibonacci ratios with time-based and price-based geometry to analyze market behavior. Unlike typical Fibonacci indicators that focus solely on horizontal price levels, this indicator incorporates time into the analysis, providing a more dynamic perspective on price action.
The indicator offers multiple ways to visualize Fibonacci relationships. Drawing segmented circles creates a unique perspective on price action by incorporating time into the analysis. These segmented circles, similar to TradingView's built-in Fibonacci Circles, are derived from Fibonacci time and price levels, allowing traders to identify potential turning points based on the dynamic interaction between price and time.
As another distinct visualization method, the indicator incorporates orthogonal patterns, created by the intersection of horizontal and vertical Fibonacci levels. These intersections form L-shaped connections on the chart, derived from key Fibonacci price and time intervals, highlighting potential areas of support or resistance at specific points in time.
In addition to these geometric approaches, another option is sloped lines, which project Fibonacci levels that account for both time and price along the trendline. These projections derive their angles from the interplay between Fibonacci price levels and Fibonacci time intervals, creating dynamic zones on the chart. The slope of these lines reflects the direction and angle of the trend, providing a visual representation of price alignment with market direction, while maintaining the time-price relationship unique to this indicator
The indicator also includes horizontal Fibonacci levels similar to traditional retracement and extension tools. However, unlike standard tools, traders can display retracement levels, extension levels, or both simultaneously from a single instance of the indicator. These horizontal levels maintain consistency with the chosen visualization method, automatically scaling and adapting whether used with circles, orthogonal patterns, or slope-based analysis.
By combining these distinct methods—circles, orthogonal patterns, sloped projections, and horizontal levels—the indicator provides a comprehensive approach to Fibonacci analysis based on both time and price relationships. Each visualization method offers a unique perspective on market structure while maintaining the core principle of time-price interaction.
⭕ THEORY AND CONCEPT ⭕
While traditional Fibonacci tools excel at identifying potential support and resistance levels through price-based ratios (0.236, 0.382, 0.618), they do not incorporate the dimension of time in market analysis. Extensions and retracements effectively measure price relationships within trends, yet markets move through both price and time dimensions simultaneously.
Fibonacci circles represent an evolution in technical analysis by incorporating time intervals alongside price levels. Based on the mathematical principle that markets often move in circular patterns proportional to Fibonacci ratios, these circles project potential support and resistance zones as partial circles radiating from significant price points. However, traditional circle-based tools can create visual complexity that obscures key market relationships. The integration of time into Fibonacci analysis reveals how price movements often respect both temporal and price-based ratios, suggesting a deeper geometric structure to market behavior.
The Fibonacci Time-Price Zones indicator advances these concepts by providing multiple geometric approaches to visualize time-price relationships. Each shape option—circles, orthogonal patterns, slopes, and horizontal levels—represents a different mathematical perspective on how Fibonacci ratios manifest across both dimensions. This multi-faceted approach allows traders to observe how price responds to Fibonacci-based zones that account for both time and price movements, potentially revealing market structure that purely price-based tools might miss.
Shape Options
The indicator employs four distinct geometric approaches to analyze Fibonacci relationships across time and price dimensions:
Circular : Represents the cyclical nature of market movements through partial circles, where each radius is scaled by Fibonacci ratios incorporating both time and price components. This geometry suggests market movements may follow proportional circular paths from significant pivot points, reflecting the harmonic relationship between time and price.
Orthogonal : Constructs L-shaped patterns that separate the time and price components of Fibonacci relationships. The horizontal component represents price levels, while the vertical component measures time intervals, allowing analysis of how these dimensions interact independently at key market points.
Sloped : Projects Fibonacci levels along the prevailing trend, incorporating both time and price in the angle of projection. This approach suggests that support and resistance levels may maintain their relationship to price while adjusting to the temporal flow of the market.
Horizontal : Provides traditional static Fibonacci levels that serve as a reference point for comparing price-only analysis with the dynamic time-price relationships shown in the other three shapes. This baseline approach allows traders to evaluate how the incorporation of time dimension enhances or modifies traditional Fibonacci analysis.
By combining these geometric approaches, the Fibonacci Time-Price Zones indicator creates a comprehensive analytical framework that bridges traditional and advanced Fibonacci analysis. The horizontal levels serve as familiar reference points, while the dynamic elements—circular, orthogonal, and sloped projections—reveal how price action responds to temporal relationships. This multi-dimensional approach enables traders to study market structure through various geometric lenses, providing deeper insights into time-price symmetry within technical analysis. Whether applied to retracements, extensions, or trend analysis, the indicator offers a structured methodology for understanding how markets move through both price and time dimensions.
🛠️ CONFIGURATION AND SETTINGS 🛠️
The Fibonacci Time-Price Zones indicator offers a range of configurable settings to tailor its functionality and visual representation to your specific analysis needs. These options allow you to customize zone visibility, structures, horizontal lines, and other features.
Important Note: The indicator's calculations are anchored to user-defined start and end points on the chart. When switching between charts with significantly different price scales (e.g., from Bitcoin at $100,000 to Silver at $30), adjustment of these anchor points is required to ensure correct positioning of the Fibonacci elements.
Fibonacci Levels
The indicator allows users to customize Fibonacci levels for both retracement and extension analysis. Each level can be individually configured with the following options:
Visibility : Toggle the visibility of each level to focus on specific areas of interest.
Level Value : Set the Fibonacci ratio for the level, such as 0.618 or 1.000, to align with your analysis needs.
Color : Customize the color of each level for better visual clarity.
Line Thickness : Adjust the line thickness to emphasize critical levels or maintain a cleaner chart.
Setup
Zone Type : Select which Fibonacci zones to display:
- Retracement : Shows potential pull back levels within the trend
- Extension : Projects levels beyond the trend for potential continuation targets
- Both : Displays both retracement and extension zones simultaneously
Shape : Choose from four visualization methods:
- Circular : Time-price based semicircles centered on point B
- Orthogonal : L-shaped patterns combining time and price levels
- Sloped : Trend-aligned projections of Fibonacci levels
- Horizontal : Traditional horizontal Fibonacci levels
Visual Settings
Fill % : Adjusts the fill intensity of zones:
0% : No fill between levels
100% : Maximum fill between levels
Lines :
Trendline : The base A-B trend with customizable color
Extension : B-C projection line
Retracement : B-D pullback line
Labels :
Points : Show/hide A, B, C, D markers
Levels : Show/hide Fibonacci percentages
Time-Price Points
Set the time and price for the points that define the Fibonacci zones and horizontal levels. These points are defined upon loading the chart. These points can be configured directly in the settings or adjusted interactively on the live chart.
A and B Points : These user-defined time and price points determine the basis for calculating the semicircles and Fibonacci levels. While the settings panel displays their exact values for fine-tuning, the easiest way to modify these points is by dragging them directly on the chart for quick adjustments.
Interactive Adjustments : Any changes made to the points on the chart will automatically synchronize with the settings panel, ensuring consistency and precision.
🖼️ CHART EXAMPLES 🖼️
Fibonacci Time-Price Zones using the 'Circular' Shape option. Note the price interaction at the 0.786 level, which acts as a support zone. Additional points of interest include resistance near the 0.618 level and consolidation around the 0.5 level, highlighting the utility of both horizontal and semicircular Fibonacci projections in identifying key price areas.
Fibonacci Time-Price Zones using the 'Sloped' Shape option. The chart displays price retracing along the sloped Fibonacci levels, with blue arrows highlighting potential support zones at 0.618 and 0.786, and a red arrow indicating potential resistance at the 1.0 level. This visual representation aligns with the prevailing downtrend, suggesting potential selling pressure at the 1.0 Fibonacci level.
Fibonacci Time-Price Zones using the 'Orthogonal' Shape option. The chart demonstrates price action interacting with vertical zones created by the orthogonal lines at the 0.618, 0.786, and 1.0 Fibonacci levels. Blue arrows highlight potential support areas, while red arrows indicate potential resistance areas, revealing how the orthogonal lines can identify distinct points of price interaction.
Fibonacci Time-Price Zones using the 'Circular' Shape option. The chart displays price action in relation to segmented circles emanating from the starting point (point A). The circles represent different Fibonacci ratios (0.382, 0.5, 0.618, 0.786) and their intersections with the price axis create potential zones of support and resistance. This approach offers a visually distinct way to analyze potential turning points based on both price and time.
Fibonacci Time-Price Zones using the 'Sloped' Shape option. The sloped Fibonacci levels (0.786, 0.618, 0.5) create zones of potential support and resistance, with price finding clear interaction within these areas. The ellipses highlight this price action, particularly the support between 0.786 and 0.618, which aligns closely with the trend.
Fibonacci Time-Price Zones using the 'Circular' Shape option. The price action appears to be ‘hugging’ the 0.5 Fibonacci level, suggesting potential resistance. This demonstrates how the circular zones can identify potential turning points and areas of consolidation which might not be seen with linear analysis.
Fibonacci Time-Price Zones using the 'Sloped' Shape option with Point D marker enabled. The chart demonstrates clear price action closely following along the sloped Retracement line until the orthogonal intersection at the 0.618 levels where the trend is broken and price dips throughout the 0.618 to 0.786 horizontal zone. Price jumps back to the retracement slope at the start of the 0.786 horizontal zone and continues to the 1.0 horizontal zone. The aqua-colored retracement line is enabled to further emphasize this retracement slope .
Geometric validation using TradingView's built-in Fibonacci Circle tool (overlaid). The alignment at the 0.5 and 1.0 levels demonstrates the indicator's consistent approximation of Fibonacci Circles.
Comparison of Fibonacci Time-Price Zones (Shape: Horizontal) with TradingView's Built-in Retracement and Extension Tools (overlaid): This example demonstrates how the Horizontal structure aligns with TradingView’s retracement and extension levels, allowing users to integrate multiple tools seamlessly. The Fibonacci circle connects retracement and extension zones, highlighting the potential relationship between past retracements and future extensions.
📐 GEOMETRIC FOUNDATIONS 📐
This indicator integrates circular and straight representations of Fibonacci levels, specifically the Circular , Orthogonal , Sloped , and Horizontal shape options. The geometric principles behind these shapes differ significantly, requiring distinct scaling methods for accurate representation. The Circular shape employs logarithmic scaling with radial expansion, where the distance from a central point determines the level's position, creating partial circles that align with TradingView's built-in Fibonacci Circle tool. The other three shapes utilize geometric progression scaling for linear extension from a starting point, resulting in straight lines that align with TradingView's built-in Fibonacci retracement and extension tools. Due to these distinct geometric foundations and scaling methods, perfectly aligning both the partial circles and straight lines simultaneously is mathematically constrained, though any differences are typically visually imperceptible.
The Circular shape's partial circles are calculated and scaled to align with TradingView's built-in Fibonacci Circles. These circles are plotted from the second swing point onward. This approach ensures consistent and accurate visualization across all market types, including those with gaps or closed sessions, which unlike 24/7 markets, do not have a direct one-to-one correspondence between bar indices and time. To maintain accurate geometric proportions across varying chart scales, the indicator calculates an aspect ratio by normalizing the proportional difference between vertical (price) and horizontal (time) distances of the swing points. This normalization factor ensures geometric shapes maintain their mathematical properties regardless of price scale magnitude or time period span, while maintaining the correct proportions of the geometric constructions at any chart zoom level.
The indicator automatically applies the appropriate scaling factor based on the selected shape option, optimizing either circular proportions and proper radius calculations for each Fibonacci level, or straight-line relationships between Fibonacci levels. These distinct scaling approaches maintain mathematical integrity while preserving the essential characteristics of each geometric representation, ensuring optimal visualization accuracy whether using circular or linear shapes.
⚠️ DISCLAIMER ⚠️
The Fibonacci Time-Price Zones indicator is a visual analysis tool designed to illustrate Fibonacci relationships through geometric constructions incorporating both curved and straight lines, providing a structured framework for identifying potential areas of price interaction. It is not intended as a predictive or standalone trading signal indicator.
The indicator calculates levels and projections using user-defined anchor points and Fibonacci ratios. While it aims to align with TradingView’s Fibonacci extension, retracement, and circle tools by employing mathematical and geometric formulas, no guarantee is made that its calculations are identical to TradingView's proprietary methods.
Like all technical and visual indicators, these visual representations may visually align with key price zones in hindsight, reflecting observed price dynamics. However, these visualizations are not standalone signals for trading decisions and should be interpreted as part of a broader analytical approach.
This indicator is intended for educational and analytical purposes, complementing other tools and methods of market analysis. Users are encouraged to integrate it into a comprehensive trading strategy, customizing its settings to suit their specific needs and market conditions.
🧠 BEYOND THE CODE 🧠
The Fibonacci Time-Price Zones indicator is designed to encourage both education and community engagement. By integrating time-sensitive geometry with Fibonacci-based frameworks, it bridges traditional grid-based analysis with dynamic time-price relationships. The inclusion of semicircles, horizontal levels, orthogonal structures, and sloped trends provides users with versatile tools to explore the interaction between price movements and temporal intervals while maintaining clarity and adaptability.
As an open-source tool, the indicator invites exploration, experimentation, and customization. Whether used as a standalone resource or alongside other technical strategies, it serves as a practical and educational framework for understanding market structure and Fibonacci relationships in greater depth.
Your feedback and contributions are essential to refining and enhancing the Fibonacci Time-Price Zones indicator. We look forward to the creative applications, adaptations, and insights this tool inspires within the trading community.

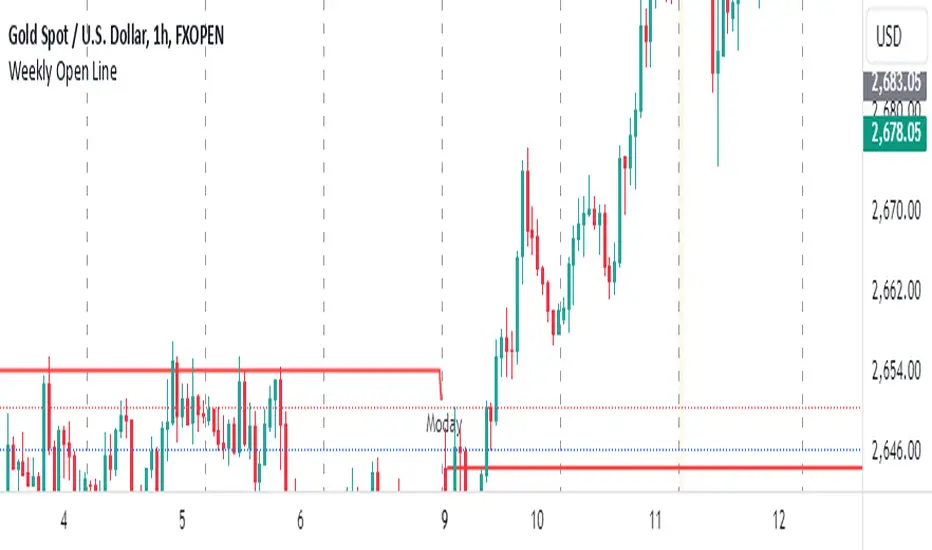
Weekly Open LineThis indicator displays the weekly open price on the chart. It automatically updates every Monday to reflect the opening price of the current week. A dashed line is drawn to indicate the weekly open, and a label stating "Monday" is shown on each Monday for easy identification.
Features:
Automatically calculates the weekly open on Mondays.
Displays a dashed line at the weekly open price.
Labels the weekly open with the text "Monday" for visibility.
Indikator ini menampilkan harga open mingguan di grafik. Indikator ini secara otomatis diperbarui setiap hari Senin untuk mencerminkan harga pembukaan minggu berjalan. Garis putus-putus digambar untuk menunjukkan open mingguan, dan sebuah label yang menyatakan "Moday" ditampilkan setiap hari Senin untuk memudahkan identifikasi.
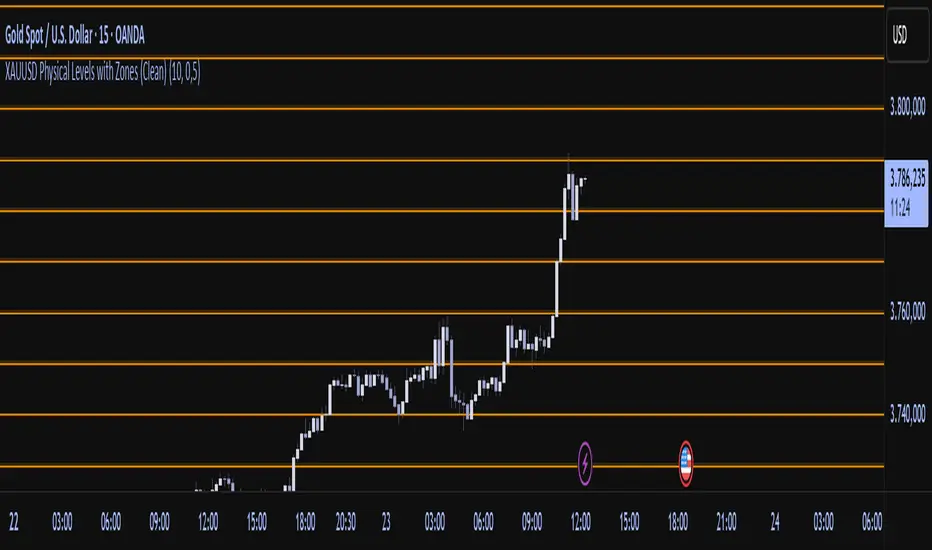
Physical Levels (XAUUSD, 5$ Pricesteps)Functionality:
This indicator draws horizontal lines in the XAUUSD market at a fixed spacing of USD 5. The lines are both above and below the current market price. The number of lines is limited to optimize performance.
Use:
The indicator is particularly useful for traders who want to analyze psychological price levels, support and resistance areas, or significant price zones in the gold market. It helps to better visualize price movements and their proximity to round numbers.
How it works:
The indicator calculates a starting price based on the current price of XAUUSD, rounded to the nearest multiple of USD 5.
Starting from this starting price, evenly distributed lines are drawn up and down.
The lines are black throughout and are updated dynamically according to the current chart.
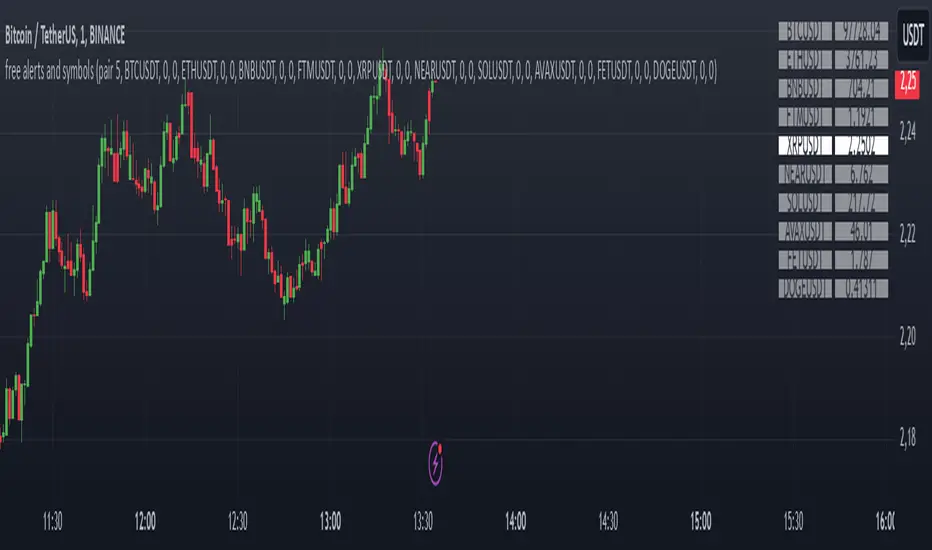
Alerts and symbolswhat is "Alerts and symbols"?
It is an indicator that allows you to watch more trading pairs and add alarms to them.
what it does?
It allows you to set a total of 20 different intersection alarms, 2 in each pair, for 10 different trading pairs at the same time.
It draws the candlestick chart of a pair you choose among 10 trading pairs and the alarm lines you created for this trading pair on the chart.
It also allows you to see the prices of 10 different trading pairs at the same time, thanks to the table it creates.
how to use it?
First, select the alarm pairs you want to use, for example, BTCUSDT pair is the default value for "pair 1". You can choose 10 different trading pairs as you wish. Just below each trading pair, there are two different sections titled "line 1" and "line 2" so that you can set an alarm. Type here the price levels at which you want to be alerted in case of a price crossover.
You can use the "candle source" section to examine the candlestick charts of trading pairs. The indicator draws the candle chart of the trading pair selected in the "candle source" section.
Check the "show alert lines on chart" box to see the levels you have set an alarm for.
When everything is ready, first click on the three dots next to the indicator's name and then on the clock icon. then create an alarm and that's it.
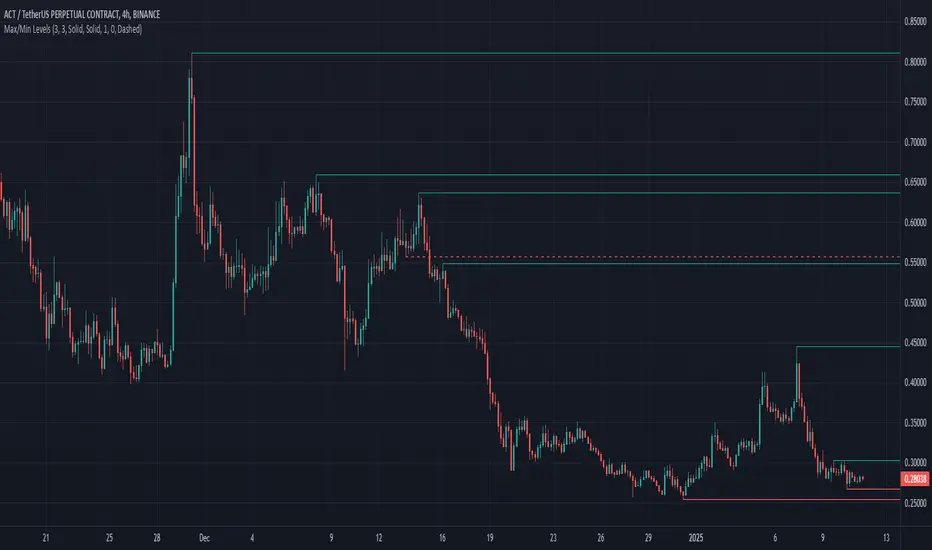
Max/Min LevelsHighlights highs and lows that match the search criteria. A high is considered to be broken if the candlestick breaks through its shadow
A three-candlestick pattern will match the parameters:
Candle before - 1
Candle after - 1
A five-candlestick pattern will match the parameters:
Candle before - 2
Candle after - 2
Auto-Support v 0.3The "Auto-Support v 0.3" indicator is designed to automatically detect and plot multiple levels of support and resistance on a chart. It aims to help traders identify key price levels where the market tends to reverse or consolidate. Here’s a breakdown of its functionality and goals:
Objective:
The primary objective of the Auto-Support v 0.3 indicator is to provide traders with a clear, visual representation of support and resistance levels. These levels are determined based on a predefined sensitivity parameter, which adjusts how tightly or loosely the indicator reacts to recent price movements. The indicator can be applied to any chart to assist in identifying potential entry and exit points for trades, enhancing technical analysis by displaying these important price zones.
Description:
Support and Resistance Calculation:
The indicator calculates multiple levels of support and resistance using the highest and lowest prices over a defined period. The "sensitivity" parameter, which ranges from 1 to 10, determines how sensitive the calculation is to recent price changes. A higher value increases the number of bars used to calculate these levels, making the levels more stable but less responsive to short-term price movements.
Visual Representation:
The support levels are drawn in green with a customizable transparency setting, while resistance levels are displayed in red with similar transparency controls. This visual representation helps traders identify these levels on the chart and see the strength or weakness of the support/resistance zones depending on the transparency setting.
Multiple Levels:
The indicator plots 10 distinct levels of support and resistance (from 1 to 10), which can offer a more granular view of price action. Traders can use these levels to assess potential breakout or breakdown points.
Customization:
Sensitivity: The sensitivity input allows traders to adjust how aggressively the indicator reacts to recent price data. This ensures flexibility, enabling the indicator to be tailored to different trading styles and market conditions.
Transparency: The transparency input adjusts the visual opacity of the support and resistance lines, making it easier to overlay the indicator without obscuring other chart elements.
Key Goals:
Dynamic Support/Resistance Identification: Automatically detect and display relevant support and resistance levels based on price history, removing the need for manual chart analysis.
Customizable Sensitivity: Offer a flexible method to adjust how the indicator identifies key levels, allowing it to fit different market conditions.
Clear Visualization: Provide easy-to-read support and resistance levels with customizable colors and transparencies, enhancing visual clarity and decision-making.
Multiple Levels: Display up to 10 levels of support and resistance, allowing traders to consider both short-term and longer-term price action when making trading decisions.
By using this indicator, traders can more effectively identify key price zones where price may reverse, consolidate, or break out, providing a solid foundation for developing trading strategies.

Combined Zero Lag EMA with Crosses | ASHGCombined Zero Lag EMA with Crosses
This indicator combines the power of Zero Lag Exponential Moving Averages (EMAs) with the widely used Golden Cross and Death Cross signals. It provides an efficient and precise trend-following tool for traders.
Key Features:
Short and Long Zero Lag EMAs: The indicator uses two Zero Lag EMAs with customizable periods (Short and Long). The short EMA is typically more responsive to price changes, while the long EMA smooths out price data, providing a broader trend perspective.
Golden Cross and Death Cross signals: The Golden Cross occurs when the short EMA crosses above the long EMA, indicating a potential bullish trend. The Death Cross occurs when the short EMA crosses below the long EMA, signaling a possible bearish trend.
Combined Zero Lag EMA: The average of the Short and Long Zero Lag EMAs gives a balanced view of the market's overall direction.
Plotting and Alerts: The indicator plots both the short and long Zero Lag EMAs, as well as the combined EMA, with visual cues for Golden and Death Crosses. Alerts can be set for when these crosses occur.
Use this indicator for clearer entry and exit points, helping you stay ahead of market movements.
This indicator is based on Kıvanç ÖZBİLGİÇ's "Zero Lag EMA v2" indicator.
tr.tradingview.com
Birleştirilmiş Zero Lag EMA ve Cross (Kesişim) Sinyalleri
Bu gösterge, Zero Lag (Sıfır Gecikmeli) Üssel Hareketli Ortalamaların (EMA) gücünü, yaygın olarak kullanılan Golden Cross (Altın Kesişim) ve Death Cross (Ölüm Kesişimi) sinyalleriyle birleştirir. Yatırımcılar için verimli ve hassas bir trend takip aracıdır.
Öne Çıkan Özellikler:
Kısa ve Uzun Zero Lag EMA: Gösterge, özelleştirilebilir periyotlarla iki Zero Lag EMA kullanır (Kısa ve Uzun). Kısa EMA, fiyat değişimlerine daha hızlı tepki verirken, uzun EMA fiyat verilerini düzleştirerek daha geniş bir trend perspektifi sunar.
Golden Cross ve Death Cross sinyalleri: Golden Cross, kısa EMA'nın uzun EMA'yı yukarı doğru kesmesiyle oluşur ve potansiyel bir yükseliş trendine işaret eder. Death Cross ise, kısa EMA'nın uzun EMA'yı aşağı doğru kesmesiyle oluşur ve düşüş trendi sinyali verir.
Birleştirilmiş Zero Lag EMA: Kısa ve uzun Zero Lag EMA'larının ortalaması, piyasanın genel yönünü dengeli bir şekilde gösterir.
Grafik ve Uyarılar: Gösterge, kısa ve uzun Zero Lag EMA'ları ile birleştirilmiş EMA'yı çizerek Golden Cross ve Death Cross sinyalleri için görsel uyarılar sağlar. Bu kesişimler gerçekleştiğinde alarm kurabilirsiniz.
Bu göstergeleri kullanarak, piyasa hareketlerinden önce net giriş ve çıkış noktaları belirleyebilir, böylece daha bilinçli kararlar alabilirsiniz.
Bu indikatör Kıvanç ÖZBİLGİÇ'in "Zero Lag EMA v2" indikatörünü temel alarak hazırlanmıştır.
tr.tradingview.com

Ask-Weighted Averages This indicator provides two price-based reference lines derived from volume dynamics within each bar. Specifically, it calculates a volume-weighted average price using only the portion of trading volume that occurred on the "ask" side, implying more aggressive buying activity. The logic behind this approach is to highlight potential support and resistance levels where buyers have shown greater conviction.
Key Features:
Ask-Weighted Average Prices:
Instead of using the entire trade volume, the lines focus on "ask volume" (volume associated with trades occurring at or near the ask price). This helps to spotlight areas where buyers have been dominant, potentially revealing more meaningful price levels for future market behavior.
Conditional vs. Continuous Lines:
Conditional Line: This line is only plotted if the dollar volume (a rough measure of trade value) exceeds a specified threshold, ensuring that the highlighted level is backed by substantial trading activity.
Continuous Line: A second line is always displayed, providing a running ask-weighted average price reference for additional context, regardless of dollar volume.
Supports Identifying Key Price Zones:
By focusing on where more motivated buyers have been active, the indicator helps traders identify potential inflection points in price, such as areas where the market might find support on pullbacks or resistance during rallies.
Overall, this indicator serves as a specialized tool for traders interested in volume-driven price analysis. It aims to refine the understanding of where buyers are most engaged and how that might shape future price movements.
Risks Associated with Trading:
No indicator can guarantee profitable trades or accurately predict future price movements. Market conditions are inherently unpredictable, and reliance on any single tool or combination of tools carries the risk of financial loss. Traders should practice sound risk management, including the use of stop losses and position sizing, and should not trade with funds they cannot afford to lose. Ultimately, decisions should be guided by a thorough trading plan and possibly supplemented with other forms of market analysis or professional advice.
Risks and Important Considerations:
• Not a Standalone Tool:
• This indicator should not be used in isolation. It is essential to incorporate additional technical analysis tools, fundamental analysis, and market context when making trading decisions.
• Relying solely on this indicator may lead to incomplete assessments of market conditions.
• Market Volatility and False Signals:
• Financial markets can be highly volatile, and indicators based on historical data may not accurately predict future movements.
• The indicator may produce false signals due to sudden market changes, low liquidity, or atypical trading activity.
• Risk Management:
• Always employ robust risk management strategies, including setting stop-loss orders, diversifying your portfolio, and not over-leveraging positions.
• Understand that no indicator guarantees success, and losses are a natural part of trading.
• Emotional Discipline:
• Avoid making impulsive decisions based on indicator signals alone.
• Emotional trading can lead to significant financial losses; maintain discipline and adhere to a well-thought-out trading plan.
• Continuous Learning and Adaptation:
• Stay informed about market news, economic indicators, and global events that may impact trading conditions.
• Continuously evaluate and adjust your trading strategies as market dynamics evolve.
• Consultation with Professionals:
• Consider seeking advice from financial advisors or professional traders to understand better how this indicator can fit into your overall trading strategy.
• Professional guidance can provide personalized insights based on your financial goals and risk tolerance.
Disclaimer:
Trading financial instruments involves substantial risk and may not be suitable for all investors. Past performance is not indicative of future results. This indicator is provided for informational and educational purposes only and should not be considered investment advice. Always conduct your own research and consult with a licensed financial professional before making any trading decisions.
Note: The effectiveness of any technical indicator can vary based on market conditions and individual trading styles. It's crucial to test indicators thoroughly using historical data and possibly paper trading before applying them in live trading scenarios.

WhalenatorThis custom TradingView indicator combines multiple analytic techniques to help identify potential market trends, areas of support and resistance, and zones of heightened trading activity. It incorporates a SuperTrend-like line based on ATR, Keltner Channels for volatility-based price envelopes, and dynamic order blocks derived from significant volume and pivot points. Additionally, it highlights “whale” activities—periods of exceptionally large volume—along with an estimated volume profile level and approximate bid/ask volume distribution. Together, these features aim to offer traders a more comprehensive view of price structure, volatility, and institutional participation.
This custom TradingView indicator integrates multiple trading concepts into a single, visually descriptive tool. Its primary goal is to help traders identify directional bias, volatility levels, significant volume events, and potential support/resistance zones on a price chart. Below are the main components and their functionalities:
SuperTrend-Like Line (Trend Bias):
At the core of the indicator is a trend-following line inspired by the SuperTrend concept, which uses Average True Range (ATR) to adaptively set trailing stop levels. By comparing price to these levels, the line attempts to indicate when the market is in an uptrend (price above the line) or a downtrend (price below the line). The shifting levels can provide a dynamic sense of direction and help traders stay with the predominant trend until it shifts.
Keltner Channels (Volatility and Range):
Keltner Channels, based on an exponential moving average and Average True Range, form volatility-based envelopes around price. They help traders visualize whether price is extended (touching or moving outside the upper/lower band) or trading within a stable range. This can be useful in identifying low-volatility consolidations and high-volatility breakouts.
Dynamic Order Blocks (Approximations of Supply/Demand Zones):
By detecting pivot highs and lows under conditions of significant volume, the indicator approximates "order blocks." Order blocks are areas where institutional buying or selling may have occurred, potentially acting as future support or resistance zones. Although these approximations are not perfect, they offer a visual cue to areas on the chart where price might react strongly if revisited.
Volume Profile Proxy and Whale Detection:
The indicator highlights price levels associated with recent maximum volume activity, providing a rough "volume profile" reference. Such levels often become key points of price interaction.
"Whale" detection logic attempts to identify bars where exceptionally large volume occurs (beyond a defined threshold). By tracking these "whale bars," traders can infer where heavy participation—often from large traders or institutions—may influence market direction or create zones of interest.
Approximate Bid/Ask Volume and Dollar Volume Tracking:
The script estimates whether volume within each bar leans more towards the bid or the ask side, aiming to understand which participant (buyers or sellers) might have been more aggressive. Additionally, it calculates dollar volume (close price multiplied by volume) and provides an average to gauge the relative participation strength over time.
Labeling and Visual Aids:
Dynamic labels display Whale Frequency (the ratio of bars with exceptionally large volume), average dollar volume, and approximate ask/bid volume metrics. This gives traders at-a-glance insights into current market conditions, participation, and sentiment.
Strengths:
Multifaceted Analysis:
By combining trend, volatility, volume, and order block logic in one place, the indicator saves chart space and simplifies the analytical process. Traders gain a holistic view without flipping between multiple separate tools.
Adaptable to Market Conditions:
The use of ATR and Keltner Channels adapts to changing volatility conditions. The SuperTrend-like line helps keep traders aligned with the prevailing trend, avoiding constant whipsaws in choppy markets.
Volume-Based Insights:
Integrating whale detection and a crude volume profile proxy helps traders understand where large players might be interacting. This perspective can highlight critical levels that might not be evident from price action alone.
Convenient Visual Cues and Labels:
The indicator provides quick reference points and textual information about the underlying volume dynamics, making decision-making potentially faster and more informed.
Weaknesses:
Heuristic and Approximate Nature:
Many of the indicator’s features, like the "order blocks," "whale detection," and the approximate bid/ask volume, rely on heuristics and assumptions that may not always be accurate. Without actual Level II data or true volume profiles, the insights are best considered as supplementary, not definitive signals.
Lagging Components:
Indicators that rely on past data, like ATR-based trends or moving averages for Keltner Channels, inherently lag behind price. This can cause delayed signals, particularly in fast-moving markets, potentially missing some early opportunities or late in confirming market reversals.
No Guaranteed Predictive Power:
As with any technical tool, it does not forecast the future with certainty. Strong volume at a certain level or a bullish SuperTrend reading does not guarantee price will continue in that direction. Market conditions can change unexpectedly, and false signals will occur.
Complexity and Overreliance Risk:
With multiple signals combined, there’s a risk of information overload. Traders might feel compelled to rely too heavily on this one tool. Without complementary analysis (fundamentals, news, or additional technical confirmation), overreliance on the indicator could lead to misguided trades.
Conclusion:
This integrated indicator offers a comprehensive visual guide to market structure, volatility, and activity. Its strength lies in providing a multi-dimensional viewpoint in a single tool. However, traders should remain aware of its approximations, inherent lags, and the potential for conflicting signals. Sound risk management, position sizing, and the use of complementary analysis methods remain essential for trading success.
Risks Associated with Trading:
No indicator can guarantee profitable trades or accurately predict future price movements. Market conditions are inherently unpredictable, and reliance on any single tool or combination of tools carries the risk of financial loss. Traders should practice sound risk management, including the use of stop losses and position sizing, and should not trade with funds they cannot afford to lose. Ultimately, decisions should be guided by a thorough trading plan and possibly supplemented with other forms of market analysis or professional advice.
Risks and Important Considerations:
• Not a Standalone Tool:
• This indicator should not be used in isolation. It is essential to incorporate additional technical analysis tools, fundamental analysis, and market context when making trading decisions.
• Relying solely on this indicator may lead to incomplete assessments of market conditions.
• Market Volatility and False Signals:
• Financial markets can be highly volatile, and indicators based on historical data may not accurately predict future movements.
• The indicator may produce false signals due to sudden market changes, low liquidity, or atypical trading activity.
• Risk Management:
• Always employ robust risk management strategies, including setting stop-loss orders, diversifying your portfolio, and not over-leveraging positions.
• Understand that no indicator guarantees success, and losses are a natural part of trading.
• Emotional Discipline:
• Avoid making impulsive decisions based on indicator signals alone.
• Emotional trading can lead to significant financial losses; maintain discipline and adhere to a well-thought-out trading plan.
• Continuous Learning and Adaptation:
• Stay informed about market news, economic indicators, and global events that may impact trading conditions.
• Continuously evaluate and adjust your trading strategies as market dynamics evolve.
• Consultation with Professionals:
• Consider seeking advice from financial advisors or professional traders to understand better how this indicator can fit into your overall trading strategy.
• Professional guidance can provide personalized insights based on your financial goals and risk tolerance.
Disclaimer:
Trading financial instruments involves substantial risk and may not be suitable for all investors. Past performance is not indicative of future results. This indicator is provided for informational and educational purposes only and should not be considered investment advice. Always conduct your own research and consult with a licensed financial professional before making any trading decisions.
Note: The effectiveness of any technical indicator can vary based on market conditions and individual trading styles. It's crucial to test indicators thoroughly using historical data and possibly paper trading before applying them in live trading scenarios.

Fibonacci Snap Tool [TradersPro]
OVERVIEW
The Fibonacci Snap tool automatically snaps to the swing high and swing low of the price data shown on the chart display. Fibonacci retracement levels can be used for entry, exit, or as a confirmation of trend continuation.
If the swing high on the chart comes before the swing low, the price is in a downtrend.If the swing high comes after the swing low, the price is in an uptrend.
We call the 23.60% Fibonacci level the momentum zone of the trend. Price in a solid trend, either up or down, will typically hold the 23.60% Fibonacci level as support (demand) in an uptrend or resistance (supply) in a downtrend.
Deeper Fibonacci levels of 38.20%, 50.00%, and 61.80% are corrective supply/demand zones. As price moves against the found trend, it can move into this range block we call the corrective zone.
Fibonacci retracement levels are used to identify potential supply/demand areas where price could reverse or consolidate. These levels are based on key ratios derived from the Fibonacci sequence, and we only use the core 23.60%, 38.20%, 50.00%, and 61.80% ratios.
CONCEPTS
Price action moves in trend cycles, these retracement levels help traders measure proportional relationships between the high/low swings in the price trend.
When a price trend is moving against the trend, traders can find opportunities to trade with the current trend at key Fibonacci levels. Fibonacci levels can be used to anticipate where price might find supply/demand imbalance and continue moving in the trend direction.
Traders apply the indicator by selecting a window of price they want to analyze in the chart display, and the Fibonacci Snap tool will snap to the high and low of the visible price display.
The Intent and Use of This Tool
The 23.60% level acts as a momentum or continuation of trend. The 38.20% to 61.80% range are corrective zones of the trend.
The 61.80% level, also known as the golden ratio (Google the term “Golden Ratio”; it's fun), can often represent the location of supply/demand imbalance.
In an uptrend, it can represent the area of no more selling supply, and the balance can shift to buying demand. In a downtrend, it can represent the area of no more buying demand and the balance can shift to selling supply.
When used with the Momentum Zones indicator, these two tools create a powerful combination for traders to find, implement, and manage trades.
