Pre-COVID High and COVID LowOverview
The "Pre-COVID High and COVID Low" indicator is designed to identify and mark significant price levels on your chart, specifically targeting the pre-COVID-19 high and the low during the initial COVID-19 market impact. This script is particularly useful for traders who are interested in analyzing how stocks or other financial instruments reacted during the onset of the COVID-19 pandemic, providing a historical perspective that may help in making informed trading decisions.
How It Works
Date Ranges : The script uses predefined date ranges to calculate the highest and lowest price levels before and during the early stages of the COVID-19 pandemic. These ranges are:
Pre-COVID High: Between January 1, 2020, and March 31, 2020.
COVID Low: Between March 1, 2020, and March 31, 2020.
Calculation Method :
The highest price during the pre-COVID period is tracked and recorded as the "Pre-COVID High".
The lowest price during the specified COVID period is tracked and recorded as the "COVID Low".
Visibility Conditions : The script includes logic to ensure that these historical levels are only displayed if they fall within a range close to the current visible price range on the chart. This prevents the indicator from compressing the price scale unduly.
How to Use It
Adding to Your Char t: To use this indicator, add it to any chart on TradingView. It works best with daily time frames to clearly visualize the impact over these specific months.
Interpretation :
The "Pre-COVID High" is marked with a red line and is labeled the first day it becomes applicable.
The "COVID Low" is marked with a green line and is similarly labeled on its applicable day.
Trading Strategy Consideration : Traders can use these historical levels as potential support or resistance zones for their trading strategies. These levels can indicate significant price points where the market previously showed strong reactions.
Hỗ trợ và kháng cự

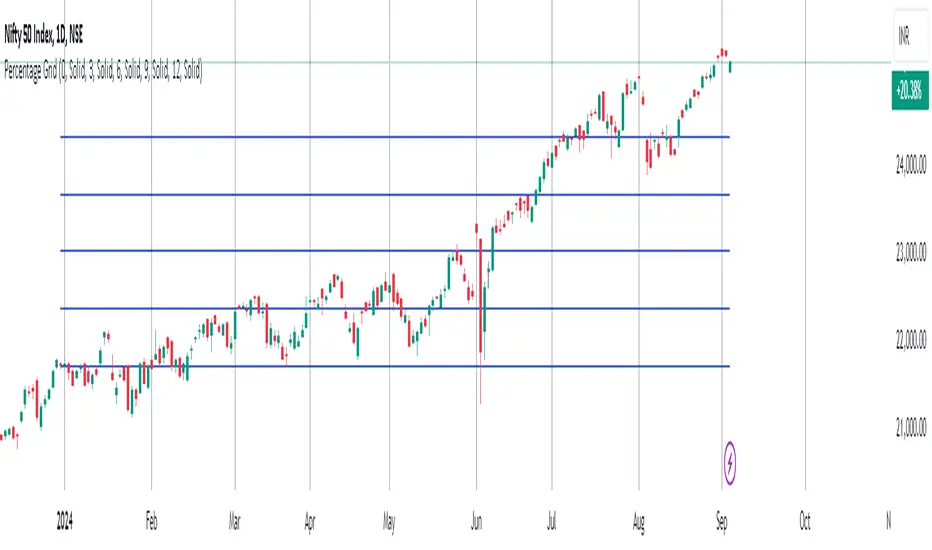
Percentage GridPercentage Grid Indicator
Description:
The Percentage Grid indicator is designed to assist traders in identifying significant support and resistance levels based on yearly percentage changes. This indicator plots horizontal lines on the chart from the start of the year, allowing you to customize how much percentage each line represents. Currently, you can set up to 5 horizontal lines, each representing a different percentage change from the beginning of the year.
For instance, when applied to the SBI Bank stock, you can customize the lines to display various percentage changes from the start of the year, such as 20%, 25%, and up to 35%, as the SBIN stock is currently trading around these levels. This visualization helps traders to easily identify key levels where price action tends to react, providing valuable insights for making trading decisions.
Principles of Trading Technical Analysis:
The Percentage Grid indicator is grounded in the principle of support and resistance levels, which are fundamental concepts in technical analysis. These levels are specific price points on a chart that tend to act as barriers, preventing the price from getting pushed in a certain direction. The indicator helps in:
Identifying Support Levels: Price levels where a downtrend can be expected to pause due to a concentration of buying interest.
Identifying Resistance Levels: Price levels where an uptrend can be expected to pause due to a concentration of selling interest.
By customizing and plotting percentage-based horizontal lines, the indicator highlights these critical levels based on the percentage change from the start of the year.
How to Use:
Add the Indicator to Your Chart:
Search for "Percentage Grid" in the TradingView indicator library and add it to your chart.
Customize Percentage Levels:
Access the indicator settings to customize the percentage change each line represents.
You can set up to 5 different percentage levels. For example, you can set lines at 20%, 25%, 30%, 35%, and 40%.
Interpret the Grid Lines:
The plotted lines will represent the specified percentage changes from the start of the year.
Use these lines to identify potential support and resistance levels where price action is likely to react.
Practical Application:
Look for price bounces or reversals around these levels, which can indicate strong support or resistance.
Combine the Percentage Grid with other technical analysis tools, such as moving averages or trend lines, to confirm potential trading opportunities.
Example:
In the accompanying screenshot, the Percentage Grid is applied to the SBI Bank stock. The lines are set to display 20%, 25%, 30%, 35%, and 40% changes from the start of the year. Notice how the price action respects these levels, providing clear areas where support and resistance are evident.
By incorporating the Percentage Grid into your trading strategy, you can enhance your ability to identify key price levels and make more informed trading decisions.
Happy Trading!
Moving Average Bands with Signals [UAlgo]The "Moving Average Bands with Signals combines various moving average types with ATR-based bands to help traders identify potential support and resistance levels.
It plots moving average bands with upper and lower support/resistance levels based on the Average True Range (ATR) and user-defined settings.Additionally, the script generates buy/sell signals based on price crossing above or below the bands.
🔶 Key Features
Multiple Moving Average Types:
Supports various moving average calculations including Arnaud Legoux Moving Average (ALMA), Exponential Moving Average (EMA), Double Exponential Moving Average (DEMA), Triple Exponential Moving Average (TEMA), Kaufman Adaptive Moving Average (KAMA), Hull Moving Average (HMA), Least Squares Moving Average (LSMA), Simple Moving Average (SMA), Triangular Moving Average (TMA), Volume-Weighted Moving Average (VWMA), Weighted Moving Average (WMA), and Zero-Lag Moving Average (ZLMA).
Customizable ATR Bands:
Integrates the Average True Range (ATR) to calculate dynamic support and resistance bands around the moving average. The multiplier for the bands is user-adjustable, allowing for finer control over the sensitivity and width of the bands.
Signal Generation:
Provides visual signals on the chart when the price interacts with the support or resistance bands. Users can choose between using the wick or the close price to generate these signals, adding an extra layer of customization based on their trading style.
Flexible Input Parameters:
Allows users to input parameters for moving average length, ATR length, band multiplier, and signal type. Additional settings are available for specific moving average types, such as ALMA's offset and sigma, KAMA's fast and slow periods, and LSMA's offset.
🔶 Disclaimer
This script is provided for educational purposes only and should not be considered financial advice.
Trading financial instruments involves substantial risk and can result in significant financial losses.
The script’s performance in the past is not indicative of future results, and no guarantees are made regarding its accuracy, reliability, or performance.

F.B_Volume Weighted Average Price MTFThe F.B_Volume Weighted Average Price MTF (VWAP MTF) indicator calculates the volume-weighted average price of a security across different timeframes. The VWAP is a powerful indicator used by both institutional and retail traders to make better trading decisions.
Functionality:
Timeframe:
The indicator allows you to adjust the timeframe for the VWAP calculation via the settings. By default, the timeframe is set to weekly ("W").
Restart at new timeframe:
At each new period in the chosen timeframe, the VWAP calculations are reset, and a new VWAP is calculated.
VWAP Calculation:
The VWAP is calculated by the volume-weighted average of the typical prices (High, Low, and Close) of the security. This calculation takes into account the volume of each transaction to provide an accurate average price.
Visualization:
The VWAP is displayed as a line on the chart, and the color of the line changes depending on the price position relative to the VWAP:
Green: The current closing price is above the VWAP (bullish signal).
Red: The current closing price is below the VWAP (bearish signal).
Options:
Show barcolors:
This option allows you to display the colors of the candles based on their position relative to the VWAP (green for bullish, red for bearish).
Show previous VWAP close:
This option shows the closing value of the VWAP from the previous period to provide historical reference points.
Interpretation:
Bullish Signal:
If the current price is above the VWAP, this indicates that the market trend is upward, which could be considered a buying opportunity.
Bearish Signal:
If the current price is below the VWAP, this indicates that the market trend is downward, which could be considered a selling signal.

ICT KillZones Hunt [TradingFinder] 4 Sessions + OB + FVG + Alert🔵 Introduction
🟣 ICT
The "ICT" style is a subset of "Price Action" technical analysis. The primary goal of the ICT trading strategy is to merge "Price Action" with the "Smart Money" concept to pinpoint optimal trade entry points.
However, this approach's strength extends beyond merely finding entry points. It also helps traders gain a deeper understanding of price behavior and adapt their trading strategies to the market structure.
The most important concepts of "ICT" :
Order Block
Fair Value Gap(FVG)
Liquidity
🟣 Session
Financial markets are divided into several time periods, each featuring distinct characteristics and levels of activity. These periods, known as sessions, are active at different times during the day.
The primary active sessions in financial markets include :
Asian Session
European Session
New York Session
Based on the UTC time zone, the schedule for these key sessions is :
Asian Session: 23:00 to 06:00
European Session: 07:00 to 16:30
New York Session: 13:00 to 22:00
Note
To avoid session overlap and minimize interference during kill zones, the session times have been modified as follows :
Asian Session: 23:00 to 06:00
European Session: 07:00 to 14:25
New York Session: 14:30 to 22:55
🟣 KillZone
Kill zones are periods within a session where trader activity spikes. During these times, trading volume surges, and price movements become more pronounced.
The major kill zones, according to the UTC time zone, are as follows :
Asian Kill Zone: 23:00 to 03:55
European Kill Zone: 07:00 to 09:55
New York Morning Kill Zone: 14:30 to 16:55
New York Evening Kill Zone: 19:30 to 20:55
🔵 How to Use
🟣 Order Block
Order blocks are a distinct category of "Supply and Demand" zones, formed when a series of orders are grouped together. These blocks are often created by banks or other significant market participants.
Banks typically execute large orders in blocks during their trading sessions. If they were to enter the market with small quantities, substantial price movements would occur before the orders were fully executed, reducing potential profit.
To mitigate this, they divide their orders into smaller, more manageable positions. Traders should seek "buy" opportunities in "demand order blocks" and "sell" opportunities in "supply order blocks."
🟣 Fair Value Gap (FVG)
To pinpoint the "Fair Value Gap" on the chart, meticulous candle-by-candle analysis is essential. Pay close attention to candles with significant bodies, examining each candle alongside the one preceding it.
The candles flanking this central candle should exhibit elongated shadows, with bodies that do not intersect the body of the central candle. The span between the shadows of the first and third candles is referred to as the FVG range.
Note :
The origin of all Order Blocks and FVGs starts from inside a kill zone and extends up to the end of the same session.
🟣 Kill Zone Hunt
Following this strategy, after the conclusion of the kill zone and the stabilization of its high and low lines, if the price touches either of these lines within the same session and encounters a robust rejection, it presents an opportunity to enter a trade.
🔵 Setting
🟣 Global Setting
Show All Order Block :
If it is turned off, only the last Order Block will be displayed.
Show All FVG :
If it is turned off, only the last FVG will be displayed.
Show More Info Session :
If it is turned on, more information about kill zones (Trade Volume, Time, Number of Candles) will be displayed.
🟣 Logic Parameter
Pivot Period of Order Blocks Detector :
Enter the desired pivot period to identify the Order Block.
Order Block Validity Period (Bar) :
You can specify the maximum time the Order Block remains valid based on the number of candles from the origin.
Mitigation Level Order Block :
Determining the basic level of a block order. When the price hits the basic level, the order block due to mitigation.
🟣 Order Blocks Display
Demand Order Block :
Show or not show and specify color.
Supply order Block :
Show or not show and specify color.
🟣 Order Block Refinement
Refine Demand OB :
Enable or disable the refinement feature. Mode selection.
Refine Supply OB :
Enable or disable the refinement feature. Mode selection.
🟣 FVG
FVG Validity Period (Bar) :
You can specify the maximum time the FVG remains valid based on the number of candles from the origin.
Mitigation Level FVG :
Determining the basic level of a FVG. When the price hits the basic level, the FVG due to mitigation.
Show Demand FVG :
Show or not show and specify color.
Show Supply FVG :
Show or not show and specify color.
FVG Filter :
Enable or disable filtering of FVGs. Select filter mode.
🟣 Session
Show More Info Session Color
Asia Session, London Sesseion, New York am Session & New York pm Session :
Show or not show session and kill zones. Change the display color.
🟣 Alert
Send Alert When Touched Session high & Low :
On / Off
Alert Demand OB Mitigation :
On / Off
Alert Supply OB Mitigation :
On / Off
Alert Demand FVG Mitigation :
On / Off
Alert Supply FVG Mitigation :
On / Off
Message Frequency :
This string parameter defines the announcement frequency. Choices include: "All" (activates the alert every time the function is called), "Once Per Bar" (activates the alert only on the first call within the bar), and "Once Per Bar Close" (the alert is activated only by a call at the last script execution of the real-time bar upon closing). The default setting is "Once per Bar".
Show Alert Time by Time Zone :
The date, hour, and minute you receive in alert messages can be based on any time zone you choose. For example, if you want New York time, you should enter "UTC-4". This input is set to the time zone "UTC" by default.
Display More Info :
Displays information about the price range of the order blocks (Zone Price) and the date, hour, and minute under "Display More Info". If you do not want this information to appear in the received message along with the alert, you should set it to "Off".

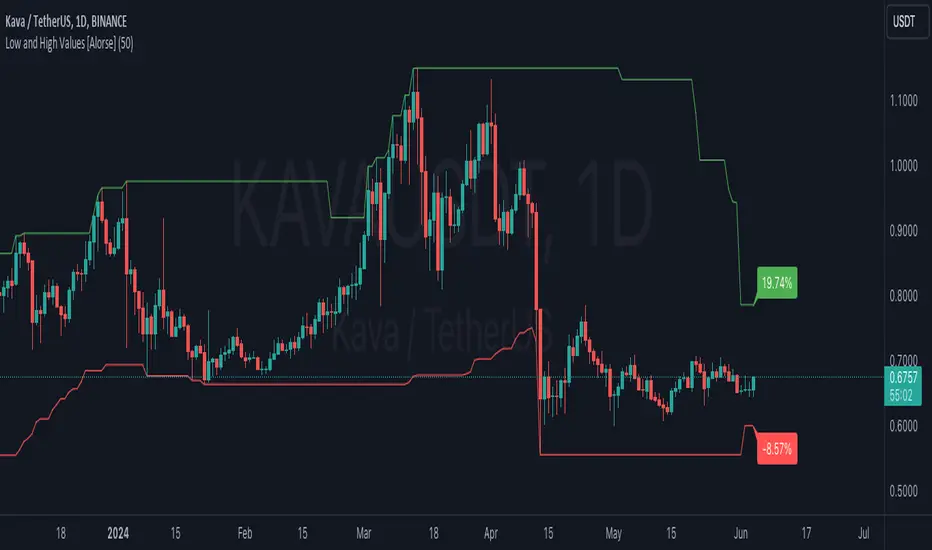
Low and High Values [Alorse]🌟 What does this indicator do?
This magical indicator shows you the lowest (Low) and highest (High) values of the last X candles directly on your chart. Not only that, but it also tells you how much the price has changed from the opening price of the current candle to these key points, all in percentage format. You'll have a clear and precise view of market movement!
🔧 Customize to your liking
Want to adjust the number of candles to consider? No problem! You can easily change this parameter to suit your preference. Whether you like short-term strategies with just a few candles or prefer more extensive analysis with many candles, our indicator adapts to you.
🚀 How can this indicator help you?
Identify Support and Resistance: By showing the lowest and highest points, it helps you identify key support and resistance levels. Perfect for planning your entries and exits!
Trend Analysis: With the percentage labels, you can quickly see how the price has moved relative to recent extremes, helping you confirm trends or anticipate possible reversals.
Trading Strategies: Imagine the price is near a recent low, but the percentage indicates a significant drop from the opening. This could be a buy signal if you expect a rebound. Conversely, if the price is near a recent high with a large percentage increase, you might consider selling.
Calculate Stop Loss: Use this indicator to determine your Stop Loss levels by leaving a bit of margin between the indicator value and your desired SL. This helps protect your positions while allowing for some price fluctuation.
📊 Examples of Use
Intraday Trader: Use the indicator with 10-20 candles to capture quick moves and capitalize on daily fluctuations.
Mid-term Trader: Set the indicator to consider 50 candles for a broader view of trends and reversal points.
Long-term Strategist: Adjust the indicator to 100 candles or more to identify highs and lows over larger time frames.
🛠️ Customizable Parameters
Number of Candles: Define the number of candles the indicator will analyze to calculate the lowest and highest values. It's all up to you!
ka66: FX Sessions High/LowThis indicator is specific to the 24-hour Forex Market. It provides 2 features:
Demarcating forex sessions with open and close lines. Note that looking at various sources online, we use the convention that the Asia session starts with the Tokyo market open, rather than the earlier Sydney session. Presumably this is better since we then have more liquidity in the market. Note that we have three sessions: Asia, London, New York.
At the end of each session, we begin plotting that (closed) session's high and low, which acts as a natural support and resistance for the Forex market. This is the key feature it provides. The first feature is mainly there for a visual guide, which can be turned off via the UI settings, but it certainly helps verifying the logic!
For more background, we are taking the idea of Previous Day High/Low (PDH/PDL), but adjusting it to a multi-session market like Forex. In essence, this is is a "Previous Session High/Low" indicator.
PDH/PDL works fine when you have a market with Regular Trading Hours, ignoring Extended Hours. However, in the Forex market, each session can have differing sentiments, e.g. we often see say London bringing prices up, and New York bringing them back down.
The break of session high/lows (or bouncing off them) can reflect where the potential direction price is going to take.
I also categorised this as a Sentiment indicator, because support and resistance areas where prices react do provide the sentiment of the market. They aren't just lines, they are prices of interest to major players.

Anchored Monte Carlo Shuffled Projection [LuxAlgo]The Anchored Monte Carlo Shuffled Projection tool randomly simulates future price points based on historical bar movements made before a user-anchored point in time.
By anchoring our data and projections to a single point in time, users can better understand and reflect on how the price played out while taking into consideration our random simulations.
🔶 USAGE
After selecting the indicator to apply to the chart, you will be prompted to "Set the Anchor Point". Do so by clicking on the desired location on your chart, only time is used as the anchor point.
Note: To select a new anchor point when applied to the chart, click on the 'More' dropdown next to the indicator status bar (○○○), then select "Reset points...".
Alternate Method: You are also able to click and drag the vertical line that displays on the anchor point bar when the indicator is highlighted.
By randomly simulating bar movements, a range is developed of potential price action which could be utilized to locate future price development as well as potential support/resistance levels.
Performing numerous simulations and taking the average at each step will converge toward the result highlighted by the "Average Line", and can point out where the price might develop, assuming the trend and amount of volatility persist.
Current closing price + Sum of changes in the calculation window
This constraint will cause the simulations always to display an endpoint consistent with the current lookback's slope.
While this may be helpful to some traders, this indicator includes an option to produce a less biased range, as seen below:
🔶 DETAILS
The Anchored Monte Carlo Shuffled Projection tool creates simulations based on prices within a user-set lookback window originating at the specified anchor point. Simulations are done as follows:
Collect each bar's price changes in the user-set window.
Randomize the order of each change in the window.
Project the cumulative sum of the shuffled changes from the current closing price.
Collect data on each point along the way.
This is the process for the Default calculation; for the 'Randomize Direction' calculation, when added onto the front for every other change, the value is inverted, creating the randomized endpoints for each simulation.
The script contains each simulation's data for that bar, with a maximum of 1000 simulations.
To get a glimpse behind the scenes, each simulation (up to 99) can be viewed using the 'Visualize Simulations' Options, as seen below.
Because the script holds the full simulation data, the script can also calculate this data, such as standard deviations.
In this script the Standard deviation lines are the average of all standard deviations across the vertical data groups, this provides a singular value that can be displayed a distance away from the simulation center line.
🔶 SETTINGS
Lookback: Sets the number of Bars to include in calculations.
Simulation Count: Sets the number of randomized simulations to calculate. (Max 1000)
Randomize Direction: See Details Above. Creates a more 'Normalized' Distribution
Visualize Simulations: See Details Above. Turns on Visualizations, and colors are randomly generated. Visualized max does not cap the calculated max. If 1000 simulations are used, the data will be from 1000 simulations, however, only the last 99 simulations will be visualized.
🔹 Standard Deviations
Standard Deviation Multiplier: Sets the multiplier to use for the Standard Deviation distance away from the center line.
🔹 Style
Extend Lines: Extends the Simulated Value Lines into the future for further reference and analysis.

Grid TraderGrid Trader Indicator ( GTx ):
Overview
The Grid Trader Indicator is a tool that helps traders visualize key levels within a specified trading range. The indicator plots accumulation and distribution levels, an entry level, an exit level, and a midpoint. This guide will help you understand how to use the indicator and its features for effective grid trading.
Basics of Trading Range, Grid Buy, and Grid Sell
Trading Range
A trading range is the horizontal price movement between a defined upper ( resistance ) and lower ( support ) level over a period of time. When a security trades within a range, it repeatedly moves between these two levels without trending upwards or downwards significantly. Traders often use the trading range to identify potential buy and sell points:
Upper Level (Resistance): This is the price level at which selling pressure overcomes buying pressure, preventing the price from rising further.
Lower Level (Support): This is the price level at which buying pressure overcomes selling pressure, preventing the price from falling further.
Grid Trading Strategy
Grid trading is a type of trading strategy that involves placing buy and sell orders at predefined intervals around a set price. It aims to profit from the natural market volatility by buying low and selling high in a range-bound market. The strategy divides the trading range into several grid levels where orders are placed.
Grid Buy
Grid buy orders are placed at intervals below the current price . When the price drops to these levels, buy orders are triggered . This strategy ensures that the trader buys more as the price falls, potentially lowering the average purchase price .
Grid Sell
Grid sell orders are placed at intervals above the current price . When the price rises to these levels, sell orders are triggered . This ensures that the trader sells portions of their holdings as the price increases, potentially securing profits at higher levels .
Key Points of Grid Trading
Grid Size : The interval between each buy and sell order. This can be constant (e.g., $2 intervals) or variable based on certain conditions.
Accumulation Range : The lower part of the trading range where buy orders are placed.
Distribution Range : The upper part of the trading range where sell orders are placed.
Midpoint : The average price of the entry and exit levels, often used as a reference point for balance.
As the price moves up and down within this range, your buy orders will be triggered as the price drops and your sell orders will be triggered as the price rises. This allows you to accumulate more of the asset at lower prices and sell portions at higher prices, profiting from the price oscillations within the defined range. Grid trading can be particularly effective in a sideways market where there is no clear long-term trend. However, it requires careful monitoring and adjustment of grid levels based on market conditions to minimize risks and maximize returns .
Configuring the Indicator :
Once the indicator is added, you will see a settings icon next to it. Click on it to open the settings menu.
Adjust the Upper Level , Lower Level , Entry Level , and Exit Level to match your trading strategy and market conditions.
Set the Levels Visibility to control how many bars back the levels will be plotted.
Interpreting the Levels :
Accumulation Levels : These are plotted below the entry level and are potential buy zones. They are labeled as Accumulation Level 1, 2, and 3.
Distribution Levels : These are plotted above the exit level and are potential sell zones. They are labeled as Distribution Level 1, 2, and 3.
Upper Level : Marked in fuchsia, indicating the top boundary of the trading range.
Exit Level : Marked in yellow, indicating the level at which you plan to exit trades.
Midpoint : Marked in white, indicating the average of the entry and exit levels.
Entry Level : Marked in yellow, indicating the level at which you plan to enter trades.
Lower Level : Marked in aqua, indicating the bottom boundary of the trading range.
By visualizing key levels, you can make informed decisions on where to place buy and sell orders, potentially maximizing your trading profits through systematic grid trading.

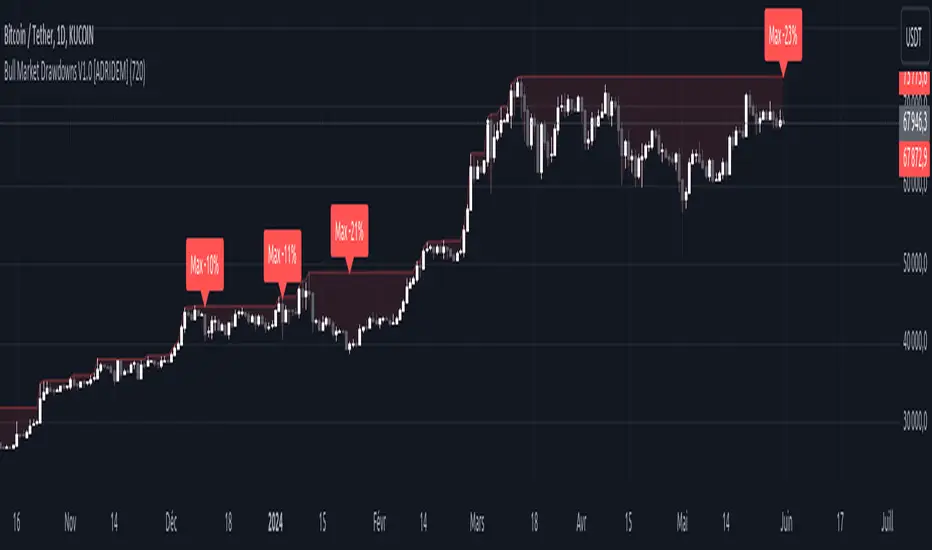
Bull Market Drawdowns V1.0 [ADRIDEM]Bull Market Drawdowns V1.0
Overview
The Bull Market Drawdowns V1.0 script is designed to help visualize and analyze drawdowns during a bull market. This script calculates the highest high price from a specified start date, identifies drawdown periods, and plots the drawdown areas on the chart. It also highlights the maximum drawdowns and marks the start of the bull market, providing a clear visual representation of market performance and potential risk periods.
Unique Features of the New Script
Default Timeframe Configuration: Allows users to set a default timeframe for analysis, providing flexibility in adapting the script to different trading strategies and market conditions.
Customizable Bull Market Start Date: Users can define the start date of the bull market, ensuring the script calculates drawdowns from a specific point in time that aligns with their analysis.
Drawdown Calculation and Visualization: Calculates drawdowns from the highest high since the bull market start date and plots the drawdown areas on the chart with distinct color fills for easy identification.
Maximum Drawdown Tracking and Labeling: Tracks the maximum drawdown for each period and places labels on the chart to indicate significant drawdowns, helping traders identify and assess periods of higher risk.
Bull Market Start Marker: Marks the start of the bull market on the chart with a label, providing a clear reference point for the beginning of the analysis period.
Originality and Usefulness
This script provides a unique and valuable tool by combining drawdown analysis with visual markers and customizable settings. By calculating and plotting drawdowns from a user-defined start date, traders can better understand the performance and risks associated with a bull market. The script’s ability to track and label maximum drawdowns adds further depth to the analysis, making it easier to identify critical periods of market retracement.
Signal Description
The script includes several key visual elements that enhance its usefulness for traders:
Drawdown Area : Plots the upper and lower boundaries of the drawdown area, filling the space between with a semi-transparent color. This helps traders easily identify periods of market retracement.
Maximum Drawdown Labels : Labels are placed on the chart to indicate the maximum drawdown for each period, providing clear markers for significant drawdowns.
Bull Market Start Marker : A label is placed at the start of the bull market, marking the beginning of the analysis period and helping traders contextualize the drawdown data.
These visual elements help quickly assess the extent and impact of drawdowns within a bull market, aiding in risk management and decision-making.
Detailed Description
Input Variables
Default Timeframe (`default_timeframe`) : Defines the timeframe for the analysis. Default is 720 minutes
Bull Market Start Date (`start_date_input`) : The starting date for the bull market analysis. Default is January 1, 2023
Functionality
Highest High Calculation : The script calculates the highest high price on the specified timeframe from the user-defined start date.
```pine
var float highest_high = na
if (time >= start_date)
highest_high := na(highest_high ) ? high : math.max(highest_high , high)
```
Drawdown Calculation : Determines the drawdown starting point and calculates the drawdown percentage from the highest high.
```pine
var float drawdown_start = na
if (time >= start_date)
drawdown_start := na(drawdown_start ) or high >= highest_high ? high : drawdown_start
drawdown = (drawdown_start - low) / drawdown_start * 100
```
Maximum Drawdown Tracking : Tracks the maximum drawdown for each period and places labels above the highest high when a new high is reached.
```pine
var float max_drawdown = na
var int max_drawdown_bar_index = na
if (time >= start_date)
if na(max_drawdown ) or high >= highest_high
if not na(max_drawdown ) and not na(max_drawdown_bar_index) and max_drawdown > 10
label.new(x=max_drawdown_bar_index, y=drawdown_start , text="Max -" + str.tostring(max_drawdown , "#") + "%",
color=color.red, style=label.style_label_down, textcolor=color.white, size=size.normal)
max_drawdown := 0
max_drawdown_bar_index := na
else
if na(max_drawdown ) or drawdown > max_drawdown
max_drawdown := drawdown
max_drawdown_bar_index := bar_index
```
Drawdown Area Plotting : Plots the drawdown area with upper and lower boundaries and fills the area with a semi-transparent color.
```pine
drawdown_area_upper = time >= start_date ? drawdown_start : na
drawdown_area_lower = time >= start_date ? low : na
p1 = plot(drawdown_area_upper, title="Drawdown Area Upper", color=color.rgb(255, 82, 82, 60), linewidth=1)
p2 = plot(drawdown_area_lower, title="Drawdown Area Lower", color=color.rgb(255, 82, 82, 100), linewidth=1)
fill(p1, p2, color=color.new(color.red, 90), title="Drawdown Fill")
```
Current Maximum Drawdown Label : Places a label on the chart to indicate the current maximum drawdown if it exceeds 10%.
```pine
var label current_max_drawdown_label = na
if (not na(max_drawdown) and max_drawdown > 10)
current_max_drawdown_label := label.new(x=bar_index, y=drawdown_start, text="Max -" + str.tostring(max_drawdown, "#") + "%",
color=color.red, style=label.style_label_down, textcolor=color.white, size=size.normal)
if (not na(current_max_drawdown_label))
label.delete(current_max_drawdown_label )
```
Bull Market Start Marker : Places a label at the start of the bull market to mark the beginning of the analysis period.
```pine
var label bull_market_start_label = na
if (time >= start_date and na(bull_market_start_label))
bull_market_start_label := label.new(x=bar_index, y=high, text="Bull Market Start", color=color.blue, style=label.style_label_up, textcolor=color.white, size=size.normal)
```
How to Use
Configuring Inputs : Adjust the default timeframe and start date for the bull market as needed. This allows the script to be tailored to different market conditions and trading strategies.
Interpreting the Indicator : Use the drawdown areas and labels to identify periods of significant market retracement. Pay attention to the maximum drawdown labels to assess the risk during these periods.
Signal Confirmation : Use the bull market start marker to contextualize drawdown data within the overall market trend. The combination of drawdown visualization and maximum drawdown labels helps in making informed trading decisions.
This script provides a detailed view of drawdowns during a bull market, helping traders make more informed decisions by understanding the extent and impact of market retracements. By combining customizable settings with visual markers and drawdown analysis, traders can better align their strategies with the underlying market conditions, thus improving their risk management and decision-making processes.
Breakouts with Tests & Retests [LuxAlgo]The Breakouts Tests & Retests indicator highlights tests and retests of levels constructed from detected swing points. A swing area of interest switches colors when a breakout occurs.
Users can control the sensitivity of the swing point detection and the width of the swing areas.
🔶 USAGE
When a Swing point is detected, an area of interest is drawn, colored green for a bullish swing and red when bearish.
A test is confirmed when the opening price is situated in the area of interest, and the closing price is above or below the area, depending on whether it is a bullish or bearish swing. Tests are highlighted with a solid-colored triangle.
A breakout is confirmed when the price closes in the opposite position, below or above the area, in which case the area will switch colors.
If the opening price is located within the area and the closing price closes outside the area, in the same direction as the breakout, this is considered a retest . Retests are highlighted with a hollow-colored triangle.
Note that tests/retests do not act on wicks. The main factor is that the opening price is in the area of interest, while the closing price is outside.
🔹 Area Of Interest Width
The user can adjust the width of the swing areas. Changing the " Width " is a fast and easy way to find different areas of interest.
A higher "Multiple" setting would return a wider area, allowing price to develop within it for a longer period of time and potentially provide later test signals.
When a swing area is broken, a higher "Width" setting can make it more complicated for the price to break it again, allowing a swing area to remain valid for a longer period of time thus potentially providing more retest signals.
🔶 DETAILS
Generally, only one bullish/bearish pattern can be active at a time. This means that no more than 1 bullish or bearish area will be active.
The " Display " settings, however, can help control how areas of different types are displayed.
Bullish AND Bearish: Both, bullish and bearish patterns can be drawn at the same time
Bullish OR Bearish: Only 1 bullish or 1 bearish pattern is drawn at a time
Bullish: Only bullish patterns
Bearish: Only bearish patterns
🔹 Test/Retest Labels
The user can adjust the settings so only the latest test/retest label is shown or set a minimum number of bars until the next test/retest can be drawn.
🔹 Maximum Bars
Users can set a limit of bars for when there is no test/retest in that period; the area of interest won't be updated anymore and will be available and ready for the next Swing.
An option for pulling the area back to the last retest is included.
🔶 SETTINGS
Display: Determines which swing areas are displayed by the indicator. See the "DETAILS" section for more information
Multiple: Adjusts the width of the areas of interest
Maximum Bars: Limit of bars for when there is no test/retest
Display Test/Retest Labels: Show all labels or just the last test/retest label associated with a swing area
Minimum Bars: Minimum bars required for a subsequent test/retest label are allowed to be displayed
Set Back To Last Retest: When after "Maximum Bars" no test/retest is found, place the right side of the area at the last test/retest
🔹 Swings
Left: x amount of wicks on the left of a potential Swing need to be higher/lower for a Swing to be confirmed.
Right: The number of wicks on the right of a potential swing needs to be higher/lower for a Swing to be confirmed.
🔹 Style
Bullish: color for test period (before a breakout) / retest period (after a breakout)
Bearish: color for test period (before a breakout) / retest period (after a breakout)
Label Size

Weighted Moving Range with Trend Signals (WMR-TS)Weighted Moving Range with Trend Signals (WMR-TS)
Technical analysis involves analyzing statistical trends from trading activity , such as price movement and volume, to make trading decisions. Technical indicators are mathematical calculations based on the price, volume, or open interest of a security or contract. They are used by traders to analyze price movements and predict future market behavior. The WMR-TS indicator combines weighted moving averages and range calculations to identify key trading levels and generate buy/sell signals. It dynamically adjusts to market conditions, offering traders insights into potential support, resistance, and trend reversal points. Key levels are color-coded for quick interpretation. It utilizes weighted moving averages (WMA) and range calculations to determine these levels, making it a robust tool for both trending and ranging markets.
SUMMARY
Parameters :
WMA Length : Determines the length for the primary weighted moving average.
Highest High Length : Sets the period for calculating the highest high.
Lowest Low Length : Sets the period for calculating the lowest low.
Range Corrector : Adjusts the range calculation slightly for fine-tuning.
Top Level : Multiplier for determining the top level from the calculated range.
Bottom Level : Multiplier for determining the bottom level from the calculated range.
Levels Visibility : Sets how many recent bars will display the levels.
Trading Zones :
Short Area : Highlighted zone indicating potential shorting opportunities.
Long Area : Highlighted zone indicating potential buying opportunities.
The Levels :
Wave (Yellow): Midpoint of the calculated range, adjusted by WMA.
Top Level (Red): Calculated upper boundary of the trading range.
Sell Level (Pink): Intermediate sell level.
Resistance Level (Magenta): Immediate resistance level.
Support Level (Cyan): Immediate support level.
Buy Level (Light Green): Intermediate buy level.
Bottom Level (Dark Green): Calculated lower boundary of the trading range.
Interpreting the Signals :
Hammer Signal : Red circles above bars indicate potential sell signals.
Rocket Signal : Green circles below bars indicate potential buy signals.
KEY CONCEPTS
Highest High and Lowest Low :
These values represent the highest high ( HH ) and lowest low ( LL ) over a specified number of periods.
Support Level :
This is the lower boundary of the trading range. It is a price level where demand is strong enough to prevent the price from falling further. As the price approaches the support level, it is likely to bounce back up.
Resistance Level :
This is the upper boundary of the trading range. It is a price level where supply is strong enough to prevent the price from rising further. As the price approaches the resistance level, it is likely to pull back down.
THE USE OF MULTIPLIERS :
The script uses several multipliers to adjust and fine-tune the calculated support and resistance levels, as well as to control the range and sensitivity of these levels. Here is a detailed explanation of these multipliers and their purpose:
Range Corrector : This multiplier adjusts the calculated high ( H ) and low ( L ) levels, adding flexibility to how these levels are positioned relative to the highest high and lowest low. It ranges from -1 to 1 , with a default value of 0 . The use of positive values increase the range, making the calculated levels further apart. Thus, using negative values decrease the range, bringing the calculated levels closer together.
Top Level : This multiplier adjusts the distance of the top level from the calculated high H ) level. It fluctuates from 0 to 2 , with a default value of 0.382 . Higher values will push the top level further above the high level, while lower values will bring it closer.
Bottom Level : This multiplier adjusts the distance of the bottom support level from the calculated low support level. Ranging from 0 to 2, with a default value of 0.214, the higher values will push the bottom level further below the low level, while lower values will bring it closer.
The script plots the support and resistance levels on the chart, allowing traders to visualize the trading range. Color-coded zones are used to indicate areas where buying or selling opportunities may arise based on the current price relative to the trading range. A trading range refers to the area between a price's support and resistance levels over a specific period of time. Within this range, the price of the security fluctuates up and down but does not break out above the resistance or below the support. Support and resistance levels to make trading decisions. Buying near the support level and selling near the resistance level is a common strategy. When the price moves above the resistance level, it is called a breakout . A breakout often indicates that the price may start a new upward trend . Conversely, when the price moves below the support level, it is called a breakdown . A breakdown often indicates that the price may start a new downward trend . By understanding and utilizing trading ranges, traders can make more informed decisions, optimize their trading strategies, and manage risk more effectively.
Understanding Moving Averages
A moving average (MA) is a widely used technical indicator that helps smooth out price data by creating a constantly updated average price. The main purpose of using a moving average is to identify the direction of the trend and to reduce the "noise" of random price fluctuations. The Weighted Moving Average ( WMA ) assigns different weights to each period, with more recent periods typically given more weight. A 10-day WMA might give the most recent day a weight of 10, the second most recent day a weight of 9, and so on. It is useful for traders who want to emphasize recent price data more than older data. When the price is above the moving average, it suggests an Bullish trend . A Bearish Trend is expected to take place when the price is below the moving average. Understanding the price reactions around these levels can be used to make trading decisions.
APPLYING CONCEPTS
Support and Resistance Calculations in the Script :
The script calculates dynamic support and resistance levels using weighted moving averages ( WMA s) and the highest high and lowest low over specified periods. Buy ( Rocket ) and sell ( Hammer ) signals are generated based on the crossing of the price with calculated top and bottom levels.These signals help traders identify potential entry and exit points within the trading range .
Weighted Moving Average (WMA) Application in the Script
This script calculates a special trendWMA using the close price that helps in creating a more dynamic moving average that considers both high and low price actions. This modified WMA is used in conjunction with highest high and lowest low values over specified periods to calculate dynamic support and resistance levels.
Explanation of the Levels in the Script
By understanding these levels, traders can make more informed decisions about where to enter and exit trades, manage risk, and anticipate potential market movements. The script incorporates several key levels levels that traders can use to better anticipate price movements and make more informed trading decisions. Leveraging the principles of Fibonacci retracement ratios ( 23.6%, 38.2%, 50%, 61.8%, and 100% ) to identify key support and resistance zones can also serve for gauging the overall market sentiment.
Top Level and Sell Leve l: Used to identify potential resistance zones where the price may reverse or pause.
Support Level and Buy Level : Used to identify potential support zones where the price may bounce.
Upper and Lower Pivot Values : Serve as intermediate levels for possible price retracements or extensions within the trading range.
Wave Level : Indicates the central trend direction, which can be useful for gauging the overall market sentiment.
Alerts are a crucial part of the script as they notify traders of potential buy and sell signals based on predefined conditions. There are two main alerts: one for a " Hammer " signal (sell condition) and one for a " Rocket " signal (buy condition).
Adjust the input parameters to fit your trading style and the specific asset being analyzed. Shorter lengths may be more responsive to price changes but can produce more false signals , while longer lengths provide smoother signals but may lag . Always backtest the indicator on historical data to understand its behavior and performance. Also remember that different markets may require different parameter settings for optimal performance.
Keep in mind that by nature like all moving averages, WMAs lag behind price action. This means that signals may be delayed. The indicator performs differently in various market conditions. Always consider the overall market context when interpreting signals.
Adjusting parameters like the range corrector and visibility can help tailor the indicator to specific market conditions or trading strategies, improving its effectiveness. The script uses the calculated levels to plot lines and fill zones on the chart, helping traders visualize potential support, resistance, and trend reversal points. The use of multipliers allows for dynamic adjustment of these levels, making the indicator flexible and adaptable to different market conditions.
I think traders can make more informed decisions about where to enter and exit trades, manage risk, and anticipate potential market movements following this code. Stay safe and always remember that market is always changing. Use this tool if you want, please stay informed and plan safe trades,
D.

Reversal Zones with SignalsThe "Reversal Zones with Signals" indicator is an advanced technical analysis tool designed to help traders identify potential market reversal points. By integrating Relative Strength Index (RSI), moving averages, and swing high/low detection, this indicator provides traders with clear visual cues for potential buy and sell opportunities.
Key Features and Benefits
Integration of Multiple Technical Analysis Tools:
The indicator seamlessly combines RSI, moving averages, and swing high/low detection. This multi-faceted approach enhances the reliability of the signals by confirming potential reversals through different technical analysis perspectives.
Customizable Parameters:
Users can adjust the sensitivity of the moving averages, the RSI overbought and oversold levels, and the length of the reversal zones. This flexibility allows traders to tailor the indicator to fit their specific trading strategies and market conditions.
Clear Visual Signals:
Buy and sell signals are plotted directly on the chart as easily recognizable green and red labels. This visual clarity simplifies the process of identifying potential entry and exit points, enabling traders to act quickly and decisively.
Reversal Zones:
The indicator plots reversal zones based on swing highs and lows in conjunction with RSI conditions. Green lines represent potential support levels (zone bottoms), while red lines represent potential resistance levels (zone tops). These zones provide traders with clear areas where price reversals are likely to occur.
Automated Alerts:
Custom alerts can be set for both buy and sell signals, providing real-time notifications when potential trading opportunities arise. This feature ensures that traders do not miss critical market moves.
How It Works
RSI Calculation:
The Relative Strength Index (RSI) is calculated to determine overbought and oversold conditions. When RSI exceeds the overbought threshold, it indicates that the market may be overbought, and when it falls below the oversold threshold, it indicates that the market may be oversold. This helps in identifying potential reversal points.
Swing High/Low Detection:
Swing highs and lows are detected using a specified lookback period. These points represent significant price levels where reversals are likely to occur. Swing highs are detected using the ta.pivothigh function, and swing lows are detected using the ta.pivotlow function.
Reversal Zones:
Reversal zones are defined by plotting lines at swing high and low levels when RSI conditions are met. These zones serve as visual cues for potential support and resistance areas, providing a structured framework for identifying reversal points.
Buy and Sell Signals:
Buy signals are generated when the price crosses above a defined reversal zone bottom, indicating a potential upward reversal. Sell signals are generated when the price crosses below a defined reversal zone top, indicating a potential downward reversal. These signals are further confirmed by the presence of bullish or bearish engulfing patterns.
Plotting and Alerts:
The indicator plots buy and sell signals directly on the chart with corresponding labels. Additionally, alerts can be set up to notify the user when a signal is generated, ensuring timely action.
Originality and Usefulness
Innovative Integration of Technical Tools:
The "Reversal Zones with Signals" indicator uniquely combines multiple technical analysis tools into a single, cohesive indicator. This integration provides a comprehensive view of market conditions, enhancing the accuracy of the signals and offering a robust tool for traders.
Enhanced Trading Decisions:
By providing clear and actionable signals, the indicator helps traders make better-informed decisions. The visualization of reversal zones and the integration of RSI and moving averages ensure that traders have a solid framework for identifying potential reversals.
Flexibility and Customization:
The customizable parameters allow traders to adapt the indicator to different trading styles and market conditions. This flexibility ensures that the indicator can be used effectively by a wide range of traders, from beginners to advanced professionals.
Clear and User-Friendly Interface:
The indicator's design prioritizes ease of use, with clear visual signals and intuitive settings. This user-friendly approach makes it accessible to traders of all experience levels.
Real-Time Alerts:
The ability to set up custom alerts ensures that traders are notified of potential trading opportunities as they arise, helping them to act quickly and efficiently.
Versatility Across Markets:
The indicator is suitable for use in various financial markets, including stocks, forex, and cryptocurrencies. Its adaptability across different asset classes makes it a valuable addition to any trader's toolkit.
How to Use
Adding the Indicator:
Add the "Reversal Zones with Signals" indicator to your chart.
Adjust the parameters (Sensitivity, RSI OverBought Value, RSI OverSold Value, Zone Length) to match your trading strategy and market conditions.
Interpreting Signals:
Buy Signal: A green "BUY" label appears below a bar, indicating a potential buying opportunity based on the detected reversal zone and price action.
Sell Signal: A red "SELL" label appears above a bar, indicating a potential selling opportunity based on the detected reversal zone and price action.
Setting Alerts:
Set alerts for buy and sell signals to receive notifications when potential trading opportunities arise. This ensures timely action and helps traders stay informed about critical market moves.

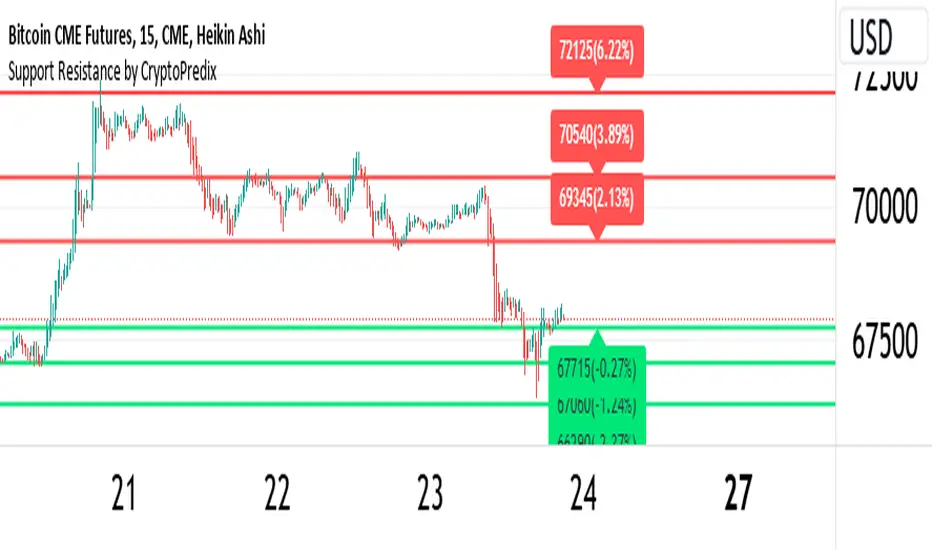
Support Resistance - CryptoPredixHow this indicator works :
1. Setup and Inputs: The script sets up user inputs for various parameters such as pivot period (prd), pivot source (ppsrc), maximum channel width (ChannelW), maximum number of support/resistance levels (maxnumsr), minimum strength (min_strength), label location (labelloc), line style (linestyle), and line width (linewidth).Colors for support and resistance lines are also defined (supportcolor, resistancecolor).
2. Pivot Point Calculation: The script calculates pivot high and pivot low values based on the selected source (either High/Low or Close/Open).It uses the ta.pivothigh and ta.pivotlow functions to identify these pivot points over the specified period (prd).
3. Plotting Pivot Points: If the showpp option is enabled, the script plots pivot high and pivot low points on the chart using plotshape.
4. Managing Pivot Values: The script maintains an array (pivotvals) to store recent pivot values, ensuring the number of stored values does not exceed the maximum specified (maxnumpp).
5. Support and Resistance Zone Calculation: It calculates support and resistance zones by finding ranges of pivot values that fall within a specified channel width (cwidth).The function get_sr_vals returns the highest, lowest values, and the number of pivot points within the channel width.
6. Storing Support and Resistance Levels: The script manages arrays for support and resistance levels (sr_up_level, sr_dn_level) and their strength (sr_strength).It uses the check_sr function to ensure that new support/resistance levels are valid and don't overlap with existing ones unless they have higher strength.
7. Label and Line Management: The script dynamically updates labels and lines for the support and resistance levels, adjusting their positions, colors, and styles based on the latest data.It ensures the labels and lines are in sync with the current bar index and close price.
8. Identifying Crossings: Functions f_crossed_over and f_crossed_under check if the close price has crossed above or below the identified support or resistance levels.These functions iterate through the support/resistance arrays and check the conditions for crossing.
9. Alerts: The script sets up alert conditions to notify when the price crosses above a resistance level or below a support level.Alerts are configured with titles and messages ('Resistance Broken' and 'Support Broken').
10. Visualization: The script provides visual cues on the chart by plotting support and resistance lines with different styles and colors.It also dynamically updates labels to display the level values and their percentage distance from the current close price.
This script helps traders identify key support and resistance levels on a chart, providing both visual cues and alerts for significant price movements relative to these levels.
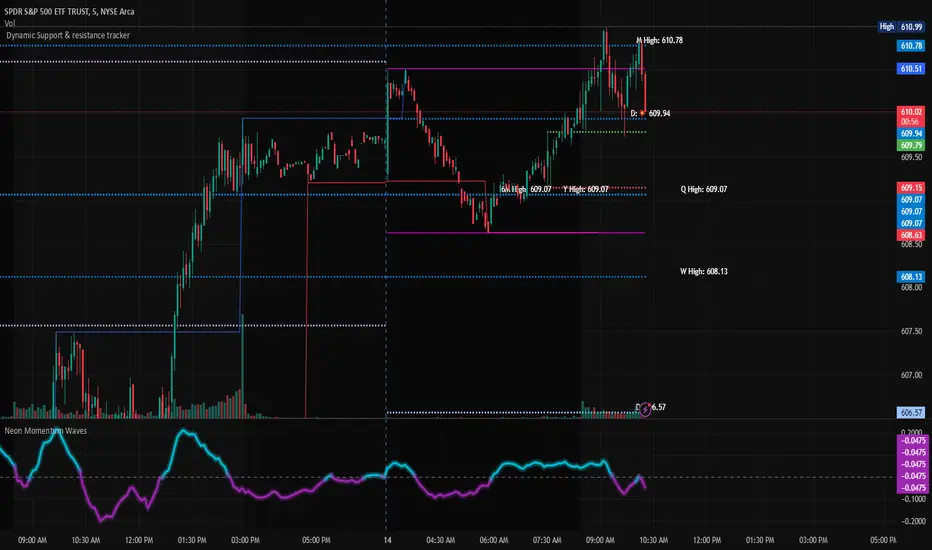
Dynamic Support & Resistance TrackerThe "Dynamic Support & Resistance Tracker" is a powerful Pine Script study designed to identify and visualize key support and resistance levels on a trading chart. This study dynamically adjusts to market conditions, providing traders with valuable insights for making informed trading decisions.
Key Features:
Dynamic Support & Resistance Lines:
The script identifies and plots support and resistance levels using pivot points based on a user-defined number of left and right bars.
Resistance lines are plotted in red, while support lines are plotted in blue, making it easy to distinguish between the two.
Toggle Breaks:
Users can choose to display or hide break signals for support and resistance levels using a simple toggle input.
Volume Threshold:
The study includes daily and weekly high and low calculations to provide a comprehensive view of market ranges.
Previous high and low lines are plotted for both daily and weekly timeframes, aiding in identifying potential breakout or breakdown levels.
Regular Market Hours:
The script defines regular market hours and tracks sessions, ensuring that support and resistance levels are relevant to active trading periods.
Midline and Extension Lines:
The study calculates and plots a midline between the previous high and low, along with extension lines above and below the range. These lines help identify potential target levels and extensions beyond the current range.
Real-time Updates:
The script ensures that all lines are updated in real-time, adjusting to new bars as they form. This dynamic feature keeps the levels relevant and accurate throughout the trading session.
Usage Instructions:
Adjust the number of left and right bars to define the sensitivity of the support and resistance levels.
Toggle the display of break signals to highlight significant breaks in support or resistance.
Monitor the daily and weekly high and low lines to understand the broader market context.
Utilize the midline and extension lines to set potential price targets and manage risk effectively.
This study provides traders with a robust tool for identifying and reacting to key market levels, enhancing their trading strategies with dynamic and real-time insights.
Session MasterSession Master Indicator
Overview
The "Session Master" indicator is a unique tool designed to enhance trading decisions by providing visual cues and relevant information during the critical last 15 minutes of a trading session. It also integrates advanced trend analysis using the Average Directional Index (ADX) and Directional Movement Index (DI) to offer insights into market trends and potential entry/exit points.
Originality and Functionality
This script combines session timing, visual alerts, and trend analysis in a cohesive manner to give traders a comprehensive view of market behavior as the trading day concludes. Here’s a breakdown of its key features:
Last 15 Minutes Highlight : The script identifies the last 15 minutes of the trading session and highlights this period with a semi-transparent blue background, helping traders focus on end-of-day price movements.
Previous Session High and Low : The script dynamically plots the high and low of the previous trading session. These levels are crucial for identifying support and resistance and are highlighted with dashed lines and labeled for easy identification during the last 15 minutes of the current session.
Directional Movement and Trend Analysis : Using a combination of ADX and DI, the script calculates and plots trend strength and direction. A 21-period Exponential Moving Average (EMA) is plotted with color coding (green for bullish and red for bearish) based on the DI difference, offering clear visual cues about the market trend.
Technical Explanation
Last 15 Minutes Highlight:
The script checks the current time and compares it to the session’s last 15 minutes.
If within this period, the background color is changed to a semi-transparent blue to alert the trader.
Previous Session High and Low:
The script retrieves the high and low of the previous daily session.
During the last 15 minutes of the session, these levels are plotted as dashed lines and labeled appropriately.
ADX and DI Calculation:
The script calculates the True Range, Directional Movement (both positive and negative), and smoothes these values over a specified length (28 periods by default).
It then computes the Directional Indicators (DI+ and DI-) and the ADX to gauge trend strength.
The 21-period EMA is plotted with dynamic color changes based on the DI difference to indicate trend direction.
How to Use
Highlight Key Moments: Use the blue background highlight to concentrate on market movements in the critical last 15 minutes of the trading session.
Identify Key Levels: Pay attention to the plotted high and low of the previous session as they often act as significant support and resistance levels.
Assess Trend Strength: Use the ADX and DI values to understand the strength and direction of the market trend, aiding in making informed trading decisions.
EMA for Entry/Exit: Use the color-coded 21-period EMA for potential entry and exit signals based on the trend direction indicated by the DI.
Conclusion
The "Session Master" indicator is a powerful tool designed to help traders make informed decisions during the crucial end-of-session period. By combining session timing, previous session levels, and advanced trend analysis, it provides a comprehensive overview that is both informative and actionable. This script is particularly useful for intraday traders looking to optimize their strategies around session close times.

Dynamic Gann Levels [XrayTrades]This indicator dynamically captures the highest and lowest points visible on the chart and calculates Gann Support and Resistance Levels. The inputs are detailed below.
Why create this indicator?
There is no other indicator with the same functionality on TradingView.
These calculations are time-consuming; the speed at which this indicator calculates any number of rotations and degrees and visually displays them on the chart is invaluable to me, and hopefully others who use/perform these calculations.
Works on any time frame:
Year, month, week, day, etc. Smaller timeframes (intraday) for higher prices may require adjusting the y-axis of the chart after the calculation of levels due to the nature of squaring numbers.
Inputs:
Resistance: Up (from pivot low) - This toggles on/off levels calculated from the lowest point visible on the chart’s current view.
Support: Down (from pivot high) - This toggles on/off levels calculated from the highest point visible on the chart’s current view.
360 - Toggles on/off the levels of full rotations (360 degrees) from price
180 - Toggles on/off the levels of half rotations (180 degrees) from price
90 - Toggles on/off the levels of quarter rotations (90 degrees) from price
45 - Toggles on/off the levels of eighth rotations (45 degrees) from price
Full Rotations Visible - The number of rotations to be displayed on the chart
How to use this indicator:
Adjust chart window to change the highs and lows.
Select the degrees, direction, and number of rotations in the indicator settings.
The colored values beside the indicator represent the values (high and low) used in generating the Gann levels. Should the cursor be on the chart, ensure it is to the right of the high and low pivots, as this is dynamic in TradingView depending upon cursor location. Note: This is only for the user to know which value(s) are used; cursor position does not impact actual calculations and levels displayed.
The levels will be drawn to the right of the most recent price, labeled with the degrees and direction as well as the price value at the level.
About the calculations:
These calculations are derived from the Natural Square Calculator of Gann Theory, also known as the Square of Nines.
Details:
Take the square root of the selected value (lowest and or highest point).
Add (for up or subtract for down) 0.25 for every 45 degrees of rotation to the desired calculation.
Square this. Round to two decimal places.
Ex: Low of 100. Calculate Gann resistance level for 360 degrees. (√(100)+2)² = 144.
Ex: High of 100. Calculate Gann support level for 180 degrees. (√(100)-1)² = 81.

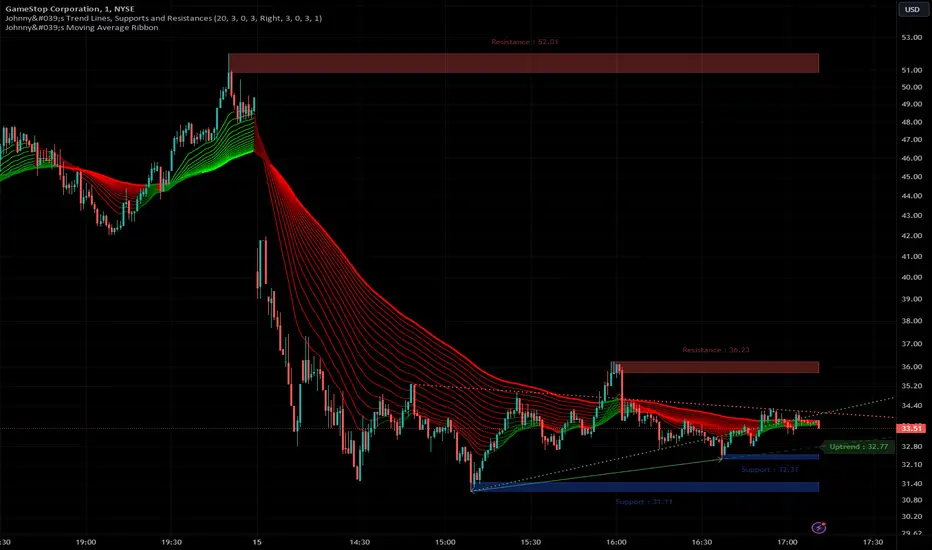
Johnny's Trend Lines, Supports and ResistancesInspired and based on ismailcarlik's Trend Lines, Supports and Resistances.
Additions include an overall upgrade to Pinescript v5, changes in the way resistance and support levels are calculated, improved visual queues, and additional customization options.
This indicator is meticulously crafted to provide traders with visual tools for identifying trend lines, support, and resistance levels, enhancing the decision-making process in trading activities.
Features and Functionality
Trend Lines: The indicator allows users to enable or disable trend lines, adjust the number of points to check for establishing a trend, and set parameters for trend validation, including the maximum violation and exceptions for the last bars.
Support and Resistance: It offers tools to identify and visualize key support and resistance levels based on recent pivot points. This includes adjustable parameters for the maximum violations allowed and the exclusion of recent bars from the analysis.
Pivot Points: Users can define the pivot length for calculating highs and lows, which helps in marking significant pivot points that are instrumental in trend analysis.
Alerts and Notifications: The indicator is equipped with customizable alerts for trend line breaches and pivot point formations, which can be set to trigger at different frequencies based on user preference.
How It Works
Input Flexibility: Users can adjust various settings like the length of trend lines and pivot points, enabling or disabling specific features like marking pivots, and managing alert settings directly from the indicator’s input panel.
Dynamic Analysis: By analyzing the price action relative to the calculated trend lines and pivot points, the indicator dynamically identifies potential trend reversals, continuations, and significant price levels.
Visualization: It plots trend lines and marks support and resistance levels directly on the chart, with options to extend these lines and add labels for better clarity. Violated trend lines can be visually differentiated by changing their style and width.
Practical Application
Trend Line Strategy: Traders can use the trend lines to determine the strength of the current market trend and to spot potential reversal points.
Support and Resistance Strategy: By marking where the price has historically faced resistance or found support, traders can plan entry and exit points, set stop-loss orders, or identify breakout opportunities.
Pivot Points Strategy: Pivot points serve as vital indicators for intraday trading or long-term trend analysis, providing insights into potential support and resistance levels.
Customization and Alerts
Custom Alerts: Traders can set alerts for when the price crosses trend lines or when new support or resistance levels are formed, helping them stay informed of critical market movements without having to continuously monitor the charts.
Visual Customization: Users can personalize the appearance of trend lines and labels, choosing from a variety of colors and styles to match their chart setup or preferences.
"Johnny's Trend Lines, Supports and Resistances" is an essential tool for traders who rely on technical analysis, offering detailed insights and real-time updates on market conditions, trend strength, and potential price barriers.
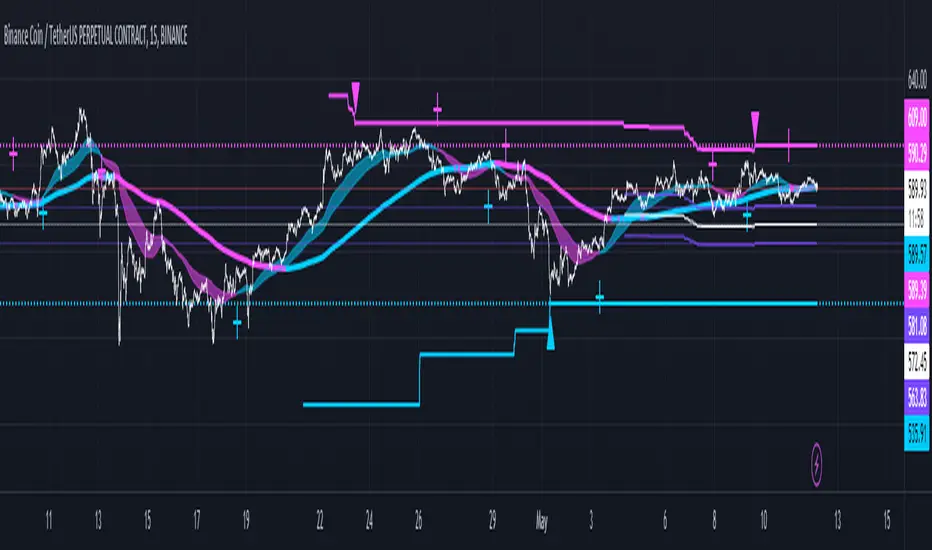
MarketRangerThis indicator puts a selection of elements together providing traders with insights into price dynamics, trend changes, and potential trading opportunities within the specified timeframe.
Trading Range Defined by Support and Resistance :
Support and resistance levels are calculated using the lowest low and highest high over specified periods.
These
levels define the boundaries of the trading range within which the price moves.
WMA Color Changing based on Slope :
The script uses three Weighted Moving Averages (WMAs) with different lengths.
The color of the main WMA changes based on its slope.
When the slope of the WMA is positive (indicating an uptrend), it's displayed in blue. When it's
negative (indicating a downtrend), it's displayed in pink.
New High/Low Detection :
The script detects new highs and lows in the price action.
A new high is detected when the current high crosses under the previous resistance level, and a new low is detected when the current low crosses over the previous support level.
These
detections are marked by triangle shapes above or below the bars.
WMA Crosses :
The script calculates the difference between the two WMAs.
When the faster WMA crosses above the slower WMA, indicating a potential bullish signal, a blue cross shape is plotted below the bar.
When the faster WMA crosses below the slower WMA, indicating a potential bearish signal, a
pink cross shape is plotted above the bar.
Slope Changes :
The script calculates the slope of the main WMA and tracks changes in slope.
A positive slope indicates an upward trend, while a negative slope indicates a downward trend.
Slope changes from negative to positive indicate potential bullish momentum, and from
positive to negative indicate potential bearish momentum.
Customizable Pivot Levels :
Pivot levels are calculated based on user-defined percentages of the range between support and resistance.
Pivot Level 1 and Pivot Level 2 provide additional reference points for potential reversals or trend continuation.
Usage :
The indicator provides support and resistance levels, new high/low alerts, and WMA crosses.
The midpoint and customizable pivot levels offer potential trading zones.
Slope change points indicate potential shifts in market sentiment.
Customize the pivot levels according to your trading strategy.
Parameters :
Adjust the WMA lengths and support/resistance lengths to suit your trading style.
Modify the visibility settings to control how many periods of support and resistance are displayed.
Customize the pivot levels to fit your preferred trading strategy.
Alerts :
Alerts are triggered for new high/low points and WMA crosses.
Use alerts to stay informed about potential trading opportunities.
Interpretation :
Watch for new high/low points for potential trend reversals or continuations.
Monitor WMA crosses and slope changes for signals of market direction.
Consider trading near support/resistance levels and pivot points.
Additional Notes :
Experiment with different settings to find the configuration that best suits your trading preferences.
Backtest the indicator on historical data to validate its effectiveness before using it in live trading.
Volatility ATR Support and Resistance Bands [Quantigenics]Volatility ATR Support and Resistance Bands
The “Volatility ATR Support and Resistance Bands” is a trend visualization tool that uses Average True Range (ATR) to create a dynamic channel around price action, adapting to changes in volatility and offering clear trend indicators. The band direction can indicate trend and the lines can indicate support and resistance levels.
The script works by calculating a series of moving averages from the highest and lowest prices, then applies an ATR-based multiplier to generate a set of bands. These bands expand and contract with the market’s volatility, providing a visual guide to the strength and potential direction of price movements.
How to Trade with Volatility ATR Band:
Identify Trend Direction: When the bands slope upwards, the market is trending upwards, which may be a good opportunity to consider a long position. When the bands slope downward, the market is trending downwards, which could be a sign to sell or short.
Volatility Awareness: The wider the bands, the higher the market volatility. Narrow bands suggest a quieter market, which might indicate consolidation or a potential breakout/breakdown.
Confirm Entries and Exits: Use the bands as dynamic support and resistance; entering trades as the price bounces off the bands and considering exits as it reaches the opposite side or breaches the bands.
Hope you enjoy this script!
Happy trading!

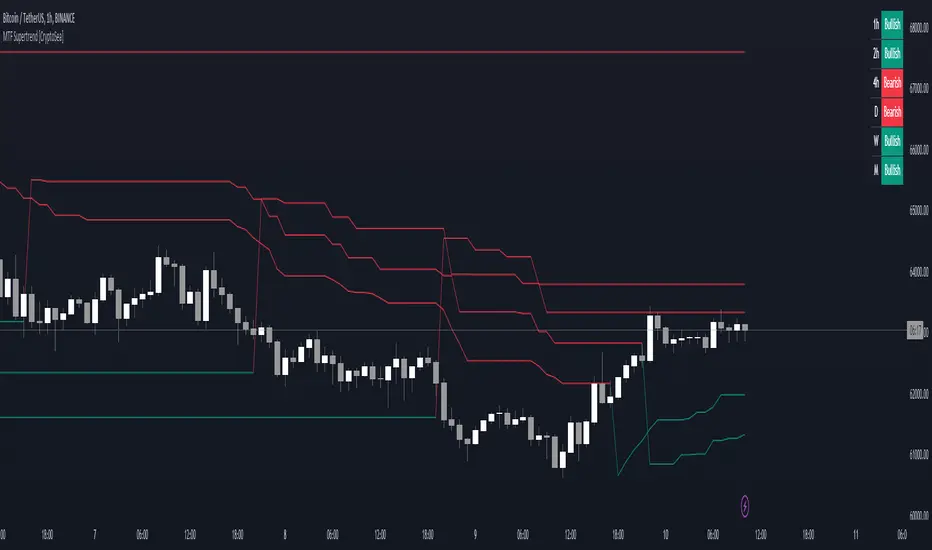
MTF Supertrend [CryptoSea]The MTF Supertrend Indicator is a versatile tool crafted to enhance trend analysis across multiple timeframes. Leveraging the reliable Supertrend formula, it provides traders with a comprehensive view of market trends and potential reversal points.
Key Features
Multi Timeframe Analysis: Tracks Supertrend signals over a variety of timeframes, offering a broad perspective on market direction.
Percentage Threshold Display: Filters out Supertrend data that is not within a specified percentage of the current price, keeping the display focused on relevant trends.
Adaptive Visual Display: Features a dynamic table that shows the current Supertrend status, which is fully customizable to the user's display preferences.
Customizable Sensitivity: Users can fine-tune the factor and ATR period settings, allowing for personalized trend sensitivity.
How it Works
Supertrend Calculation: Computes the Supertrend using the Average True Range (ATR) multiplied by a customizable factor, detecting changes in volatility and trend.
Higher Timeframe Filtering: Prioritizes higher timeframe trends over the current chart's timeframe to avoid chart clutter and focus on the most significant trends.
Colour-Coded Trends: Utilizes colour coding to clearly indicate bullish and bearish trends, aiding quick visual analysis.
Responsive Display Options: Includes a switchable table view to overlay trend information on the chart, with options for dark and light themes.
Benefits for Different Trading Styles
Day Traders: Use real-time updates to catch short-term trend reversals and ride the momentum for quick profits.
Swing Traders: Benefit from viewing medium to long-term trends to formulate strategies that span several days or weeks.
Position Traders: Utilize the monthly supertrend data to make long-term investment decisions based on prevailing market directions.
Application
Strategic Decision-Making: Assists traders in making informed decisions by providing a layered view of trend directions across timeframes.
Trend Confirmation: Reinforces trading strategies by confirming trends with higher timeframe Supertrend alignment.
Customized Analysis: Adapts to various trading styles with input settings that control the display and sensitivity of trend data.
The MTF Supertrend Indicator by is a powerful addition to the trader's toolkit, enhancing multi-timeframe trend analysis and contributing to a strategic trading approach in volatile markets.
Smart Money Concept [TradingFinder] Major OB + FVG + Liquidity🔵 Introduction
"Smart Money" refers to funds under the control of institutional investors, central banks, funds, market makers, and other financial entities. Ordinary people recognize investments made by those who have a deep understanding of market performance and possess information typically inaccessible to regular investors as "Smart Money".
Consequently, when market movements often diverge from expectations, traders identify the footprints of smart money. For example, when a classic pattern forms in the market, traders take short positions. However, the market might move upward instead. They attribute this contradiction to smart money and seek to capitalize on such inconsistencies in their trades.
The "Smart Money Concept" (SMC) is one of the primary styles of technical analysis that falls under the subset of "Price Action". Price action encompasses various subcategories, with one of the most significant being "Supply and Demand", in which SMC is categorized.
The SMC method aims to identify trading opportunities by emphasizing the impact of large traders (Smart Money) on the market, offering specific patterns, techniques, and trading strategies.
🟣 Key Terms of Smart Money Concept (SMC)
• Market Structure (Trend)
• Change of Character (ChoCh)
• Break of Structure (BoS)
• Order Blocks (Supply and Demand)
• Imbalance (IMB)
• Inefficiency (IFC)
• Fair Value Gap (FVG)
• Liquidity
• Premium and Discount
🔵 How Does the "Smart Money Concept Indicator" Work?
🟣 Market Structure
a. Accumulation
b. Market-Up
c. Distribution
d. Market-Down
a) Accumulation Phase : During the accumulation period, typically following a downtrend, smart money enters the market without significantly affecting the pricing trend.
b) Market-Up Phase : In this phase, the price of an asset moves upward from the accumulation range and begins to rise. Usually, the buying by retail investors is the main driver of this trend, and due to positive market sentiment, it continues.
c) Distribution Phase : The distribution phase, unlike the accumulation stage, occurs after an uptrend. In this phase, smart money attempts to exit the market without causing significant price fluctuations.
d) Market-Down Phase : In this stage, the price of an asset moves downward from the distribution phase, initiating a prolonged downtrend. Smart money liquidates all its positions by creating selling pressure, trapping latecomer investors.
The result of these four phases in the market becomes the market trend.
Types of Trends in Financial Markets :
a. Up-Trend
b. Down Trend
c. Range (No Trend)
a) Up-Trend : The market breaks consecutive highs.
b) Down Trend : The market breaks consecutive lows.
c) No Trend or Range : The market oscillates within a range without breaking either highs or lows.
🟣 Change of Character (ChoCh)
The "ChoCh" or "Change of Character" pattern indicates an initial change in order flow in financial markets. This structural change occurs when a major pivot in the opposite direction of the market trend fails. It signals a potential change in the market trend and can serve as a signal for short-term or long-term trend changes in a trading symbol.
🟣 Break of Structure (BoS)
The "BoS" or "Break of Structure" pattern indicates the continuation of the trend in financial markets. This structure forms when, in an uptrend, the price breaks its ceiling or, in a downtrend, the price breaks its floor.
🟣 Order Blocks (Supply and Demand)
Order blocks consist of supply and demand areas where the likelihood of price reversal is higher. There are six order blocks in this indicator, categorized based on their origin and formation reasons.
a. Demand Main Zone, "ChoCh" Origin.
b. Demand Sub Zone, "ChoCh" Origin.
c. Demand All Zone, "BoS" Origin.
d. Supply Main Zone, "ChoCh" Origin.
e. Supply Sub Zone, "ChoCh" Origin.
f. Supply All Zone, "BoS" Origin.
🟣 FVG | Inefficiency | Imbalance
These three terms are almost synonymous. They describe the presence of gaps between consecutive candle shadows. This inefficiency occurs when the market moves rapidly. Primarily, imbalances and these rapid movements stem from the entry of smart money and the imbalance between buyer and seller power. Therefore, identifying these movements is crucial for traders.
These areas are significant because prices often return to fill these gaps or even before they occur to fill price gaps.
🟣 Liquidity
Liquidity zones are areas where there is a likelihood of congestion of stop-loss orders. Liquidity is considered the driving force of the entire market, and market makers may manipulate the market using these zones. However, in many cases, this does not happen because there is insufficient liquidity in some areas.
Types of Liquidity in Financial Markets :
a. Trend Lines
b. Double Tops | Double Bottoms
c. Triple Tops | Triple Bottoms
d. Support Lines | Resistance Lines
All four types of liquidity in this indicator are automatically identified.
🟣 Premium and Discount
Premium and discount zones can assist traders in making better decisions. For instance, they may sell positions in expensive ranges and buy in cheaper ranges. The closer the price is to the major resistance, the more expensive it is, and the closer it is to the major support, the cheaper it is.
🔵 How to Use
🟣 Change of Character (ChoCh) and Break of Structure (BoS)
This indicator detects "ChoCh" and "BoS" in both Minor and Major states. You can turn on the display of these lines by referring to the last part of the settings.
🟣 Order Blocks (Supply and Demand)
Order blocks are Zones where the probability of price reversal is higher. In demand Zones you can buy opportunities and in supply Zones you can check sell opportunities.
The "Refinement" feature allows you to adjust the width of the order block according to your strategy. There are two modes, "Aggressive" and "Defensive," in the "Order Block Refine". The difference between "Aggressive" and "Defensive" lies in the width of the order block.
For risk-averse traders, the "Defensive" mode is suitable as it provides a lower loss limit and a greater reward-to-risk ratio. For risk-taking traders, the "Aggressive" mode is more appropriate. These traders prefer to enter trades at higher prices, and this mode, which has a wider order block width, is more suitable for this group of individuals.
🟣 Fair Value Gap (FVG) | Imbalance (IMB) | Inefficiency (IFC)
In order to identify the "fair value gap" on the chart, it must be analyzed candle by candle. In this process, it is important to pay attention to candles with a large size, and a candle and a candle should be examined before that.
Candles before and after this central candle should have long shadows and their bodies should not overlap with the central candle body. The distance between the shadows of the first and third candles is known as the FVG range.
These areas work in two ways :
• Supply and demand area : In this case, the price reacts to these areas and the trend is reversed.
• Liquidity zone : In this scenario, the price "fills" the zone and then reaches the order block.
Important note : In most cases, the FVG zone of very small width acts as a supply and demand zone, while the zone of significant width acts as a liquidity zone and absorbs price.
When the FVG filter is activated, the FVG regions are filtered based on the specified algorithm.
FVG filter types include the following :
1. Very Aggressive Mode : In addition to the initial condition, an additional condition is considered. For bullish FVG, the maximum price of the last candle must be greater than the maximum price of the middle candle.
Similarly, for a bearish FVG, the minimum price of the last candle must be lower than the minimum price of the middle candle. This mode removes the minimum number of FVGs.
2. Aggressive : In addition to the very aggressive condition, the size of the middle candle is also considered. The size of the center candle should not be small and therefore more FVGs are removed in this case.
3. Defensive : In addition to the conditions of the very aggressive mode, this mode also considers the size of the middle pile, which should be relatively large and make up the majority of the body.
Also, to identify bullish FVGs, the second and third candles must be positive, while for bearish FVGs, the second and third candles must be negative. This mode filters out a significant number of FVGs and keeps only those of good quality.
4. Very Defensive : In addition to the conditions of the defensive mode, in this mode the first and third candles should not be very small-bodied doji candles. This mode filters out most FVGs and only the best quality ones remain.
🟣 Liquidity
These levels are where traders intend to exit their trades. "Market makers" or smart money usually accumulate or distribute their trading positions near these levels, where many retail traders have placed their "stop loss" orders. When liquidity is collected from these losses, the price often reverses.
A "Stop hunt" is a move designed to offset liquidity generated by established stop losses. Banks often use major news events to trigger stop hunts and capture liquidity released into the market. For example, if they intend to execute heavy buy orders, they encourage others to sell through stop-hots.
Consequently, if there is liquidity in the market before reaching the order block area, the validity of that order block is higher. Conversely, if the liquidity is close to the order block, that is, the price reaches the order block before reaching the liquidity limit, the validity of that order block is lower.
🟣 Alert
With the new alert functionality in this indicator, you won't miss any important trading signals. Alerts are activated when the price hits the last order block.
1. It is possible to set alerts for each "symbol" and "time frame". The system will automatically detect both and include them in the warning message.
2. Each alert provides the exact date and time it was triggered. This helps you measure the timeliness of the signal and evaluate its relevance.
3. Alerts include target order block price ranges. The "Proximal" level represents the initial price level strike, while the "Distal" level represents the maximum price gap in the block. These details are included in the warning message.
4. You can customize the alert name through the "Alert Name" entry.
5. Create custom messages for "long" and "short" alerts to be sent with notifications.
🔵 Setting
a. Pivot Period of Order Blocks Detector :
Using this parameter, you can set the zigzag period that is formed based on the pivots.
b. Order Blocks Validity Period (Bar) :
You can set the validity period of each Order Block based on the number of candles that have passed since the origin of the Order Block.
c. Demand Main Zone, "ChoCh" Origin :
You can control the display or not display as well as the color of Demand Main Zone, "ChoCh" Origin.
d. Demand Sub Zone, "ChoCh" Origin :
You can control the display or not display as well as the color of Demand Sub Zone, "ChoCh" Origin.
e. Demand All Zone, "BoS" Origin :
You can control the display or not display as well as the color of Demand All Zone, "BoS" Origin.
f. Supply Main Zone, "ChoCh" Origin :
You can control the display or not display as well as the color of Supply Main Zone, "ChoCh" Origin.
g. Supply Sub Zone, "ChoCh" Origin :
You can control the display or not display as well as the color of Supply Sub Zone, "ChoCh" Origin.
h. Supply All Zone, "BoS" Origin :
You can control the display or not display as well as the color of Supply All Zone, "BoS" Origin.
i. Refine Demand Main : You can choose to be refined or not and also the type of refining.
j. Refine Demand Sub : You can choose to be refined or not and also the type of refining.
k. Refine Demand BoS : You can choose to be refined or not and also the type of refining.
l. Refine Supply Main : You can choose to be refined or not and also the type of refining.
m. Refine Supply Sub : You can choose to be refined or not and also the type of refining.
n. Refine Supply BoS : You can choose to be refined or not and also the type of refining.
o. Show Demand FVG : You can choose to show or not show Demand FVG.
p. Show Supply FVG : You can choose to show or not show Supply FVG
q. FVG Filter : You can choose whether FVG is filtered or not. Also specify the type of filter you want to use.
r. Show Statics High Liquidity Line : Show or not show Statics High Liquidity Line.
s. Show Statics Low Liquidity Line : Show or not show Statics Low Liquidity Line.
t. Show Dynamics High Liquidity Line : Show or not show Dynamics High Liquidity Line.
u. Show Dynamics Low Liquidity Line : Show or not show Dynamics Low Liquidity Line.
v. Statics Period Pivot :
Using this parameter, you can set the Swing period that is formed based on Static Liquidity Lines.
w. Dynamics Period Pivot :
Using this parameter, you can set the Swing period that is formed based Dynamics Liquidity Lines.
x. Statics Liquidity Line Sensitivity :
is a number between 0 and 0.4. Increasing this number decreases the sensitivity of the "Statics Liquidity Line Detection" function and increases the number of lines identified. The default value is 0.3.
y. Dynamics Liquidity Line Sensitivity :
is a number between 0.4 and 1.95. Increasing this number increases the sensitivity of the "Dynamics Liquidity Line Detection" function and decreases the number of lines identified. The default value is 1.
z. Alerts Name : You can customize the alert name using this input and set it to your desired name.
aa. Alert Demand Main Mitigation :
If you want to receive the alert about Demand Main 's mitigation after setting the alerts, leave this tick on. Otherwise, turn it off.
bb. Alert Demand Sub Mitigation :
If you want to receive the alert about Demand Sub's mitigation after setting the alerts, leave this tick on. Otherwise, turn it off.
cc. Alert Demand BoS Mitigation :
If you want to receive the alert about Demand BoS's mitigation after setting the alerts, leave this tick on. Otherwise, turn it off.
dd. Alert Supply Main Mitigation :
If you want to receive the alert about Supply Main's mitigation after setting the alerts, leave this tick on. Otherwise, turn it off.
ee. Alert Supply Sub Mitigation :
If you want to receive the alert about Supply Sub's mitigation after setting the alerts, leave this tick on. Otherwise, turn it off.
ff. Alert Supply BoS Mitigation :
If you want to receive the alert about Supply BoS's mitigation after setting the alerts, leave this tick on. Otherwise, turn it off.
gg. Message Frequency :
This parameter, represented as a string, determines the frequency of announcements. Options include: 'All' (triggers the alert every time the function is called), 'Once Per Bar' (triggers the alert only on the first call within the bar), and 'Once Per Bar Close' (activates the alert only during the final script execution of the real-time bar upon closure). The default setting is 'Once per Bar'.
hh. Show Alert time by Time Zone :
The date, hour, and minute displayed in alert messages can be configured to reflect any chosen time zone. For instance, if you prefer London time, you should input 'UTC+1'. By default, this input is configured to the 'UTC' time zone.
ii. Display More Info : The 'Display More Info' option provides details regarding the price range of the order blocks (Zone Price), along with the date, hour, and minute. If you prefer not to include this information in the alert message, you should set it to 'Off'.
You also have access to display or not to display, choose the Style and Color of all the lines below :
a. Major Bullish "BoS" Lines
b. Major Bearish "BoS" Lines
c. Minor Bullish "BoS" Lines
d. Minor Bearish "BoS" Lines
e. Major Bullish "ChoCh" Lines
f. Major Bearish "ChoCh" Lines
g. Minor Bullish "ChoCh" Lines
h. Minor Bearish "ChoCh" Lines
i. Last Major Support Line
j. Last Major Resistance Line
k. Last Minor Support Line
l. Last Minor Resistance Line

Kaspa Power LawSimple Power Law Indicator for Kaspa with addition of adjustable bands above and below the Power Law Price. Best used on Logarithmic view on Daily Time Frame.
