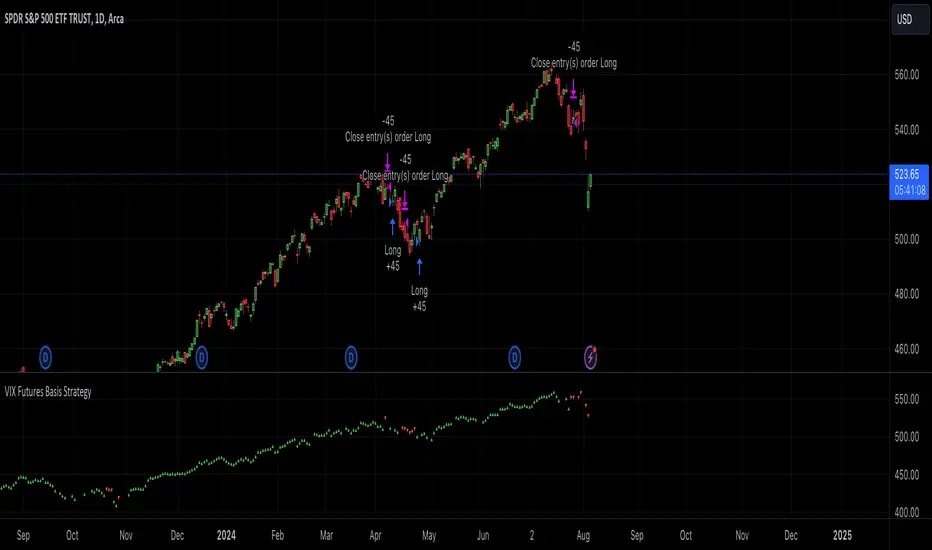
Breadth Thrust Strategy with Volatility Stop-LossThe "Breadth Thrust Strategy with Volatility Stop-Loss" is a trading strategy designed to capitalize on market momentum while managing risk through volatility-based stop-losses. Here's a detailed breakdown of the strategy:
Strategy Overview:
Market Breadth Analysis: The strategy uses the "Breadth Thrust Indicator," which evaluates market momentum by calculating the ratio of advancing stocks to the total number of stocks on the New York Stock Exchange (NYSE). This indicator helps identify bullish market conditions. An optional feature allows for the inclusion of volume data in this calculation, enhancing the signal's robustness.
Signal Generation: A long position is triggered when the smoothed breadth ratio (or the combined breadth and volume ratio) crosses above a specified low threshold (e.g., 0.4). This crossover indicates a potential shift towards positive market momentum.
Key Parameters:
Smoothing Length (length): Defines the period over which the breadth or combined ratio is smoothed using a simple moving average (SMA) to reduce noise and highlight the underlying trend.
Low Threshold (threshold_low): The level below which the smoothed ratio must fall before crossing back above to trigger a long signal.
Hold Periods (hold_periods): The minimum number of periods for which the position will be held once entered, ensuring the strategy captures a meaningful move.
Volatility Multiplier (volatility_multiplier): A multiplier applied to the Average True Range (ATR) to determine the distance of the stop-loss from the entry price, which adjusts according to market volatility.
Trade Management:
Entry Signal: The strategy enters a long position when the smoothed combined ratio crosses above the low threshold, signaling a potential bullish reversal.
ATR-Based Stop-Loss: Upon entering a trade, the strategy calculates a stop-loss level based on the ATR, which measures market volatility. The stop-loss is set at a distance from the entry price, determined by multiplying the ATR by the specified volatility multiplier. This adaptive stop-loss mechanism helps protect the position from adverse market moves.
Stop-Loss Adjustment: While the position is open, the stop-loss level is dynamically updated, ensuring it never decreases (trailing stop-loss effect) but can be adjusted upwards to reflect the latest price action relative to volatility.
Position Closure: The position is closed if:
The market price falls to or below the stop-loss level.
The position has been held for the specified number of periods (hold_periods), after which it is automatically closed.
Additional Settings:
Initial Capital: The strategy starts with an initial capital of $10,000.
Commissions and Slippage: Each trade incurs a commission of $5 per order, and slippage is accounted for at $1 per trade.
Background Highlighting: The chart background turns green when a position is open, providing a clear visual indication of the active trade.
This strategy is designed to identify and capitalize on upward momentum in the market while employing a volatility-adjusted stop-loss to manage risk. By combining market breadth analysis with volatility-based stop-losses, the strategy aims to balance profit potential with protection against sudden market reversals.
Chiến lược Pine Script®