Adaptive Schaff Trend Cycle (STC) [AlgoAlpha]Introducing the Adaptive Schaff Trend Cycle by AlgoAlpha: Elevate Your Trading Strategies 🚀
Discover precision and adaptability with the Adaptive Schaff Trend Cycle 🎯, meticulously crafted for traders seeking an edge in the markets. This advanced tool integrates sophisticated algorithms to offer clear insights and real-time analytics 📈.
Key Features:
⚙️Adaptive Signal Processing: Utilizes evolving calculations to adjust to market changes, offering highly responsive signals.
🔍Enhanced MACD Analysis: Innovates on the traditional MACD, providing new insights into market dynamics through an adaptive lens.
🎨Customizable Visual Experience: Features customizable up and down colors for tailored chart analysis.
🔔Real-Time Alerts: Stay informed with instant alerts on indicator changes.
Quick Guide to Using the Adaptive STC Indicator
1. 🔧 Adding the Indicator: Search for "Adaptive Schaff Trend Cycle (STC) " within TradingView's Indicators & Strategies and apply it to your chart. Customize the settings according to your trading style for optimum results.
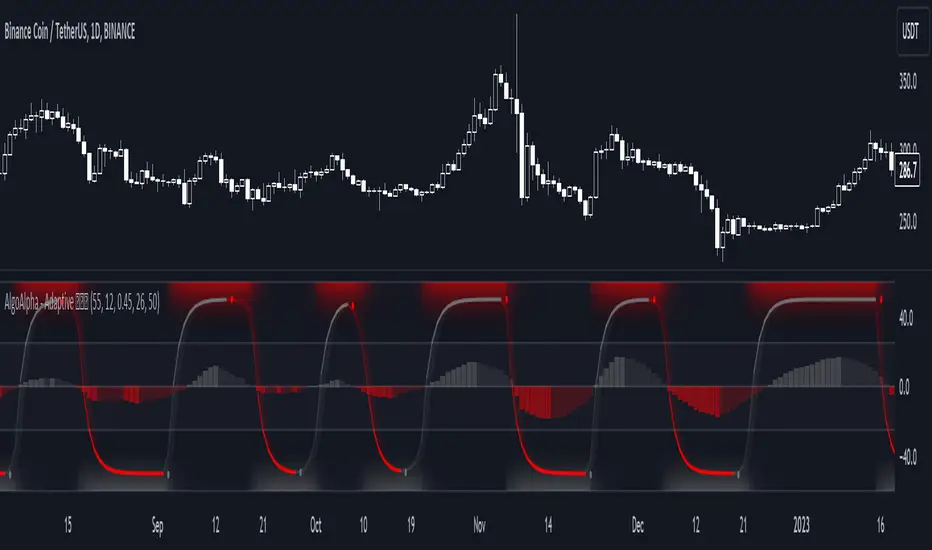
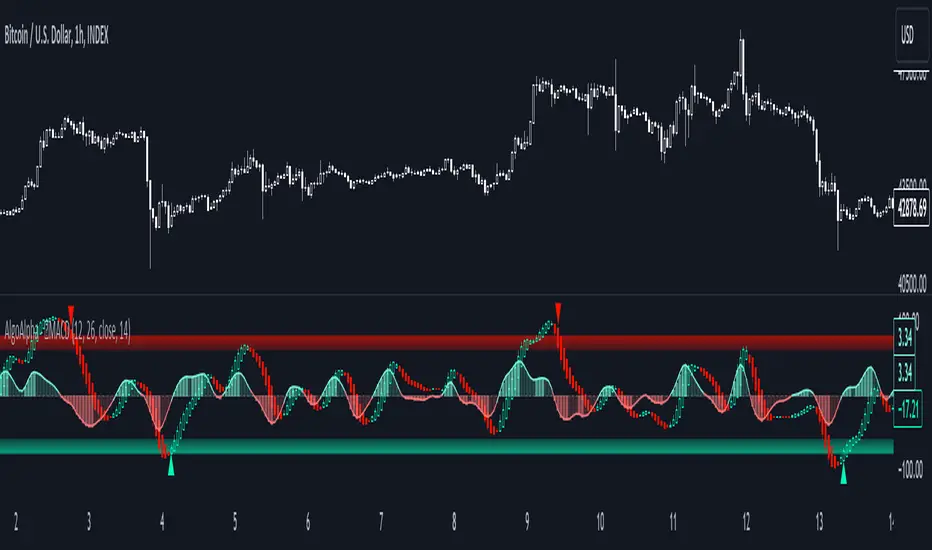
2.👀 Market Analysis: Monitor the STC and Histogram values closely. The indicator's color gradients provide a visual representation of momentum shifts, helping you to identify trends more clearly.
3. 🚨 Set Alerts: Enable alerts for specific conditions like significant moves up or down, or when the histogram crosses zero. This feature ensures you never miss a potential trading opportunity.
How It Works:
The Adaptive Schaff Trend Cycle by AlgoAlpha introduces a dynamic approach to market analysis, refining traditional indicators through adaptive logic to align with fluctuating market conditions. Here's a concise overview of its operation:
🔄 Adaptive MACD Adjustment: The foundation of the indicator is an enhanced MACD calculation, which dynamically adjusts its parameters based on real-time market trends and momentum. This algorithmic adjustment aims to ensure the MACD's responsiveness to market changes, adapting its sensitivity to offer timely insights .
🌟 Integration of Schaff Trend Cycle (STC): After adjusting the MACD, the indicator calculates STC values to provide a smoothed representation of market trends. By normalizing and smoothing the MACD values on a scale from 0 to 100, the STC method helps in identifying market phases with a clear visualization. The smoothing process is designed to mitigate noise and focus on significant market movements .
📊 Visualization and Alerts: To aid in the interpretation of these insights, the Adaptive Schaff Trend Cycle employs color gradients and customizable visual settings to indicate momentum shifts. These visual cues, combined with alert functionalities, are structured to assist traders in monitoring market developments, enabling them to make informed decisions based on the presented data .
🛠️The Adaptive Schaff Trend Cycle thus merges adaptive MACD adjustments with STC methodology, supported by visual and alert features, to create a tool aimed at enhancing market analysis. By focusing on adaptability and current market conditions, it provides a nuanced view of market trends, intended to support traders in their decision-making processes without promising predictive accuracy or reliability .
Chỉ báo Pine Script®