Trendline Cross CountThe Trendline Cross Count indicator is an innovative technical analysis tool that revolutionizes the way traders interact with trendlines. This cutting-edge indicator doesn't just identify trendlines - it quantifies their impact on price action in real-time, providing traders with unprecedented insight into market structure.
Core Functionality:
Trendline Cross Quantification:
At the heart of this indicator is its ability to display the actual number of trendlines being crossed by the current price. The algorithm doesn't just count intersections; it evaluates the significance of each trendline, weighing factors such as trendline duration, number of touch points, and historical reliability.
Dynamic Trendline Generation:
The indicator employs an advanced pivot-based trendline detection system. It continuously scans the chart for significant pivot points and constructs trendlines based on these pivots. The innovation lies in its ability to adapt to changing market conditions, constantly updating its trendline library.
Confluence Analysis:
By tracking multiple trendlines simultaneously, the indicator provides a real-time measure of trendline confluence. This allows traders to identify areas where multiple significant trendlines converge, potentially signaling powerful support or resistance levels.
Key Inputs and Their Significance:
Trendline Source:
This input allows traders to select the price data used for trendline analysis. While the default is the closing price, the flexibility to choose other price points enables traders to tailor the analysis to their specific trading style or market preferences.
Pivot Size:
This crucial parameter defines the lookback period for identifying pivot points. The default value of 3 strikes a balance between sensitivity and reliability, but adjusting this value can dramatically alter the indicator's behavior. Lower values increase sensitivity but may introduce noise, while higher values provide more stable, long-term trendlines.
Pivot Sequence:
This innovative feature allows traders to focus on specific market structures. Options include:
"LL" (Lower Lows): Focuses on downtrends
"HH" (Higher Highs): Emphasizes uptrends
"Any": Provides a comprehensive view of all trendlines
What Makes It Unique:
The Trendline Cross Count indicator stands out due to several groundbreaking features:
Quantitative Trendline Analysis:
While most indicators simply draw trendlines, this tool quantifies their impact, providing a numerical representation of market structure complexity.
Adaptive Pivot Detection:
The indicator's ability to dynamically adjust its pivot detection based on market volatility ensures relevance across all market conditions.
Sequence-Based Filtering:
The unique pivot sequence option allows traders to focus on specific trend types, a feature not found in conventional trendline tools.
Real-Time Confluence Measurement:
By providing a live count of intersecting trendlines, traders gain instant insight into potential support and resistance strength.
Significance Algorithm:
Not all trendlines are created equal. This indicator employs an algorithm to weigh the importance of each trendline, ensuring that the cross count reflects truly significant levels.
This indicator represents a significant advancement in trendline analysis, offering insights that are not readily available through traditional methods. Its ability to quantify trendline interactions in real-time provides traders with a unique edge in understanding market structure and potential price movements. The Trendline Cross Count indicator is not just a tool, but a gateway to a new dimension of technical analysis.
Phá vỡ Đường xu hướng

Price Action Toolkit Lite [UAlgo]The Price Action Toolkit Lite is a comprehensive indicator designed to enhance your chart analysis with advanced price action tools. This powerful toolkit combines multiple technical analysis concepts to provide traders with a clear visualization of market structure, liquidity levels, order blocks, and trend lines. By integrating these elements, the indicator aims to offer a holistic view of price action, helping traders identify potential entry and exit points, as well as key levels of interest in the market.
🔶 Key Features
Market Structure Analysis: The indicator includes a ZigZag feature to highlight significant market highs and lows, aiding in the visualization of market structure changes and trends.
Liquidity Sweeps Detection: It identifies and displays liquidity sweeps, which are crucial for recognizing potential market reversals and areas of interest where significant price action is likely to occur.
Order Blocks: Automatically detects and draws order blocks, highlighting areas of institutional buying and selling pressure, which can serve as key support and resistance levels.
Trend Lines: The toolkit can draw and extend trend lines based on pivot points, providing a clear view of prevailing market trends and potential breakout points.
Customizable Settings: Users can adjust various settings, including the length of the ZigZag, liquidity detection sensitivity, the number of order blocks to display, and trend line detection parameters, allowing for a tailored analysis experience.
🔶 Disclaimer
The "Price Action Toolkit Lite " is intended for educational and informational purposes only.
It is not financial advice and should not be construed as such. Trading in financial markets involves substantial risk, including the risk of loss.
Past performance is not indicative of future results.
🔷 Similar Scripts

Returns Since PivotReturns Since Pivot (RSP) helps to analyze the trend and seasonality.
This indicator draws 2 separate lines
green - upward movement
red - downward movement
Unlike other trend indicators, it's important that even while uptrend you can still see the power of downward moves that occurred during move up.
Hints and setups:
1) Helps to identify clear up trend from the noisy/mixed one: clearly growing non-interrupted green line, without significant negative red lines.
2) Helps to see potential trend reversal: for example, clear strong green line was interrupted for a brief price drop. Then the uptrend continues, you see clear green line again. But -- it's visible that new green line is way less strong, so the price might have exhausted.
3) While trading on 5 min chart, you can set RSP to 1 hour, or 4 hours to get a clear picture of price action on macro timeframe.
4) Indicator is normalized, so you can compare different coins. For example, after the big drop and rebound, you can use RSP to understand which coin had more powerful rebound, thus potentially will be a best gainer in case if the market continues go up.

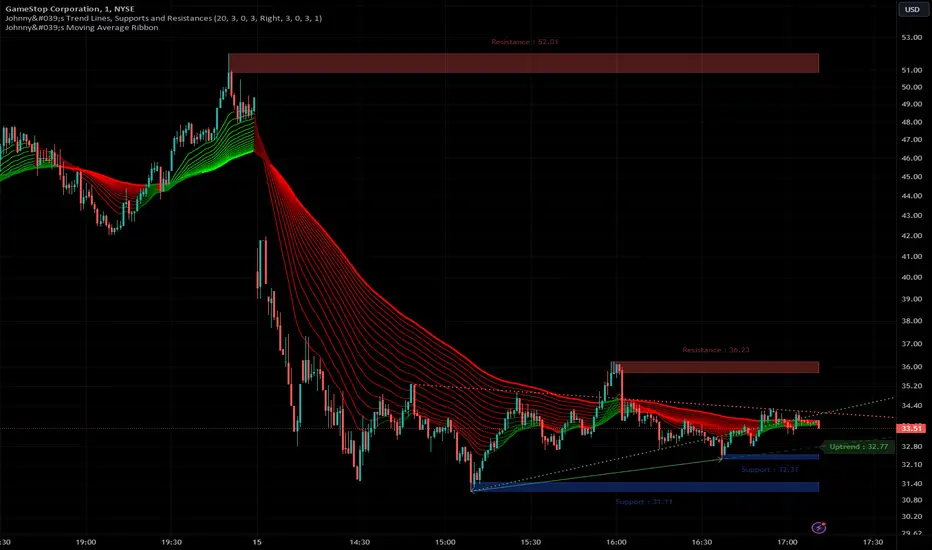
Johnny's Trend Lines, Supports and ResistancesInspired and based on ismailcarlik's Trend Lines, Supports and Resistances.
Additions include an overall upgrade to Pinescript v5, changes in the way resistance and support levels are calculated, improved visual queues, and additional customization options.
This indicator is meticulously crafted to provide traders with visual tools for identifying trend lines, support, and resistance levels, enhancing the decision-making process in trading activities.
Features and Functionality
Trend Lines: The indicator allows users to enable or disable trend lines, adjust the number of points to check for establishing a trend, and set parameters for trend validation, including the maximum violation and exceptions for the last bars.
Support and Resistance: It offers tools to identify and visualize key support and resistance levels based on recent pivot points. This includes adjustable parameters for the maximum violations allowed and the exclusion of recent bars from the analysis.
Pivot Points: Users can define the pivot length for calculating highs and lows, which helps in marking significant pivot points that are instrumental in trend analysis.
Alerts and Notifications: The indicator is equipped with customizable alerts for trend line breaches and pivot point formations, which can be set to trigger at different frequencies based on user preference.
How It Works
Input Flexibility: Users can adjust various settings like the length of trend lines and pivot points, enabling or disabling specific features like marking pivots, and managing alert settings directly from the indicator’s input panel.
Dynamic Analysis: By analyzing the price action relative to the calculated trend lines and pivot points, the indicator dynamically identifies potential trend reversals, continuations, and significant price levels.
Visualization: It plots trend lines and marks support and resistance levels directly on the chart, with options to extend these lines and add labels for better clarity. Violated trend lines can be visually differentiated by changing their style and width.
Practical Application
Trend Line Strategy: Traders can use the trend lines to determine the strength of the current market trend and to spot potential reversal points.
Support and Resistance Strategy: By marking where the price has historically faced resistance or found support, traders can plan entry and exit points, set stop-loss orders, or identify breakout opportunities.
Pivot Points Strategy: Pivot points serve as vital indicators for intraday trading or long-term trend analysis, providing insights into potential support and resistance levels.
Customization and Alerts
Custom Alerts: Traders can set alerts for when the price crosses trend lines or when new support or resistance levels are formed, helping them stay informed of critical market movements without having to continuously monitor the charts.
Visual Customization: Users can personalize the appearance of trend lines and labels, choosing from a variety of colors and styles to match their chart setup or preferences.
"Johnny's Trend Lines, Supports and Resistances" is an essential tool for traders who rely on technical analysis, offering detailed insights and real-time updates on market conditions, trend strength, and potential price barriers.
Jemmy Trade Whales Multiple Signal Options - Nine in One $$$This script is a combination of several indicators and trading strategies.
Let's break down each part:
1. MACD Indicator (My MACD Indicator – Nabil's Version): This calculates the Moving Average Convergence Divergence (MACD) using Heikin Ashi candles. It uses Exponential Moving Averages (EMA) to compute the fast and slow lengths and then calculates the MACD line, signal line, and histogram based on the difference between these EMAs.
2. Smoothed Moving Average (SMMA): This calculates a smoothed moving average using a user-defined length.
3. Least Squares Moving Average (LSMA): This calculates a least squares moving average using a user-defined length.
4. High Low SAR - Nabil's Version: This section calculates various levels based on SAR (Stop and Reverse) indicator. It also plots lines based on certain conditions and includes SAR lines with specific properties.
5. Volume-Weighted Hull Moving Average (VHMA) - Nabil's Version: This calculates a volume-weighted Hull moving average.
6. SAR (Stop and Reverse): This calculates the SAR indicator with user-defined parameters.
7. Mean Reversion Strategy: This part calculates upper and lower bands based on a multiplier of Standard Deviation from a mean. It also generates buy and sell signals based on crossing these bands.
8. SSL Hybrid - Nabil's Version: This calculates various indicators like SSL (Stochastic Scaled Levels), ATR (Average True Range) bands, and Keltner Channels. It also plots buy and sell signals based on certain conditions.
9. Buy Signal Options: This section defines several conditions for generating buy signals based on different combinations of indicators and plots corresponding buy signals.
Each section seems to be relatively independent and focused on calculating specific indicators or trading strategies. The script combines these components to provide a comprehensive trading setup with various buy signal options based on user preferences.
BUY SIGNALS EXPLAINATION:
1. MAIN - Price: This signal triggers when the current candle's close price crosses above the lookback average line (lookbackavg). It indicates a bullish momentum when the price moves above the average line.
2. MAIN - Price - SMMA - LSMA / Crossing: This signal combines multiple conditions:
• The current candle's close price crosses above the lookback average line.
• The smoothed moving average (SMMA) crosses above the lookback average line.
• The least squares moving average (LSMA) crosses above the lookback average line. This signal confirms a bullish trend when all three moving averages cross above the average line simultaneously.
3. MAIN - Price - (SMMA > LSMA) / No Crossing: This signal triggers when the following conditions are met:
• The current candle's close price crosses above the lookback average line.
• The SMMA is above the LSMA. This signal confirms a bullish trend when the SMMA remains consistently above the LSMA without crossing.
4. MAIN - Price - SMMA - LSMA - SAR - SSL / Crossing: This signal combines multiple conditions:
• The current candle's close price, SMMA, and LSMA cross above the lookback average line.
• The SAR (Stop and Reverse) indicator is above the SSL (Stochastic Scaled Levels). This signal indicates a strong bullish momentum when all conditions align.
5. MAIN - Price - (SMMA > LSMA) - SAR - SSL / No Crossing: This signal triggers when the following conditions are met:
• The current candle's close price crosses above the lookback average line.
• The SMMA is consistently above the LSMA.
• The SAR is above the SSL. This signal confirms a bullish trend without any crossing of moving averages.
6. MAIN - Price - SMMA - LSMA - SAR - SSL / Crossing - Coloring: Similar to signal 4, this signal additionally checks for specific colors of SAR and SSL lines to confirm a bullish momentum.
7. MAIN - Price - (SMMA > LSMA) - SAR - SSL / No Crossing - Coloring: Similar to signal 5, this signal also checks for specific colors of SAR and SSL lines to confirm a bullish trend without any crossing of moving averages.
8. MAIN Support line - 2 Candles: This signal triggers when the price pulls back from below the support line within the last two candles. It indicates a potential reversal from a support level.
9. MAIN Support line - lookBack Candles: This signal is similar to signal 8 but considers a specified lookback range for checking the pullback from below the support line.
These buy signals aim to identify various bullish scenarios based on combinations of price action, moving averages, SAR, and SSL indicators. Each signal offers different levels of confirmation for potential buying opportunities in the market.
USE IT WITH YOUR RISK MANAGEMENT STRATEGIES.
Future Updates "Coming Soon"
Targets - Under processing.
Stop loss - Under Processing.
Trailing - Under Processing.
Historical Data Table - Under processing.
Strength Table - Under Processing.
Whales Catcher - Under Processing.
Order Book Analyzer - Under Processing.
NABIL ELMAHDY $$

Bull Bear Trend IndicatorIntroduction: Origin of the Swing Point Indicator
In the quest for a reliable indicator that accurately predicts trend directions and identifies valid highs and lows, the genesis of the Swing Point Indicator emerged. Faced with the challenge of finding a tool that provided comprehensive market analysis and actionable insights, the need for a novel solution became evident. Combining insights gleaned from market analysis and innovative algorithmic approaches, the Swing Point Indicator was born.
Enhanced Feature: Highs and Lows Labeling in Trend Direction
In addition to its core functionalities, the Swing Point Indicator incorporates an advanced feature that enhances the visualization of trend direction. This feature provides further clarity by selectively labeling highs and lows based on the prevailing trend, reinforcing the identification of higher highs and lower lows in uptrends and downtrends, respectively. Overlapping labels on highs and lows signify a potential trend change, providing traders with valuable insight into market reversals.
Detailed Description:
1. Uptrend Labeling:
- Higher Highs (Green Label with Price): In an uptrend, where higher highs are observed, the indicator labels these points with vibrant green color and includes the corresponding price value. This visually highlights the significance of higher highs as pivotal points in the upward trajectory of prices.
- Higher Lows (Red Marker without Text or Diamond): To complement the identification of higher highs, higher lows are marked with a distinct red marker or diamond, devoid of any accompanying text. While these points are crucial in delineating the ascending trend, their emphasis lies in their role as support levels, providing a foundation for upward price movements.
2. Downtrend Labeling:
- Lower Lows (Red Label with Price): Conversely, in a downtrend characterized by lower lows, the indicator labels these points with conspicuous red color, accompanied by the corresponding price value. Lower lows signify critical levels of downward price momentum, acting as indicators of potential bearish continuation.
- Lower Highs (Green Marker without Text or Diamond): Lower highs, indicative of downward retracements in a downtrend, are marked by distinctive green markers or diamonds without accompanying text. While these points denote temporary pauses or pullbacks in the bearish trend, their emphasis lies in their role as resistance levels, impeding upward price movements.
Functionality and Utility:
- Customizable Lookback Candle Count: Traders have the option to adjust the lookback candle count, which is set by default at 108 candles in the settings. This flexibility allows traders to tailor the indicator to their specific trading preferences and timeframes.
- Equal Highs or Lows Option: When enabled, the Swing Point Indicator can identify equal highs or equal lows, providing traders with additional insight into market dynamics.
- Formation Confirmation: A new higher high along with its higher low or a new lower low along with its lower high is confirmed after two candles have closed following the swing point candle. This ensures the reliability of the identified trend direction.
Conclusion:
The incorporation of selective labeling for highs and lows based on trend direction, alongside the introduction of customizable settings and formation confirmation criteria, enhances the effectiveness of the Swing Point Indicator. This feature-rich tool empowers traders with a nuanced understanding of market dynamics, highlighting critical price levels and trend reversals. By offering enhanced visualization, customizable options, and confirmation criteria, the Swing Point Indicator equips traders with the confidence and precision needed to navigate the markets successfully, contributing to more informed and profitable trading strategies.

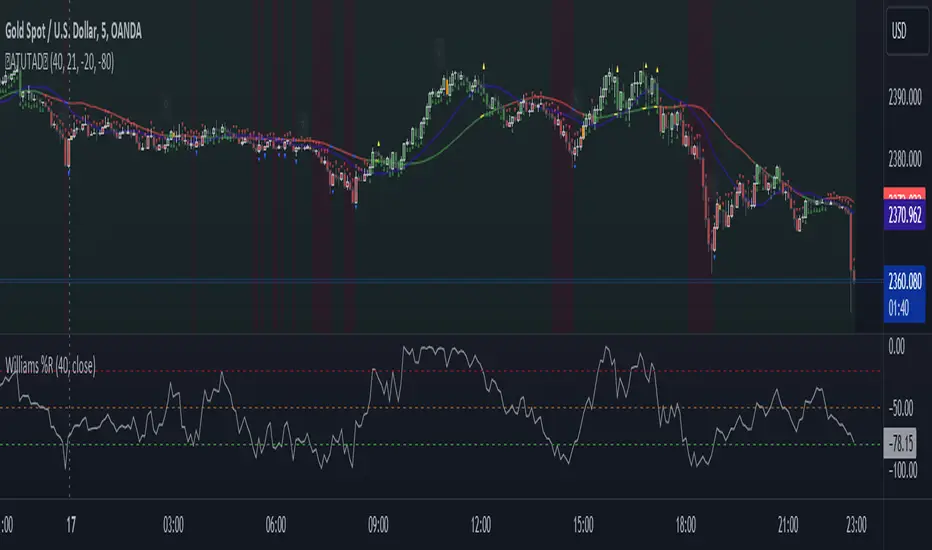
AllTheUpsTheresAlwaysDowns "AllTheUpsTheresAlwaysDowns" ☆ATUTAD☆ // w%r + ma indicator designed for forex trading.
This indicator combines the Williams %R, moving averages, and session tracking.
Key Inputs:
Williams%Range Period: Adjusts the sensitivity of the Williams %R calculation.
Moving Average Period: Defines the period for the moving average used in the indicator.
Overbought and Oversold Thresholds: Sets the thresholds for identifying overbought and oversold conditions.
Features:
Williams %R Calculation: Calculates the Williams %R, a momentum oscillator that measures overbought and oversold levels.
Moving Averages: Plots two moving averages to capitalize on and visualize trend direction.
Session Tracking: Identifies the start and end of trading sessions (Tokyo, London, New York) for better session-based analysis.
Signal Generation: Generates buy/sell signals based on Williams %R levels and moving average crossovers.
Color Coding: Visualizes color-coded bars and shapes to highlight different market conditions and signal types.
Alerts: For buy/sell signals and overbought/oversold conditions to prompt timely actions.
Usage Tips:
Interpret Signals: Trend direction through buy/sell signals and overbought/oversold trend,- reversal / breakout line conditions for potential trading opportunities.
Session Awareness: Take into account the trading sessions (Tokyo, London, New York) to move along with the market dynamics during different times of the day.
Confirmation: Use additional technical analysis tools to confirm signals before executing trades. For example the Williams Percetange Range indicator.
Risk Management: Trade with proper risk management strategies to avoid potential losses.
HappyTrading
Trend Lines with Break Signals [UAlgo]🔶 Description:
The "Trend Lines with Breaks " indicator is designed to identify and visualize trend lines on a price chart, allowing traders to observe potential trend reversals or continuations. This script implements a method to draw trend lines based on pivot points (highs and lows) within a specified sensitivity range. It also provides an option to display breaks in these trend lines, aiding traders in recognizing significant market movements.
🔶 Key Features:
Trend Line Sensitivity Adjustment: Users can adjust the sensitivity of the trend lines using the "Trend Line Sensitivity" parameter, allowing customization based on market conditions and preferences.
Visualization of Trend Lines: The indicator visually represents trend lines on the chart, distinguishing between upward and downward trends. Users can customize the appearance of these trend lines, including color, style, and width.
Detection of Trend Line Breaks: Trend line breaks are identified by comparing the current price with the slope of the trend line. If the price breaks below (for bullish trend lines) or above (for bearish trend lines) the slope of the trend line, indicating a potential reversal, a "B" label is displayed on the chart. Trend line breaks are only displayed if the "showBreaks" parameter is enabled.
Before Bearish Trend Line Break :
If the price "Close" value closes above the trend line :
Before Bullish Trend Line Break :
If the price "Close" value closes below the trend line :
🔶 Disclaimer:
Not Financial Advice: This indicator is intended for educational and informational purposes only. It does not constitute financial advice or recommendations to buy, sell, or hold any financial instruments.
Use at Own Risk: Trading involves substantial risk of loss and is not suitable for all investors. Users of this indicator should exercise caution and conduct their own research and analysis before making any trading decisions.
Performance Not Guaranteed: Past performance is not indicative of future results. While the indicator aims to assist traders in analyzing market trends, there is no guarantee of accuracy or success in trading operations.

TrendLine Toolkit w/ Breaks (Real-Time)The TrendLine Toolkit script introduces an innovating capability by extending the conventional use of trendlines beyond price action to include oscillators and other technical indicators. This tool allows traders to automatically detect and display trendlines on any TradingView built-in oscillator or community-built script, offering a versatile approach to trend analysis. With breakout detection and real-time alerts, this script enhances the way traders interpret trends in various indicators.
🔲 Methodology
Trendlines are a fundamental tool in technical analysis used to identify and visualize the direction and strength of a price trend. They are drawn by connecting two or more significant points on a price chart, typically the highs or lows of consecutive price movements (pivots).
Drawing Trendlines:
Uptrend Line - Connects a series of higher lows. It signals an upward price trend.
Downtrend Line - Connects a series of lower highs. It indicates a downward price trend.
Support and Resistance:
Support Line - A trendline drawn under rising prices, indicating a level where buying interest is historically strong.
Resistance Line - A trendline drawn above falling prices, showing a level where selling interest historically prevails.
Identification of Trends:
Uptrend - Prices making higher highs and higher lows.
Downtrend - Prices making lower highs and lower lows.
Sideways (or Range-bound) - Prices moving within a horizontal range.
A trendline helps confirm the existence and direction of a trend, providing guidance in aligning with the prevailing market sentiment. Additionally, they are usually paired with breakout analysis, a breakout occurs when the price breaches a trendline. This signals a potential change in trend direction or an acceleration of the existing trend.
The script adapts this methodology to oscillators and other indicators. Instead of relying on price pivots, which can only be detected in retrospect, the script utilizes a trailing stop on the oscillator to identify potential swings in real-time, you may find more info about it here (SuperTrend toolkit) . We detect swings or pivots simply by testing for crosses between the indicator and its trailing stop.
type oscillator
float o = Oscillator Value
float s = Trailing Stop Value
oscillator osc = oscillator.new()
bool l = ta.crossunder(osc.o, osc.s) => Utilized as a formed high
bool h = ta.crossover (osc.o, osc.s) => Utilized as a formed low
This approach enables the algorithm to detect trendlines between consecutive pivot highs or lows on the oscillator itself, providing a dynamic and immediate representation of trend dynamics.
🔲 Breakout Detection
The script goes beyond trendline creation by incorporating breakout detection directly within the oscillator. After identifying a trendline, the algorithm continuously monitors the oscillator for potential breakouts, signaling shifts in market sentiment.
🔲 Setup Guide
A simple example on one of my public scripts, Z-Score Heikin-Ashi Transformed
🔲 Settings
Source - Choose an oscillator source of which to base the Toolkit on.
Zeroing - The Mid-Line value of the oscillator, for example RSI & MFI use 50.
Sensitivity - Calibrates the Sensitivity of which TrendLines are detected, higher values result in more detections.
🔲 Alerts
Bearish TrendLine
Bullish TrendLine
Bearish Breakout
Bullish Breakout
As well as the option to trigger 'any alert' call.
By integrating trendline analysis into oscillators, this Toolkit enhances the capabilities of technical analysis, bringing a dynamic and comprehensive approach to identifying trends, support/resistance levels, and breakout signals across various indicators.

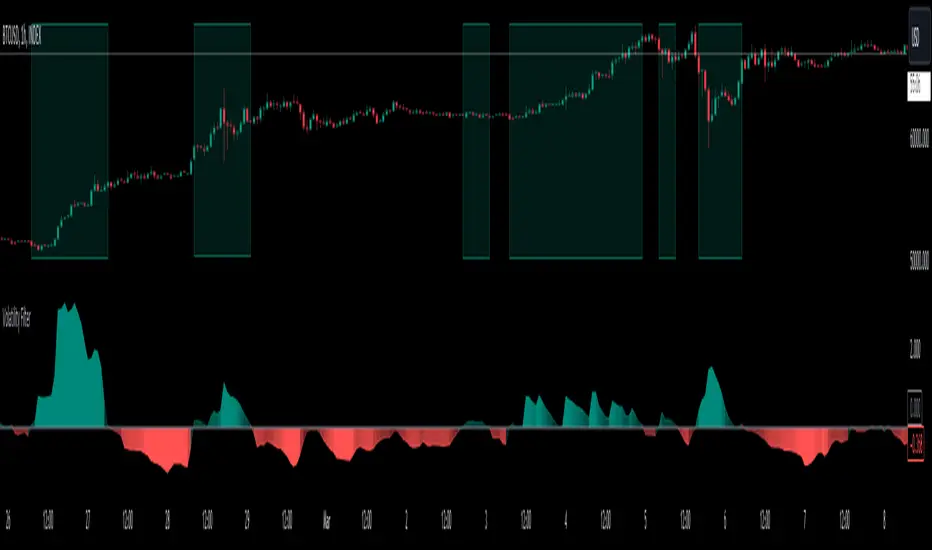
Volatility Filter v2VF v2 is a new iteration of my tool designed for traders who wish to gain a deeper understanding of market dynamics, specifically to distinguish periods of high volatility, which often correspond to strong market trends. By identifying these periods, traders can make more informed decisions, potentially leading to better trading outcomes.
Understanding Market Volatility:
At the heart of this script lies the concept of market volatility, a statistical measure reflecting the degree of variation in trading prices. Volatility is pivotal for traders; it provides insights into the market's emotional state, indicating periods of uncertainty or confidence. High volatility often correlates with strong trends, making it a critical indicator for trend-followers. By identifying when volatility crosses a certain threshold, traders can discern whether the market is likely to be in a trending phase or a more subdued, range-bound state.
How the Script Works:
The core functionality of the script revolves around a signal line that oscillates around a zero threshold. When the signal line is above zero, it indicates increased market volatility, suggesting the presence of a trend. The farther the oscillator deviates from zero, the stronger the implied trend. This mechanism enables traders to visually gauge market conditions and adjust their strategies accordingly.
Controlling the Indicator:
To cater to diverse trading styles and preferences, the script is equipped with several customizable settings:
Filter Threshold: This 'zero line' acts as the baseline for distinguishing between different volatility regimes. Crossing this threshold is a primary signal for changes in market volatility.
Moving Average Type: With over 30 types of moving averages to choose from, traders can select the one that best fits their analysis style. Each type offers a different perspective on price data, allowing for a tailored approach to trend identification.
Colorize Indicator: This feature enhances the visual representation of the indicator, making it easier to interpret. When enabled, the oscillator's color intensity varies with its proximity to the extremes, providing a quick visual cue about trend strength.
Advanced Settings – Length and Multiplier:
The script introduces an innovative approach to time frame analysis through its length and multiplier settings:
Length: This parameter sets the base period for all metrics within the script, similar to traditional indicators.
Multiplier: This unique feature differentiates the script by incorporating three distinct timeframes into the analysis: a lower timeframe, the main (current) timeframe, and a higher timeframe. The multiplier adjusts these timeframes relative to the main one. For instance, with a daily main timeframe and a multiplier of 2, the lower timeframe would be 12 hours, and the higher timeframe would be 2 days. This tri-timeframe approach aims to provide a more comprehensive volatility assessment.
Volatility Filter Indicators Section:
The script utilizes nine different, undisclosed metrics within its volatility filter. Traders have the flexibility to enable or disable these metrics based on their preferences, allowing for a customizable trading experience. Additionally, the script offers alert functionality for when the indicator crosses the threshold, either upwards or downwards, facilitating timely decision-making.
P.S
With better understanding of markets over time, I designed a new iteration of my volatility filter indicator. The second version provides faster, more precise way to analyze markets, but I also wanted to keep my first version untouched in case if some people find it better for their purposes. As I mentioned above, this version is calculated in a very different way from a previous one, so if you never tried it you can do it here
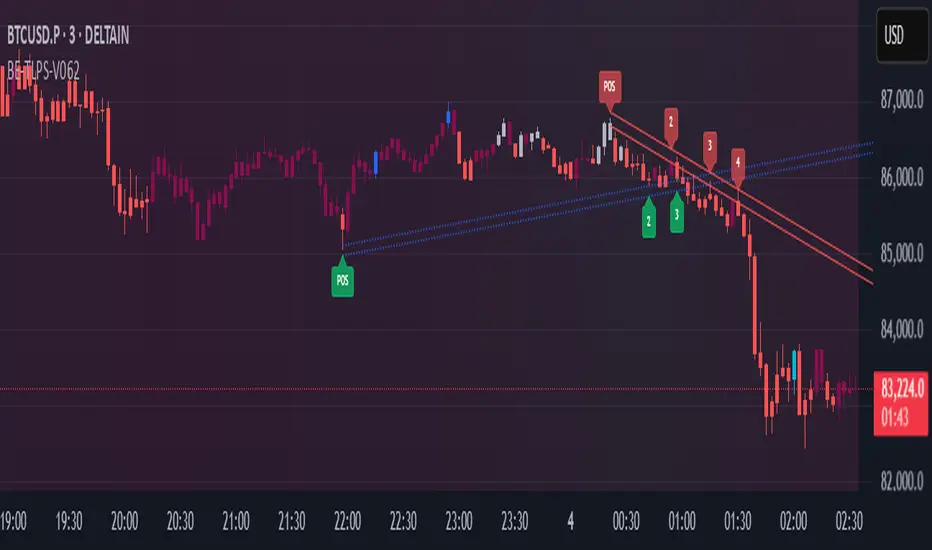
Liquidity Trendline With Signals [BigBeluga]The Liquidity Trendline is an indicator designed to identify potential breakouts by utilizing pivot points. These pivotal moments can trigger significant market reactions, either by breaking out or by serving as breakout and retest signals.
🔶 FEATURES
The indicator contains the following features:
Period of the calculation
Padding (spacing between the 2 lines)
Signal for breakouts
🔶 USAGE
As shown in the example, breakouts can be powerful points to see reversions in the market and can lead to a lot of volatility in the market.
When a trendline is broken, a signal will be plotted; the user can disable/enable those signals.
A trendline is formed when 2 consecutive pivot points are found, each of them lower or higher than the previous one. this is the anchor point for our trend line that we will use to spot rejection or breakouts
The delay in the creation of those trend lines will be the period input used to find the pivot point on the chart.
Another good example is using these trendlines as simple retests.
Prices bouncing on top of them will suggest a possible continuation of the current trend.
We can filter out stronger breakouts by looking at how many times the price has rejected the trendline, more rejections will result in more liquidity once the price breaks it.
Signals are plotted on the chart for every breakout that happens.
Another good utility is simply using them as retest once the price breaks those levels and holding above/below them, indicating a possible support or resistance area used for confluence
Here is another good example of how we can correctly spot price deviating from our trendline and spotting powerful continuation in price.
As said before we can filter out bad and good breakouts simply by looking at how many times rejected from those levels.
More rejection will result in a stronger reaction
🔶 CONCLUSION
This script is as simple as that and can be used in a few ways to spot reversals, price continuation, or even sentiment in price (bullish or bearish).

TrendLine ScythesTrendline Scythes is a script designed to automatically detect and draw special curved trendlines, resembling scythes or blades, based on pivotal points in price action. These trendlines adapt to the volatility of the market, providing a unique perspective on trend dynamics.
🔲 Methodology
Traditional trendlines connect consecutive pivot points on a price chart, providing a linear representation of trend direction. However, this script employs a distinctive methodology by automatically detecting price pivots and then calculating special curved trendlines based on the Average True Range (ATR) of the price. This introduces a curvature to the trendlines, resembling scythes, offering a unique way to interpret market trends.
🔲 Auto Breakout and Target Detection
Trendline Scythes includes features for automatic breakout detection, signaling potential trend changes. Additionally, the script assists in target detection, helping traders set realistic and data-driven profit-taking levels based on market volatility and user adjustment.
🔲 Utility
Trend Confirmation - Use Trendline Scythes to confirm existing trends by observing how price interacts with the curved trendlines.
Breakout Signals - Auto-detection of breakouts adds a proactive element to your trading strategy, helping you stay ahead of potential trend reversals.
Target Setting - Utilize the script to set profit-taking targets based on volatility, aligning with the current market conditions.
🔲 Settings
Pivot Length - Swing detection length
Scythe Length - Adjusts the length of the scythes blade
Sensitivity - Controls how restrained the target calculation is, higher values will result in tighter targets.
🔲 Alerts
Breakout
Breakdown
Target Reached
Target Invalidated
As well as the option to trigger 'any alert' call.
Trendline Scythes is a versatile tool combining the benefits of traditional trendlines with the dynamic adaptability of curved lines for a unique approach to trend analysis.

Break of Structure with trend table by GadatasThis indicator is designed to identify and track swing highs and lows in a given market on chart timeframe. It plots these swing highs and lows as solid lines on the chart. The indicator allows for customization of the line color and width. The selected timeframe trend is visually represented in a table located in the upper right corner of the chart. To enhance consistency, the background color of the timeframe column now elegantly matches the color of the BOS line.
The indicator follows specific rules to determine when a new high or low is created. If the current range is considered bullish (meaning the most recent breakout was to the topside), the indicator will only update the low if a candle's body falls below the current low. However, if the current range is bearish (most recent breakout to the downside), the indicator will only update the high if a candle's body rises above the current high.
When a range is identified as bullish, the indicator will continue updating the high until a swing high is formed, denoting the high of the range. The high will only change if a candle's body surpasses the previous high. The low, on the other hand, will be updated based on the last time a candle's body falls below a previous candle's low. The lowest low after this condition is met will be assigned as the low of the range.
Conversely, when a range is identified as bearish, the indicator will continue updating the low until a swing low is formed, denoting the low of the range. The low will only change if a candle's body falls below the previous low. The high, in this case, will be updated based on the last time a candle's body rises above a previous candle's high. The highest high after this condition is met will be assigned as the high of the range.
Swing highs are determined by having lower highs to the left and right, while swing lows have higher lows to the left and right. These swings are used to determine the final high or low of a bullish or bearish range, respectively.
Tis Indicator differs from other indicators by incorporating this concept to track market structure. The indicator assumes that significant market players sell before making heavy purchases in bullish ranges and buy before selling heavily in bearish ranges. The lines on the chart represent prior highs and lows, as well as the current updated highs and lows based on this theory. By using this indicator, one can gain insights into the structure of price movement and potentially identify bullish or bearish continuations. It can also provide confluence when analyzing multiple timeframes to validate trend-following strategies.
Open-source script.
It now displays both short and long condition changes along with their respective arguments:
1. In the case of a high Bos line break followed by a fall, a very long condition change is made when at least three breaks of Bos Low are observed, transitioning from very short to short then distribution , and after that to long.
2. Short conditions are indicated when a high Bos falls and the condition changes from very long to long and then accumulation, short, and very short with each break.
Additionally, the break counter column now shows positive numbers for long situations, indicating each low Bos break, and negative numbers for short situations, indicating each high Bos break.
The background color of the break counter column now changes to green for positive numbers and red for negative numbers.

Trend Lines [LuxAlgo]Our new "Trend Lines" indicator detects and highlights relevant trendlines on the user chart while keeping it free of as much clutter as possible.
The indicator is thought for real-time usage and includes several filters as well as the ability to estimate trendline angles.
🔶 USAGE
Trendlines can act as support/resistance, with a higher number of tests indicating a more significant support/resistance role.
A broken TrendLine can be indicative of a potential trend reversal. The script highlights breaks with a label.
Users can additionally filter trendlines, only showing trendlines whose angles fall within a user set range:
This allows for the removal of potential clutter from the chart but also helps keep steeper or more horizontal trendlines.
🔶 DETAILS
When a swing (pivot point) is found, a Trendline is drawn when certain conditions are fulfilled.
An essential condition is that a Bearish Trendline (red) always occurs on a lower high, while a Bullish Trendline (blue) occurs on a higher low.
Our implementation will first show an initial dotted-styled TrendLine on confirmation, after which a solid-styled secondary TrendLine will develop. The latter will be used for the real-time detection of breaks at that line:
Furthermore, the script allows you to add more conditions:
🔹 Length (Swings)
A swing develops when a high/low is the highest/lowest against x highs/lows on the left AND right of that bar. x can be set by "Length" in settings.
The following images clarify this. The script confirms a swing where the yellow flag is shown; the high (here visualized with a purple label) is the highest point against x bars left and right of that point.
At that moment, this swing is checked against the previous swing. If all conditions are fulfilled, an initial TrendLine is drawn on confirmation.
After that point, a secondary thicker solid line is seen which keeps progressing bar after bar, until:
• a new TrendLine is formed
• the TrendLine is broken
🔹 Breaks between Swings
Once there is confirmation that a TrendLine can be drawn, the script allows you to filter for breakthroughs on that line. This can be set with "Check breaks between"
Disabled : the initial TrendLine is allowed to be pierced:
Check breaks between point A - point B : no breaks are allowed between both Swing points:
Point A - Current bar : no breaks are allowed between the first Swing point and the point of confirmation ('current' bar):
🔹 TrendLine breaks
As mentioned, the secondary TrendLine (solid line) progresses bar after bar until a new TrendLine is formed or the TrendLine is broken. When a TrendLine is broken, the TrendLine stops progressing, but if there isn't a new TrendLine and price return back, the TrendLine will re-appear, potentially giving several signals when the TrendLine is broken again.
Minimal bars allow you to regulate the amount of signals when the TrendLine is broken.
-> The secondary TrendLine must be uninterrupted for at least x bars before a potential break can be considered.
The following example shows 1 signal against 3 by adjusting this setting from 2 to 5:
🔹 Angles
Angles should normally be calculated when the units of the X and Y axis are the same. However, on our charts, the unit of the X-axis is bar_index (bars), and on the Y-axis the unit is price (¥, €, £, $,...).
It is not easy to normalize and create reasonably valid angles. Often certain angle calculations can differ through price changes or volatility.
Our calculate_slope() function tries to make corresponding angles through all bars.
We do this by calculating the difference between the highest/lowest price values in a certain bar range. The bar range is our X-axis, and the price difference is our Y-axis.
Zooming in/out will not change the amount of bars or the price. Since it does change our view on the chart, and thereby how we see the angles, we have included a setting where you can personalize the ratio between X and Y-axis (Angles -> Ratio X-Y axis).
Settings: Angles - Ratio X-Y axis:
🔶 SETTINGS
🔹 Swings
Length: Lookback period for the detection of swing points.
🔹 Trendline validation
Check breaks between :
Disabled : the initial TrendLine is allowed to be pierced
Check breaks between point A - point B : no breaks are allowed between both Swing points
Point A - Current bar : no breaks are allowed between the first Swing point and the point of confirmation ('current' bar)
Source (breaks) : Source which invalidates TrendLine, default: close
🔹 TrendLine breaks
Minimal bars : The secondary TrendLine must be uninterrupted for at least x bars before a potential break can be considered.
🔹 Angles
Show : Toggle labels.
Ratio X-Y axis : Every user has his preferences regarding zoom, chart layout,...
If the shown angles are not according to your expectations, you can adjust this number.
Only TrendLine between : Only allow TrendLines between the minimum and maximum degrees. Set only the minimal and maximum values above 0.

MAutoFloorCeiling* MAutoFloorCeiling Indicator *
The MAutoFloorCeiling indicator is a powerful algorithm utilizing Wyckoffian concepts of Supply, Demand, and Volume Climaxes to determine and draw Support / Resistance levels automatically. It is the culmination of over 2 years of research. Drawing Support / Resistance lines automatically is a tremendous benefit to the trader as this provides structure to price and exposes market movement as well as which areas price is likely to respect or break out of.
* WHAT THE SCRIPT DOES *
The MAutoFloorCeiling algorithm draws Floor and Ceiling lines automatically. The price points at which these lines are drawn at are areas of increasing Supply, Demand, or Volume Climax respective to their Price Levels. Areas of Volume Climaxes are often respected by price, since price tends to return to them or break out of them, and hence form powerful Support / Resistance levels.
* HOW TO USE IT *
Floor and Ceiling lines correspond to Support and Resistance lines. When a line is draw consider the following questions
Is it a top / bottom?
Is it support / resistance?
Is it a breakout / breakdown?
Is it a pullback?
* HOW IT WORKS *
1. There are 2 types of lines: Floors and Ceilings
2. A Floor Line is drawn when there is a "Selling Volume Bias" (Volume Climaxes on downward price movement)
More Floor Lines get drawn if market continues to go lower combined with a "Selling Volume Bias"
3. A ceiling line is drawn when there is a "Buying Volume Bias" (Volume Climaxes on upward price movement)
More ceiling lines get drawn if market continues to go higher combined with a "Buying Volume Bias"
4. There is a 1 bar delay to confirm the creation of a new floor / ceiling line.
Once the new floor / ceiling is created, it draws forward with no delay.
* EXAMPLE AND USE CASES *
MAutoFloorCeiling draws lines that can be used as effective Support / Resistance Levels, Breakout Lines, and Pullback areas. Studying the Volume at these levels can provide insight as to where price is likely to go.
You can scan for Trend Like behavior such as
More Demand on Higher High = Increase in Volume on a Higher Ceiling
More Supply on Lower Low = Increase in Volume on a Lower Floor
You can scan for divergences such as
Less Demand on Higher High = Lower volume on a Higher Ceiling
Less Supply on on Lower Low = Lower volume on a Lower Floor
Pullbacks
A lower ceiling is representative of a pullback when price is going down.
A higher floor is representative of a pullback when price is going up.
You can inspect instances where the thrust of price is shortened, which means the distance between Ceiling or Floor lines becomes less as price struggles to continue in the direction it was moving. Or conversely the thrust of price as shown by the Floor / Ceiling lines can expand, which is indicative of a trend forming.
* AUTHOR *
This script is published by MBoxWave LLC

TrendLine CrossThis indicator "TrendLine Cross", is designed to plot trend lines so you can spot potential trend reversal points on the charts. The main function is to draw several lines on the chart and identify the crossings between these lines, which can be significant indicators for trading. The lines are based on different periods which can be changed in the settings tabs.
Let's see the characteristics of the trend lines:
_Low Line Color(Green Line): This line connects the lowest point of low prices in the "low_time" period with the lowest point of low prices in the "high_time" period. Indicates a possible short-term support level on the chart.
_Liquidity Up Line Color (Golden Line): This line connects the lowest point of low prices in the "low_time" period with the highest point of low prices in the same period. It represents a liquidity zone and an important resistance in the chart.
_Lower Line Color (Blue Line): This horizontal line connects the lowest point of low prices in the "LowerLine_period" with the lowest point of low prices in the "high_time" period. Indicates a possible long-term support level.
_Upper Line Colorr: This line represents a connection between the highest points of the "high_time" period and the lowest point of the "LowerLine_period". Indicates a possible long-term resistance level.
_Up Line Color (Red Line): This line connects the highest point of high prices in the "high_time" period with the highest point of high prices in the "LowerLine_period". It represents a possible long-term resistance level.
_Liquidity Down Line Color(Golden Line): This line connects the highest point of high prices in the "high_time" period with the highest point of low prices in the "low_time" period. It represents a liquidity point and an important support zone.
The indicator becomes particularly interesting when the lines make crossings. These crossovers could suggest a potential trend change in the market. For example:
Change from Bearish to Bullish: If the "long-term" line (black) crosses the "short- or long-term" line (green or blue) from top to bottom, it could indicate a shift from a bearish to a bullish market , suggesting the opportunity for long positions.
_Changing from Bullish to Bearish: If the "long-term" line (blue) crosses the "short-term" line (red or black) from bottom to top, it could indicate a shift from a bullish to a bearish market, suggesting the opportunity for short positions.
Generally speaking, crossings between these lines can be key points of interest for traders, as they can signal significant changes in price direction.

Trendline Breakouts With Targets [ChartPrime]The Trendline Breakouts With Targets indicator is meticulously crafted to improve trading decision-making by pinpointing trendline breakouts and breakdowns through pivot point analysis.
Here's a comprehensive look at its primary functionalities:
Upon the occurrence of a breakout or breakdown, a signal is meticulously assessed against a false signal condition/filter, after which the indicator promptly generates a trading signal. Additionally, it conducts precise calculations to determine potential target levels and then exhibits them graphically on the price chart.
🔷 Key Features:
🔸 Trendline Drawing: The indicator automatically plots trendlines based on significant pivot points and wick data, visually representing the prevailing trend.
🔸 Breakout and Breakdown Signals : It triggers trading signals when a breakout (price moves above the trendline) or a breakdown (price moves below the trendline) is detected, helping traders identify potential entry points.
🔸 False Breakout/ Breakdown Filter ✔️: To enhance accuracy, the indicator incorporates a filter to reduce false breakout and breakdown signals, helping traders avoid premature entries.
🔸 Target Calculation: The indicator performs target-level calculations, a critical aspect of trade management.
These calculated target levels are visually displayed on the price chart, helping traders set precise profit targets and make well-informed trading decisions.
🔸 Color-Change Labels: The indicator features label color changes to provide quick visual cues. Labels are initially displayed in orange. When a take profit (TP) level is reached, the label changes to green, indicating a successful trade. Conversely, if a stop-loss (SL) level is hit, the label turns red, signaling a losing trade.
🔸 Settings :
This indicator combines technical analysis, trendline identification, breakout/breakdown signals, and risk management tools to assist traders in making more informed and efficient trading decisions. It can be a valuable addition to any trader's toolkit, helping them identify potential trade opportunities and manage risk effectively.

VWAP with CharacterizationThis indicator is a visual representation of the VWAP (Volume Weighted Average Price), it calculates the weighted average price based on trading volume. Essentially, it provides a measure of the average price at which an asset has traded during a given period, but with a particular focus on trading volume. In our case, the indicator calculates the VWAP for the current trading symbol, using a predefined simple moving average (SMA) with a period of 14. This volume-weighted moving average offers a clearer view of the behavior of the VWAP and, of consequence of market dynamics.
One of the distinctive features of this indicator is its ability to provide a more "linear" representation of the data. This means that the data is "smoothed" to remove noise, allowing you to more easily identify the direction of the market trend. This smoother representation is especially useful because the financial market can be subject to significant fluctuations and volatility, and this indicator can help get a more stable view of the trend.
The indicator also offers a visualization of the market trend in a very intuitive way. Using an evaluation of the highs and lows of the last 10 days, determine whether the market is in an uptrend, downtrend, or no trend at all. To make this evaluation even clearer and more immediate, the indicator line is colored dynamically. When the trend is bullish, the line is blue, while in case of a bearish trend, it takes on a distinctive color, such as pink. If the trend is not defined, the line will be colored differently, for example light yellow. This coloration gives traders an immediate visual indication of the prevailing trend, allowing them to make more informed decisions regarding trading operations.
One potential strategy involves watching candles when they cross the VWAP line strongly. If, for example, a candlestick breaks above the VWAP line, we may look for retest areas near key support levels to gauge a potential long entry. In other words, we would consider that the price may have the potential to rise further after breaking above the VWAP line, and we would look to enter a long position to take advantage of this opportunity.
On the other hand, if a candlestick crosses below the VWAP line, we might consider looking for retest areas near the VWAP line itself, which now serves as potential resistance. This could indicate a possible short entry opportunity, as the price may struggle to break above the resistance represented by the VWAP line after breaking it down. In this case, we would look to take advantage of the expected continuation of the downtrend.
In both cases, the idea is to exploit significant movements across the VWAP line as signals of potential reversal or continuation of the trend. This strategy can help identify key entry points based on price behavior relative to the VWAP line.

BE - Strategy Builder ToolkitIndicator vs Toolkit:
This is definitely not an indicator, hence this doesn't do any kind of analysis nor provide meaningful outputs where you can take trading decisions out of it.
This is a Strategy Builder Toolkit which works like any other broker/3P applications, which helps traders to build their own custom/ predefined strategies, save / deploy them at their wish.
Idea Behind Developing this Toolkit: I am sure many of traders have overcome scenarios where, on break of x level he wants to initiate straddle else he wants to initiate Iron Condor. Some of them wants to deploy custom strategies only at certain time or at certian price levels.
It becomes pretty difficult to track markets when you are away from desk and if you dont adjust the strategy legs, you are incurring big drawdowns. There are many if's and buts to deploy strategies.
To overcome such challenges, i have built this toolkit.
Note: As this is just a toolkit, you should conduct your analysis to gauge the market direction outside the perview of this. Once you know the view / direction of the script. you can use this toolkit in action to
1. Deploy Strategy at (Desired levels| Desired time|Confired Levels|Confirmed Volumes)
2. Strategy can be Prebuilt / Custom Built
3.1 Set SL, Target for Directional view (Trail SL aswell)
3.2 Set Upside or Downside Target for Non Directional view (Trail SL aswell)
3.3 let the strategy play with out SL|Targets for consolidation view.
4. Adjust Legs by closing existing position and opening fresh position or place fresh adjustments
5. Book partial Profits with in the zone.
How the Toolkit is buit: Script uses text related functions to understand the custom input given in the indicator and coverts into a strategy and deployes them as a algo trading (Next Level Bot) with the additional parameter set for SL|Target|Entry levels.
Understanding the settings:
1. Strike Difference: is basically a value between each strike. eg: Banknifty : 100, Nifty & Finnifty: 50
2. 1 Lot Qty: Qty per Lot accepted by exchange|Broker. eg: BNF: 15, Nifty: 50, Finnifty: 40
3. Lot Multiplier: If you build strategy with 1 lot and if you set the Lot multiplier as 2 then strategy gets deployed with 2 lots. for eg. If i have saved strategy to buy BNF 1 ITM with 1Lot and have set lot multipier to 3 then at the time of deploying the trade it pushes as 3 lots (3 * 15Qty per lot = 45Qty) of 1 ITM strike.
4. Symbol Name: Select the Symbol Name here.
5. Current & Next Week Expiry Date: Specify the expiry Dates in the format as supported by your broker.
6. Broker Name, Exchange & Product Type: hope it is self explanatory.
IMPORTANT settings to understand:
7. Triggere Entry Post (optional): You have to specify when you want to deploy the strategy. For instance, if i want to deploy my strategy at 30 min after market open which is 9:45 am, then i have specify as 0945. Another instance where i want to close my strategy at 3 PM then you have to specify as 1500. Uncheck this option if you are not worried about the time of entry.
My personal Used Case: On the Expiry -1 Day at 0916 (9:16AM) i will buy 6 lots of 8OTM PE & CE and Sell 2 lots 7OTM, 2 lots of 6OTM and 2 lots of 5OTM and close the trade by 1100 (11AM).
8. Price Levels (Confirmed vs UnConfirmed) (Optional): Confirmed is basically price is sustained at|around the specified price level, where in UnConfirmed is basically the touch of the specified level.
for instance if i want to deploy straddle only if price is sustained at 100. then, i would specify GE with 100 in price input settings, and check thee Confirmed price box. Assuming if LTP is running at 98 and with the above settings it will only deploy the trade upon price is sustained at 100 level for 3 to 5 candles not at the touch of 100.
Uncheck this option if you are not worried about the Entry Price.
9. Confirmed Volume (Optional) (Long or Short): Basis your view|direction of the strategy. you can get additional confirmation. At the time of entry you want volume to be present towards the direction of the strategy. Uncheck this option if you are not worried about the volume or Volume doesn't exist for the chart loaded.
10. Alert Types: It consists of 3 Long & 3 Short directional (prebuilt) strategy along with Close Strategy, Close Specified Symbols Only & Design Custom Strategy Option.
10.1 : Slow Upmove - If you are having bullish view and predict that prices shall go slow and steady. This strategy can be deployed where you get the benifit of time decay as well while the delta play in favor of you. (viseversa for Slow DownMove)
10.2 : Fast Upmove - If you are having bullish view and predict that prices shall go fast. This strategy can be deployed where you get the smaller benifit of time decay as well while the delta play in favor of you. (viseversa for Fast DownMove)
10.3 : Vol Upmove (Volatality)- If you are having bullish view and predict market is tend to be volatile. This strategy can be deployed where you get the benifit of volatility as well while the delta play in favor of you. (viseversa for VolDownMove)
10.4 : Close Trade - You can use this option close the deployed strategy completely.
10.5 : Close Symbols - You can use this option close few of the symbols for the strategy deployed.
10.6 : Custom: Use this option to design you own custom strayegy with the syntax below:
Sample 1:
N|B|C2|3
N refers to Nextweek Expiry (if C is used then Current week expiry)
B refers to Buy (if S is used then Sell)
C refers to Call | CE (if P is used then PE or Put)
2 refers to 2OTM (for CE any Postitive number refers to as OTM and for PE it will be treated as ITM strikes & 0 refers to as ATM - viseversa for Negative Numbers)
3 refers to as 3 Lot
With the syntax of N|B|C2|3 - strategy will be deployed as "Buy 3 lots of 2 OTM Call of Next expiry"
Sample 2:
C|S|P-3|3|10|30
Above syntax means: SELL Current Expiry 3 Lots of 3 OTM Put Strike with 10 SL and 30 TGT
Sample 3:
C|S|C10|3|Default
Above syntax means: SELL Current Expiry 3 Lots of 10 OTM CALL Strike with 50% SL and 95% TGT
Sample 4:
C|B|C-2|3|40%|50%
Above syntax means: BUY Current Expiry 3 Lots of 2 ITM CALL Strike with 40% SL and 50% TGT
Sample 5: Long Straddle
C|B|C0|3
C|B|P0|3
Above syntax means: BUY Current Expiry 3 Lots of ATM CALL & PUT Strike
Sample 6: Iron Butterfly
C|B|C1|1
C|S|C0|1
C|S|P0|1
C|B|P-1|1
Above syntax means: Sell Current Expiry 1 Lots of ATM CALL & PUT Strike and BUY 1OTM Call & Put Strike
Sample 7: Diagonal Spread
C|S|C2|1
C|S|P-2|1
N|B|C3|1
N|B|P-3|1
Above syntax means: Sell Current Expiry 1 Lots of 2OTM CALL & PUT Strike and BUY 3OTM Call & Put Strike of Next Expiry.
To Understand how to deploy Strategy with defined Adjustments. For instance i want to deploy Iron Condor with Adjustments for BNF when the price is currently running at 45000.
C|B-|C3|1
C|S*|C2|1
C|B--|P-3|1
C|S**|P-2|1
At:2|C|S|C2|1
At:2|C|B|C3|1
At:-2|C|S|P-2|1
At:-2|C|B|P-3|1
On:2|*
On:-2|**
On:2|-
On:-2|--
With the above syntax: Intial trades are placed with
BUY BANKNIFTY45300CALL(Current Expiry) 1 Lot
BUY BANKNIFTY44700PUT(Current Expiry) 1 Lot
SELL BANKNIFTY45200CALL(Current Expiry) 1 Lot
SELL BANKNIFTY44800PUT(Current Expiry) 1 Lot
Toolkit tracks the price and holds the adjustments.
We may start to bleed on the sold leg (45200CALL) once the price crosses 45200. Hence if the price crosses 2 strike upside as specified with syntax " On:2|* " where * is a character tagged to Sold Call Leg. it closes the 45200 Call.
Similarly, " On:2|- " where - is character tagged to Brought Call Leg. it closes the 45300 Call, as soon as prices reaches 2 strike upside.
At:2|C|S|C2|1
At:2|C|B|C3|1
With the At Statements you can place the fresh adjustments legs. Above syntax refers to Once the price reaches 45200 it places below adjustment legs.
BUY BANKNIFTY45500CALL(Current Expiry) 1 Lot
SELL BANKNIFTY45400CALL(Current Expiry) 1 Lot
Note: Similarly If prices reaches downside with the On and At Sytax it places the necessary adjustment legs accordingly.
11. SL & TGT - You can specify SL, TGT or Upside & Dowside TGT during the entry conditions and Stratey shall be closed upon hitting either the SL or TGT accordingly.
12. On % Tgt & Lock % SL: This option is used for Prebuilt strategy where you can lock the Profit | Set Revised SL upon hitting specified TGT percentage.
13. Close Symbols: This option is used if you select Alert type as Close Symbols (Ref - 10.5 : Close Symbols) for specified list of symbols Alert shall be pushed to close the open positions of those symbols.
DISCLAIMER: No sharing, copying, reselling, modifying, or any other forms of use are authorized for our documents, script / strategy, and the information published with them. This informational planning script / strategy is strictly for individual use and educational purposes only. This is not financial or investment advice. Investments are always made at your own risk and are based on your personal judgement. I am not responsible for any losses you may incur. Please invest wisely.
Happy to receive suggestions and feedback in order to improve the performance of the indicator better.

Stocashi + CaffeineCrush Momentum Indicator by CoffeeShopCryptoThis is just a fun script to give a different representation to the ever popular Stochastic RSI
Even for me over the years the stochastic has been a difficult one to use in trading merely because of its choppy look.
Since Heikin-Ashi Candles do such a powerful job in smoothing out the look of choppy markets,
I decided to test it out on the look of the Stochastic RSI.
From an initial visual standpoint it worked out WAY better than I thought but it seemed to need something more.
I decided to use the PineScript "Color.From_Gradient" feature to give the Stochastic a more 3 dimensional look, which really brought the "old-school" indicator to life.
Description:
The CaffeineCrush Momentum Indicator is your ultimate trading companion, blending the invigorating world of coffee with the excitement of market momentum. Just like a finely brewed cup of joe,
This indicator provides you with a powerful insight into market dynamics, helping you stay in the trading groove.
As you sip on this caffeinated delight, CaffeineCrush monitors the velocity and strength of price movements,
measuring the momentum of the market. But here's where it gets even more enticing – it goes a step further by incorporating a pressure indication, adding a stimulating twist to your trading experience.
Imagine yourself in a bustling coffee shop, surrounded by the aroma of freshly roasted beans and the energetic buzz of conversations.
CaffeineCrush mimics that atmosphere, keeping you on your toes, always aware of market forces at play.
With CaffeineCrush, you'll never miss a beat. It identifies and highlights moments of heightened momentum and increased pressure,
giving you an edge in capturing profitable opportunities. Just like a perfectly extracted espresso shot, this indicator helps you maintain your trading momentum and navigate the market with confidence.
So, grab your favorite cup of joe, fire up your trading charts, and let CaffeineCrush awaken your trading prowess.
Stay in the groove, embrace the buzz, and master the momentum with this flavorful indicator by your side.
Divergence -
Regular Divergence shows when there is a conflict between the strength of the trend and the swing of the price movement.
Hidden Divergence -
Are to be traded using the same methods as hidden divergences of the MACD or the RSI. A hidden divergence is commonly a trend CONTINUATION move.
Pink Pause -
This shows a ranging area where price is taking a pause. It can be a single candle or a string of candles. But histogram with continue with its RED / GREEN colors once the pause is over.
Stocashi + CaffeineCrush is not an entry / exit indicator. It's designed to help you understand:
1. Weather your trend is continuing
2. When it pauses
3. Has your pullback started / ended
Its best used near area of conflict. For example:
1. If you have a breakout to the low side of support zone, and you get a BULLISH divergence, this can be viewed as a false breakout.
2. If you trading towards the opposite area of a range or key level and you get conflicting movement in the Stocashi + CaffeineCrush, then you should take ur profits and wait for the next move.
3. If you are following through with example 2 above, but get NO conflicts, you can immediately look for a secondary take profit area and split / hedge your take profits.

Sessioned EMA - Frozen EMA in post market hoursWhy I develop this indicator?
In future indices, post market data with little volume distort the moving average seriously. This indicator is to eliminate the distortion of data during low volume post market hours.
How to use?
There is a time session setting in the indicator, you can set the cash hour time, moving average outside the session will be frozen.
What this indicator gives you
This indicator give you a more make sense ema pattern, the ema lines are more respected by the prices when you set the session properly.
Setup
1. Session setting
In US indices, such as NQ, ES etc, when there was data release at 0830 hr, huge volume transaction order appears, that makes the 0830 price data important that should be included in your ema trend line calculating. If that is the case, I will set the session begin from 0830, otherwise, I start the session at 0930. Golden rule : Price with huge volume counts.
2. Time zone
The coding is decided for GMT+8 time zone, you may amend the code to fit your timezone.

BE-TrendLines & Price SentimentsOverview
The trendline is one of the most potent and flexible tools in trading. A rising trendline indicates an upward trend, a falling trendline indicates a downward trend, and a flat trendline indicates a range-bound bond market.
Breakouts, price bounces, and reversal / Retest tactics are all types of trades that may be made using a trendline. Additionally, stop-loss and profit-trailing orders can be based on trendlines as support and resistance levels, appropriately.
Technical Calculations for Trendlines & Price Sentiments:
Pivot points for a specified time frame and the Prevailing High/Low for the most recent bars are used to derive trendlines. While Pivot Points alert us to price movements, High/Low tells us where Bulls and Bears find a middle ground. This provides a remarkable set of conditions from which to extrapolate the efficacy of the Trendlines.
The term "price sensitivity" refers to how much a change in the price of a product causes consumers to alter their purchase habits. It's the relationship between price shifts and shifts in consumer demand. So, for example, if a 30% jump in the cost of a product leads to a 10% drop in purchases, we can conclude that the item has a price sensitivity of 0.33%.
Basis the above theoretical statement, If the underlying asset's price drops, the indicator shall compute data on the amount of volume being pumped (Inflow vs Outflow) into the market (if available), or the percentage by which the price has changed. This will be compared to the recent drop rate to see if the behavior has changed at the similar value zone and non similar value zone. similar calculation shall be done if the price of the underlying rises.
Traders may benefit from hearing about Trendlines in their "Story Telling" form, which we now present. To help you comprehend it better, candles are divided into three Sentiment groups based on their color. Colors: Green (with its shades), Silver, and Red (including its shades). Green signifies a Bullish Trend, Silver a neutral trend, and Red a Brearish Trend.
Bullish Trend
Bearish Trend
Neutral Trend
Sentiment Price Cycle in Trending Market: Green (Directional Bullish), Dark Green (Bullish Trend Loosing its Strength), Silver (Neutral Trend), Red (Directional Bearish), Dark Red (Bearish Trend Loosing its Strength)
Sentiment Price Cycle in RangeBound Market: Green (Over Brought), Silver (Neutral) & Red (Over Sold)
How to Initiate Trade when price is within TL:
Fake Break Out Trade:
BreakDown Trade:
BreakOut Trade:
Couple of Other Features in the Indicator:
Single Alerts = These are the alerts where in, as and when the Event happens Alerts shall the trigerred. like On BreakOut, BreakDown, TouchOf Up TrendLine, TouchOf DownTrendLine, Retest Of Up TrendLine, Retest of DownTrendLine.
Conditional Alerts = These are those type of Alerts where in you can combine 2 or 3 conditions to trigger an Alert. Like
Sample 1 - After Down TL is tested for 3 times, If BreakOut happens and the setiment turns Bullish within 5 Candles.
Sample 2 - After Up TL is tested for 2 times, If Price Bounces backUp from TL and the setiment turns Bullish within 5 Candles.
Similarly you can customize the combination of events for getting the alert.
DISCLAIMER: No sharing, copying, reselling, modifying, or any other forms of use are authorized for our documents, script / strategy, and the information published with them. This informational planning script / strategy is strictly for individual use and educational purposes only. This is not financial or investment advice. Investments are always made at your own risk and are based on your personal judgement. I am not responsible for any losses you may incur. Please invest wisely.
Happy to receive suggestions and feedback in order to improve the performance of the indicator better.
QFL Screener [ ZCrypto ]The QFL Screener is a robust tool inspired by Quickfingersluc's trading strategy.
Known as the Base Strategy or Mean Reversals, QFL focuses on identifying moments of panic selling and buying , presenting opportunities to enter trades at deeply discounted prices.
The QFL Screener is designed to enhance your trading efficiency by simultaneously scanning 40 symbols.
You have the flexibility to enable or disable specific symbols from the screening process, allowing you to tailor the screener to your preferred markets and instruments.
The Screener has a built-in alerts system . As soon as the QFL conditions align for any of the scanned symbols, you'll receive instant notifications, empowering you to take prompt action and seize potential trading opportunities.
In addition, I've incorporated a visual element to complement the alerts. Once the conditions are true, a green arrow shape will appear directly on the chart, providing a clear and intuitive signal of the QFL opportunity.
To provide a clear overview, our screener presents a comprehensive table that highlights when the QFL condition becomes true for each symbol. This table acts as a visual guide, enabling you to monitor the status of multiple symbols at a glance, streamlining your trading decision-making process.
With the QFL Screener, you gain an edge in identifying profitable trade setups based on Quickfingersluc's renowned approach. Experience the convenience of simultaneous screening, real-time alerts, and an intuitive table display, all in one user-friendly tool.
