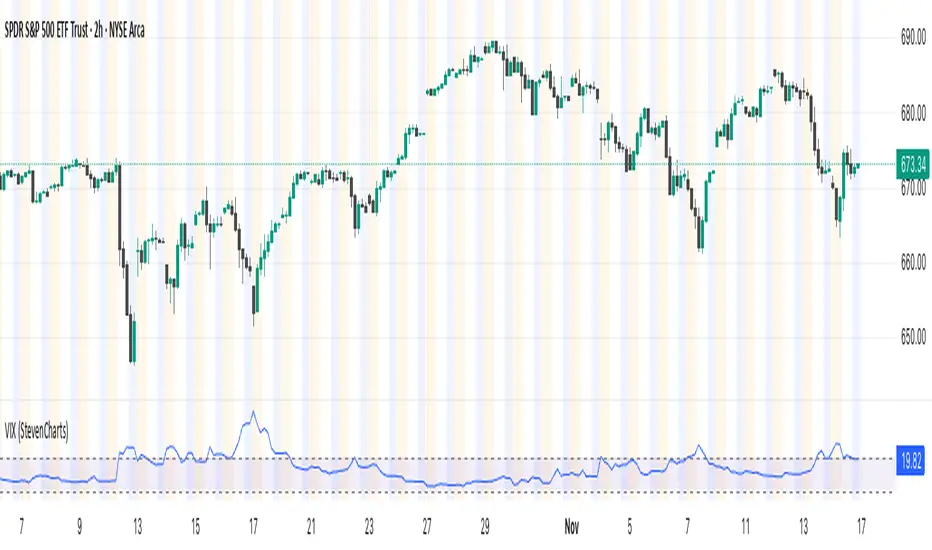
VIX (StevenCharts)This indicator plots the VIX (CBOE Volatility Index) in a separate pane to help you quickly gauge market sentiment and volatility.
It highlights the key zone between 15 and 20, which often acts as a transition area between low and high-volatility regimes.
Features:
Plots the VIX line.
Allows you to change the color of the VIX line.
Biến động
Smart Trend Signals# Smart Trend Signals - Universal Adaptive Trend Indicator
## 🌟 Professional-Grade Trend Detection for All Markets
Smart Trend Signals is an advanced technical analysis tool that combines proven methodologies into one powerful, easy-to-use indicator. Whether you trade stocks, forex, crypto, or futures, this indicator adapts to your market with intelligent trend detection and noise reduction technology.
### 🧠 HOW IT WORKS: CORE TECHNOLOGY
This indicator uses a proprietary **Multi-Layer Confirmation System** to ensure signals align with Trend Direction, Volatility, and Momentum.
* **Adaptive Volatility Trail (TrendBand):** Acts as a dynamic support/resistance that adjusts to real-time volatility (ATR) and momentum. Signals only fire when price closes conclusively outside this trail.
* **SFI Noise Reduction Engine:** A proprietary filter that eliminates market "noise" and small fluctuations, ensuring signals reflect true price action.
* **6-Layer Entry Confluence:** Every signal is validated across a strict, six-layer filtering sequence:
1. **TrendBand Alignment** - Core trend direction
2. **SMA Confirmation** - Medium-term trend validation
3. **ADX Strength Filter** - Trend momentum measurement
4. **Pivot Proximity Protection** - Avoids reversal zones near recent structure
5. **Anti-Whip Confirmation** - Reduces false signals in choppy markets
6. **Volume Confirmation** - Validation of institutional activity
### ⚙️ COMPREHENSIVE PARAMETER GUIDE
#### 🎯 TREND & MOMENTUM (ADX)
- **Align Signals with TrendBand**: When enabled, filters signals to appear only in the direction of the main TrendBand.
- **SMA Confirmation Length**: Sets the smoothing period for trend confirmation (15 = medium-term).
- **ADX Length**: Adjusts the sensitivity of the ADX trend strength measurement (10 = balanced).
- **ADX Threshold (25)**: **(Use $\ge 25$ for clear trends; set to $0$ to disable filtering out weak/sideways markets.)**
#### 🔧 SFI NOISE REDUCTION ENGINE (SFI CORE)
- **Sensitivity (3.0)**: **(Controls the threshold for noise reduction. Use lower values for high-frequency scalping; higher values for swing trades.)**
- **TrendBand ATR Length** (10): Volatility measurement period for the adaptive bands.
- **TrendBand Multiplier** (3.0): Band width adjustment to fit different market volatility regimes.
#### 🛡️ RISK MANAGEMENT (ATR Multiples)
- **TP Multiplier (2.0)**: **(Take Profit distance in ATR multiples.
- **SL Multiplier (1.5)**: **(Stop Loss distance in ATR multiples, adapting to current market volatility.)**
- **Use Stop Loss**: Enables/disables TP/SL visualization on the chart. *"disable by default"
- **Anti-Whip**: Enables the final confirmation logic to reduce signal flipping.
### ⚠️ IMPORTANT DISCLAIMER
**EDUCATIONAL PURPOSE ONLY**
This indicator is designed for technical analysis education and strategy development. It is NOT financial advice. The current default setting doesn't use stop loss. the stop loss will be the opposite of the signal. Example; if you see a BUY signal followed by a SELL signal, it means the trade is closed in loss. Highly recommended to use the stop loss.
**NO PERFORMANCE GUARANTEES**
- Past performance is not predictive of future results.
- Always test in simulation before live trading.
- You are responsible for parameter optimization, risk management, and final trading decisions.
ETH/USD using default setting without stop loss
ES1! using default settings without stop loss.
XAU/USD using default settings without stop loss.

Earnings Move Radar (E+1 & E+2)Stop guessing earnings reactions. See them. Count them. Use them.
Earnings Move Radar turns every earnings release into a clear visual story on your chart.
What it does for you
Automatically marks the first and second trading day after each earnings (E+1 & E+2).
Shows at a glance whether the move came from a gap, an intraday trend, or a follow-through / reversal on the next day.
Packs all past earnings into a compact stats panel so you instantly know:
how big earnings moves usually are,
how often they close up vs. down,
how common your “big move” threshold really is.
Highlights simple, practical patterns like “two-day runs” and “three-day runs” around earnings that many traders care about but rarely measure.
Why traders like it
Saves time: no more clicking through old earnings dates one by one.
Puts realistic numbers behind your option ideas and post-earnings plays.
Works on any stock or ETF with earnings data, with a customizable look-back window.
All labels and the stats table are shown in Chinese, making it very friendly for Chinese-speaking traders.
How to use
Apply it to a daily chart of the stock or ETF you trade.
Scan the labels to understand how the market usually reacts to earnings for this symbol.
Use the stats panel to size your risk and define what “normal”, “large” and “extreme” earnings moves mean for you.
This indicator is an analytical tool, not a signal generator. It does not provide financial advice.

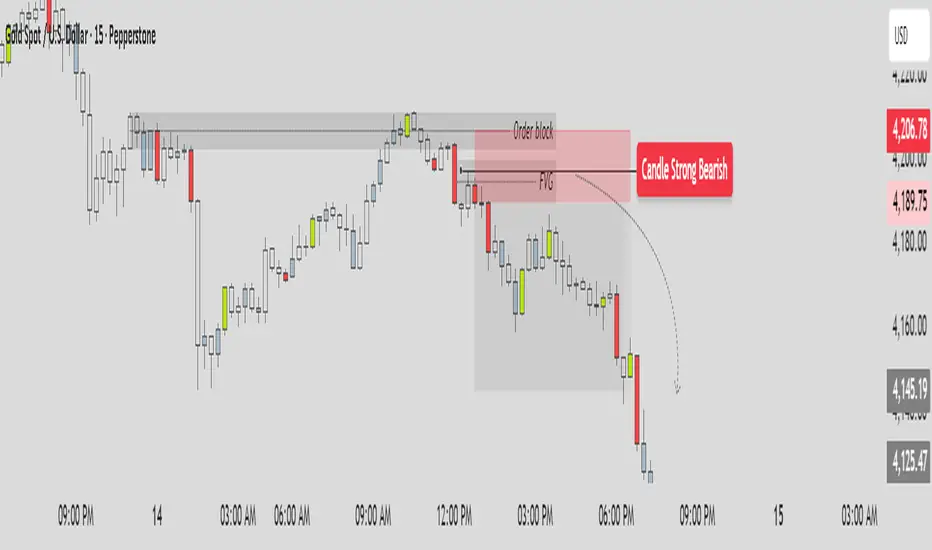
SHA CandleFlow ProSHA CandleFlow Pro v1.0.0 ✨🚀
SHA CandleFlow Pro is a next-generation price-action tool designed to detect high-probability candlestick rejection signals with extreme clarity and precision.
Built for traders who rely on reversal confirmation, wick rejection, momentum shifts, and candle behavior, this indicator helps you instantly visualize where price is likely to reverse, react, or continue with reduced strength.
Whether you trade scalping, intraday, swing, or ICT/SMC concepts, SHA CandleFlow Pro enhances your entries and timing with accurate rejection detection
Core Features ⚙️🔰
- Strong Bullish -> Green color
- Strong Bearish -> Red color
- Medium Bullish/Bearish -> Blue gray color
- Normal Bullish/Bearish -> N/A color
1. Strong Bullish Rejection — Green
Identifies powerful bullish rejection candles with strong wick dominance and momentum absorption.
Green highlights show areas where buyers aggressively step in, signaling high-probability bullish reactions or reversals.
2. Strong Bearish Rejection — Red
Detects strong bearish rejection candles with clear selling pressure.
Red highlights mark zones where sellers strongly reject price, indicating potential downside continuation or reversal points.
3. Medium Bullish / Bearish Rejection — Blue-Gray
For moderate rejection strength, the indicator displays blue-gray highlights.
These candles show noticeable but not extreme rejection, often signaling:
Early reversal signs
Weakening trend
Reaction zones
Potential continuation entries
They act as secondary confirmation.
4. Normal Candles — No Color
If a candle shows no meaningful rejection, no highlight is applied.
This keeps the chart clean and ensures you only focus on:
High-quality rejection
Clear price reaction levels
Relevant market behavior
Normal candles are intentionally ignored to avoid noise and over-signal conditions.
How to Use SHA CandleFlow Pro📘
SHA CandleFlow Pro is designed to help you confirm market reversals, rejections, and price reactions with high precision.
The best way to use it effectively is combine with your strategy to trade.
This is sample how to use it :
⚠️ Disclaimer
The information and tools provided in this script are for educational and informational purposes only.
Trading in the financial markets involves risk of loss and is not suitable for every investor. You are solely responsible for your trading decisions. Always do your own research, use proper risk management, and consult a licensed financial advisor before making any financial decisions.

ATR Risk Display - Multi FuturesWhat This Does
I got tired of manually calculating my ATR stops and risk for different futures contracts, especially when switching between ES, NQ, and their micro versions. This indicator automatically detects what futures symbol you're trading and shows you the exact tick count and dollar risk for your stop loss.
The Problem It Solves
If you trade futures with ATR-based stops, you know the hassle:
Different contracts have different tick values
You need to calculate position risk in dollars
Switching between symbols means redoing all the math
Renko charts make it even more confusing since ATR needs to come from regular candles
This handles all of that automatically.
Key Features
Auto-detects futures symbols - ES, NQ, YM, RTY, GC, CL, and all the micros (MES, MNQ, etc.)
Shows everything you need in one line: ATR(timeframe) × multiplier = X ticks ($XXX)
Works on Renko charts - pulls ATR from regular timeframe charts (super important if you use Renko)
Adjustable position sizing - set your contract count and see total risk instantly
Clean, minimal display - just the info you need, no clutter
How to Use
Add it to any futures chart
Set your preferred ATR timeframe (I use 5-minute)
Set your ATR multiplier (I use 1.5x for my stops)
Set your contract size
That's it - the indicator handles the rest
The display will show something like: "ES ATR(5) × 1.5 = 12 ticks ($150)"
Settings Explained
ATR Timeframe: What timeframe to calculate ATR from (always uses regular candles, even on Renko)
ATR Multiplier: How many ATRs for your stop (1.5 is common, 2.0 for wider stops)
Number of Contracts: Your position size for risk calculation
Auto-Detect Symbol: Leave on unless you want to manually override
Supported Futures
Full size: ES, NQ, YM, RTY, GC, CL, ZB, ZN, 6E, 6J
Micros: MES, MNQ, MYM, M2K, MGC, MCL
Notes
Made this primarily for my own ES trading but figured others might find it useful
The tick values are based on standard CME specs
If you trade other futures, you can modify the code to add them
Works great alongside level indicators for risk management
Why This Exists
I use ATR trailing stops on all my trades and got tired of doing mental math every time I switched between charts or contracts. Especially useful if you trade both full-size and micro contracts - the risk difference is huge and easy to mess up.
Hope this helps your trading! Feel free to suggest improvements.

AURORA LEGACY INDICATOR
The AURORA LEGACY is an advanced indicator developed in Pine Script v6 for the TradingView platform, designed to integrate multiple approaches of technical analysis into a single modular and customizable system. Its architecture combines classic elements, such as exponential moving averages (EMA Ribbon), RSI, and ATR, with modern tools inspired by Smart Money Concepts (SMC), including Supply & Demand zones, Break of Structure (BOS), and Points of Interest (POI).
The indicator is structured to provide traders with flexibility, offering pre-configured trading profiles (Scalper, Day Trade, Swing Trade, Sniper) or full manual customization of moving averages. The dynamic Ribbon serves as the core of trend analysis, supported by additional confluences through secondary moving averages (VWMA, LWMA, SMMA) and volatility filters based on ATR.
Key features include:
Trend & Signal System: detection of reversals and trend confirmations through Ribbon color alignment, with automated buy/sell alerts.
Automated Risk Management: dynamic calculation of entry levels, Stop Loss (SL), and multiple Take Profits (TPs), displayed on chart with labels and risk-reward ratio (R:R).
Multi-Timeframe (MTF) Trend Table: consolidated overview of trend, RSI, and volatility (ATR) across different timeframes (5M, 15M, 1H, 4H, Daily).
Smart Money Concepts Integration: automatic detection and marking of Supply & Demand zones, BOS, market structure zigzag, and points of interest.
Complementary Tools: customizable RSI signals by profile, daily support and resistance levels, CPR levels, and visual session markers (London, New York) including overlap zones.
This system was designed to provide a holistic trading approach, combining price action, volatility, indicator confluence, and institutional concepts to support traders of different profiles in making clearer and more precise decisions.

Volatility Forecast [30m-4h] — CryptoVolatility Forecast — CryptoIndicator by GhostMMXM — TradingView
CLOSED-SOURCE SCRIPT
Updated: November 15, 2025
The Volatility Forecast indicator is your early warning system for crypto explosions. Designed specifically for high-vol markets like BTC, ETH, and SOL, it scans for volatility squeezes (compression patterns) and assigns an Ignition Score (0–100) to predict range expansions 30 minutes to 4 hours ahead.
Think of it as spotting a coiled spring: Low volatility + rising volume + active sessions = imminent breakout. No more getting caught flat-footed in chop — this flags the setups where the market's about to unsqueeze with force. Perfect for scalpers on 15m/30m charts who want to position before the move.
Overview Chart: Volatility Squeeze CROSS/USDT
Grey background glow signals a building squeeze (Ignition Score: 82). Notice the NR7 diamond marking narrow range consolidation before the 60% upside breakout.
Release Notes
Initial release: Full Pine Script v5 implementation with multi-timeframe ATR, Bollinger contraction, NR7, volume surges, session filters, and momentum candles.
Release Notes
Added breakout direction labels (UP/DN) for optional bias.
Release Notes
Optimized for crypto: Integrated UTC sessions (Asia/US) to filter low-liquidity hours. Thresholds fine-tuned for 30m–4h horizons.
Release Notes
Error fixes applied: Renamed reserved keywords (e.g., range → candle_range), proper line breaks, and non-repainting alerts.
Key Features
Ignition Score (0–100): Composite metric blending 6 factors — scores high when a volatility pop is likely.
Squeeze Detection: Bollinger Band Width contraction + NR7 (narrowest range in 7 bars) for VCP-style setups.
Volume & Momentum Proxy: Surges in volume + strong-bodied candles signal hidden accumulation.
Session Filter: Only triggers during high-activity windows (00:00–08:00 & 13:00–21:00 UTC).
Breakout Bias: Optional UP/DN labels on Bollinger probes post-squeeze.
Custom Alerts: Fire on score ≥75, with ticker and score in messages.
Key Features: Settings Panel & Score Breakdown
Score Calculation: Sum the points, cap at 100. Alert on ≥75 crossover.
Session Times
"0000-0800,1300-2100"
UTC windows — add London (0800-1200) for alts.
No repainting: All calcs use closed bars.
Usage Tips & Examples
Apply on 15m or 30m charts for cryptos
Combine with EMA 50/200 for trend filter.
Spot the Setup: Orange glow + purple NR7 diamond = prep for entry. Wait for VOL triangle.
Risk Management: Ignore in low-liquidity hours; backtest on 1-month data for edge (aim >60% win rate on breakouts).
Disclaimer
The information and publications are not meant to be, and do not constitute, financial, investment, trading, or other types of advice or recommendations supplied or endorsed by TradingView. Read more in the Terms of Use.
This script is for educational purposes — always DYOR and manage risk. Crypto trading involves high risk of loss.

Turtle Long & Short (Donchian + N-Stop). Overview and Core Functionality
The indicator implements the classic Turtle Trading System rules. It uses two sets of Donchian Channels for generating entry and exit signals, and the Average True Range (ATR), referred to as N, to calculate a dynamic, volatility-adjusted initial stop-loss.
The script simulates a position's life cycle (entry, holding the fixed initial stop, and exiting) and only conditionally displays the calculated initial stop-loss price on the chart when a trade signal is active.
2. Key Input Parameters (Adjustable Settings)
The script provides detailed input groups for customization:
A. Signal Settings:
len_entry (Default: 20): Period for the Entry Donchian Channel (20-day high/low breakout).
len_exit (Default: 10): Period for the Exit Donchian Channel (10-day low/high trailing stop).
B. Risk Settings (N):
len_atr (Default: 20): Period used to calculate the Average True Range (N), which determines volatility.
stop_loss_multiplier (Default: 2.0): The factor applied to N to calculate the initial stop-loss (e.g., 2.0×N=2N).
C. Label Display: Controls the appearance of the entry labels.
label_background_color_long / label_background_color_short: Background color for Long/Short entry labels.
label_text_color: Text color for the labels.
label_size_input: Size control for the label (tiny, small, normal, large, huge).
3. Trading Logic and State Management
A. Entry and Exit Conditions
Trade Type Entry Condition Trailing Exit Condition Stop-Loss (SL)
Long Close > 20-period High Close < 10-period Low Fixed Entry Price−(Multiplier×N)
Short Close < 20-period Low Close > 10-period High Fixed Entry Price+(Multiplier×N)
In Google Sheets exportieren
B. Position State Management
The script uses persistent var float variables (fixed_long_stop_price and fixed_short_stop_price) to maintain the state:
Upon an Entry signal, the calculated stop-loss price is fixed and assigned to the respective var variable.
The variable holds this fixed price on subsequent bars.
The price is reset to na (Not Applicable) only when an Exit condition (10-period trailing exit, fixed stop-loss hit, or reverse entry signal) is met.
This logic ensures the initial stop-loss line is plotted only when a simulated trade is active.
4. Visual Elements and Alerts
Donchian Channels: Plotted as two lines (Entry High/Exit Low) with a fill for visualization.
N-Stop-Loss Lines: Two lines (fixed_long_stop_price in Fuchsia and fixed_short_stop_price in Orange) are plotted using plot.style_linebr, ensuring they appear only after a trade signal fires and disappear on exit.
Signal Shapes (plotshape):
Long Entry: Green triangle below the bar.
Short Entry: Red triangle above the bar.
Long/Short Exits: Diamond shapes indicating the trailing stop exit.
Entry Labels (label.new): Custom-colored labels appear at the point of entry, displaying the current N value and the exact calculated N-Stop price.
Alerts (alertcondition): Alerts are set up for both Long Entry and Short Entry conditions.

Turtle 20-Day Breakout (Donchian)Yes, the most important indicator used in the Turtle Rules (Turtle Trading Strategy) for finding breakouts above previous highs is the Donchian Channel. 🐢📈
Donchian Channel
The Donchian Channel is a trend-following indicator composed of three lines plotted on the chart:
Shutterstock
Upper Band: The highest high over the defined number of periods.
Lower Band: The lowest low over the defined number of periods.
Middle Line: The average of the Upper and Lower bands (not always used, but sometimes added for orientation).
The Turtle Rules use the following periods for the entry signals (breakouts) you mentioned in your query:
Short-Term (System 1): Crossing the 20-day high (this corresponds to the upper band of a Donchian Channel with a 20-period setting).
Mid-Term/Long-Term (System 2): Crossing the 55-day high (this corresponds to the upper band of a Donchian Channel with a 55-period setting).
Crossing the upper band signals a breakout and serves as the buy signal for a long position (for short positions, crossing below the lower band is used).
Is there anything else I can translate for you, or would you like me to elaborate on the Average True Range (ATR), the other key indicator used by the Turtles?

Session Range Boxes GR v2.1This indicator draws intraday range boxes for the main Forex sessions based on Europe/Budapest time (CET/CEST).
Tracked sessions (Budapest time):
Asia: 01:00 – 08:00
Frankfurt (pre-London): 08:00 – 09:00
London: 09:00 – 18:00
New York: 14:30 – 23:00
For each session, the script:
Detects the session start and session end using the current chart timeframe and the Europe/Budapest time zone.
Tracks the high and low of price during the session.
Draws a colored box from session open to session close, covering the full price range between the session high and low.
Draws a white midline inside every box at the midpoint between the session high and low (and keeps it visible for all past sessions).
Optionally plots a small label (“Asia”, “Fra”, “London”, “NY”) above the first bar of each session.
Color scheme:
Asia: soft orange box
Frankfurt: light aqua box
London: darker blue box
New York: light lime box
Use this tool to:
Quickly see which session created the high or low of the day,
Highlight important liquidity zones and prior session ranges that price may revisit,
Visually separate Asia, Frankfurt, London and New York volatility profiles on intraday charts.
Optimized for intraday trading (Forex / indices), but it works on any symbol where session behavior and time-of-day structure matter.

Session Range Boxes (Budapest time) GR V2.0Session Range Boxes (Budapest time)
This indicator draws intraday range boxes for the main Forex sessions based on Europe/Budapest time (CET/CEST).
Tracked sessions (Budapest time):
Asia: 01:00 – 08:00
Frankfurt (pre-London): 08:00 – 09:00
London: 09:00 – 18:00
New York: 14:30 – 23:00
For each session, the script:
Detects the session start and session end using the current chart timeframe and the Europe/Budapest time zone.
Tracks the high and low of price during the entire session.
Draws a box (rectangle) from session open to session close, covering the full price range between session high and low.
Optionally prints a small label above the first bar of each session (Asia, Fra, London, NY).
Color scheme:
Asia: soft orange box
Frankfurt: light aqua box
London: darker blue box
New York: light lime box
Use this tool to:
Quickly see which session created the high/low of the day,
Identify liquidity zones and session ranges that price may revisit,
Visually separate Asia, Frankfurt, London and New York volatility on intraday charts.
Optimized for intraday trading (Forex / indices), but it works on any symbol where session behavior matters.

Average True Range with MAKey features
ATR calculation: true range (ta.tr(true)) is smoothed using a selectable method to produce the ATR.
ATR smoothing options: RMA, SMA, EMA, or WMA for the ATR calculation.
MA-on-ATR: a separate moving average computed on the ATR values with its own length and smoothing method.
Display controls: toggles to show/hide the ATR and the ATR MA independently.
Appearance controls: separate color inputs for the ATR and the ATR MA, and a thicker line for the MA (linewidth=2).
Inputs
ATR Length (default 14): length used to smooth true range into the ATR.
ATR Smoothing (default RMA): smoothing method applied to the true range to form ATR.
MA Length (on ATR) (default 14): length for the moving average applied to the ATR series.
MA Smoothing (default SMA): smoothing method used for the MA applied to ATR.
Show ATR / Show ATR MA: booleans to toggle visibility.
ATR Color / ATR MA Color: choose plot colors.
How to interpret
ATR line: shows current volatility (average true range). Rising ATR indicates increasing volatility; falling ATR indicates decreasing volatility.
ATR MA line: smooths the ATR to reveal trend direction and reduce noise.
Use crossovers: ATR crossing above its MA may signal volatility is picking up; ATR crossing below its MA suggests volatility is subsiding.
Combine with price action or other indicators (e.g., breakout systems, position sizing rules) to make decisions based on volatility regime.
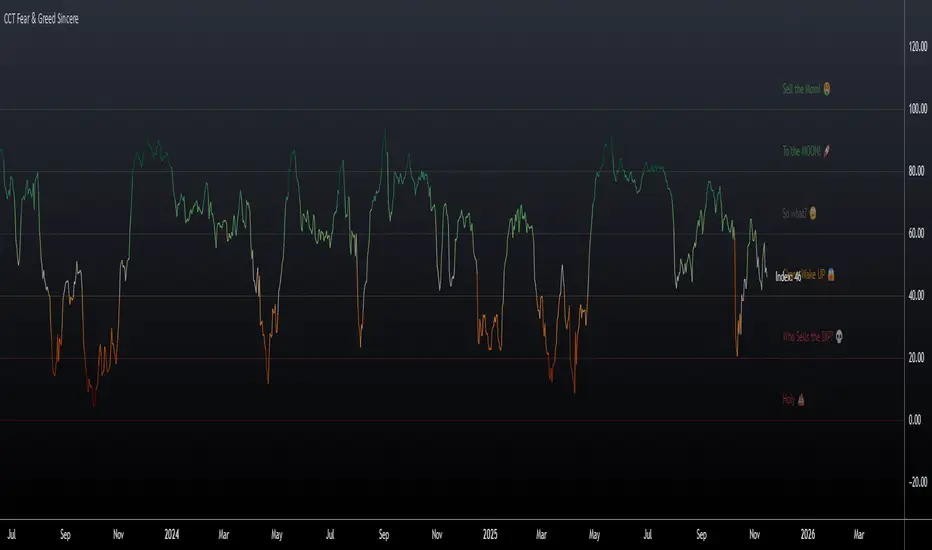
CCT Fear & Greed Sincere📄 CCT Fear & Greed Sincere — Technical Overview
The CCT Fear & Greed Sincere indicator provides a consolidated view of macro-market conditions using exclusively price-derived and market-structure data. The goal is to translate multiple independent risk-appetite components into a unified 0–100 index. This tool does not rely on survey sentiment, alternative datasets, or social indicators; it uses only verifiable, market-observable inputs.
All components are normalized into a comparable scale and combined into a composite metric representing broad risk-seeking or risk-averse behaviour in global markets. While applicable to any instrument on TradingView, the indicator is particularly effective for cryptocurrency markets due to their historical sensitivity to equity volatility, liquidity cycles, and macroeconomic shifts.
📊 Components Included in the Index
Below is an overview of the internal factors used to compute the final score. Each item is independently transformed into a 0–100 range before aggregation.
1. S&P 500 Price Deviation (SPX 125-Day Distance)
Measures how far the S&P 500 is trading above or below its 125-day moving average.
Large positive deviations generally reflect elevated risk-taking, while negative deviations suggest conservative market posture.
2. 52-Week Range Position (NYSE Composite)
Evaluates the NYSE Composite’s distance from its annual high/low range.
A higher relative position indicates greater market confidence, whereas lower values capture prolonged weakness or systemic stress.
3. Advance/Decline Momentum (ADVN vs. DECN)
Applies smoothing to the net difference between advancing and declining issues.
This highlights internal market participation, breadth conditions, and the balance between accumulation and distribution phases.
4. Put/Call Ratio Pressure (PCC)
Uses a smoothed version of the equity put/call ratio.
A higher put/call ratio (inverted here) reflects risk aversion, while lower ratios align with speculative environments.
5. VIX Relative Position (VIX vs. 50-Day Average)
Compares the current VIX value to its 50-day moving average.
VIX above its mean implies elevated volatility and fear; values below suggest calmer conditions and stronger risk appetite.
6. Equity vs. Treasury Performance (SPX vs. US10Y)
Contrasts 20-day returns of equities and U.S. 10-year bonds.
Strong equity performance relative to treasuries is normally associated with risk-on flows, while the opposite reflects defensive positioning.
7. High-Yield Spread (JNK vs. US10Y)
Tracks the yield differential between high-yield bonds and U.S. Treasury rates.
A wider spread captures stress in credit markets; a narrower spread indicates improved confidence.
🧮 Composite Calculation
The indicator computes each component independently, normalizes the values into a 0–100 scale using a consistent methodology, and then calculates the simple average.
This ensures transparency and avoids hidden weighting schemes or model bias.
The final index is plotted as a continuous line with adaptive coloring based on its current level, visually highlighting shifts between fear-dominant and greed-dominant market states.
📈 Suggested Usage
The indicator can be applied to any tradable asset, but it tends to be especially informative for:
Cryptocurrencies, due to their pronounced reaction to global liquidity and risk sentiment.
High-beta stocks, which often mirror broader volatility cycles.
Macro-focused analysis, where risk-on/risk-off transitions impact multiple asset classes simultaneously.
This tool is intended as a contextual framework rather than a standalone signal generator. Market participants may use it to contextualize regime changes, identify extremes, or complement existing technical strategies.
📏 Fear & Greed Levels Included in the Indicator
These levels are plotted with dedicated labels and tooltips to offer additional visual clarity:
Level Interpretation
0 – “Holy 💩” Extreme market stress; structural capitulation environment.
20 – “Who Sells the DIP?” Strong fear signal; frequently aligns with oversold conditions.
40 – “C’mon Wake UP!” Cautious or bearish environment; transitional zone.
60 – “So What?” Neutral risk environment; consolidation or equilibrium.
80 – “To the MOON!” Elevated risk appetite; momentum-driven phases.
100 – “Sell the MOM!” Peak optimism; historically associated with overheated conditions.
These thresholds do not provide direct buy/sell instructions; they are reference bands designed to help illustrate the structural context of market behavior.
📌 Why This Indicator Is Uniquely Updated
Uses 7 fully technical components
Zero survey sentiment
Zero social media data
Zero alternative datasets or search trend metrics
Fully transparent, fully reproducible, and based only on market-derived inputs
Built on Pine Script® v6, aligned with modern TradingView standards
Does not rely on proprietary or black-box scoring systems
This positions the CCT Fear & Greed Sincere as one of the most technically grounded and transparent fear/greed-style indicators available using only TradingView-native data.
Enhanced Multi-Indicator StrategyEnhanced Multi-Indicator Strategy v7 is a trend-following confirmation tool that combines several classic indicators into one clear “voting system.”
Instead of relying on a single signal, this script counts how many indicators agree on a bullish or bearish bias and only fires when the majority lines up and the trend is strong.
It’s designed to help you:
Filter out low-quality signals
Avoid trading against the dominant trend
Get clean, one-time BUY/SELL markers instead of noisy spam signals
How it Works
The indicator evaluates up to 10 components on each bar:
Trend & Structure
Moving Average (MA 50)
EMA Fast (20) vs EMA Slow (50)
Momentum
RSI (14)
MACD (12/26/9)
KDJ
Volatility & Price Location
Bollinger Bands (20, 2)
VWAP
Volume
Volume vs Volume MA (20)
Trend Strength & Direction
ADX + DMI (trend strength and up/down direction)
Optional
Ichimoku Cloud (price vs Senkou A/B)
Each indicator votes bullish or bearish.
The script then:
Counts how many are bullish → bullish_count
Counts how many are bearish → bearish_count
Requires at least Min Indicators for Entry (user-defined) to agree in one direction
Requires ADX above a threshold (default 20) to confirm trend strength
(Optionally) forces entries to follow the DMI trend:
Longs only in uptrends
Shorts only in downtrends
Only when these conditions are met does the script consider a valid long zone or short zone.
Signals: 1x Fire + Cooldown
To keep the chart clean and prevent over-trading:
A BUY arrow is plotted only on the first bar when price enters a new bullish zone.
A SELL arrow is plotted only on the first bar when price enters a new bearish zone.
A cooldown (in bars) can be configured separately for BUY and SELL so the script will not fire again in the same direction too frequently.
Background colors (optional):
Green background = bullish zone (majority indicators bullish + strong trend)
Red background = bearish zone (majority indicators bearish + strong trend)
This makes it easy to see when the “environment” is favorable for longs or shorts, while the arrows highlight the first opportunity in each zone.
Inputs & Tuning
Key inputs:
Min Indicators for Entry – how many indicators must agree (e.g. 5–7 for stricter filtering)
Strict Trend Filter – if enabled, entries must follow DMI trend (recommended for trend-following)
Cooldown BUY / SELL – minimum number of bars before a new signal in the same direction
Toggles to enable/disable each component (MA, EMA, RSI, MACD, KDJ, BB, Volume, VWAP, ADX, Ichimoku)
General ideas:
Increase Min Indicators for Entry and/or cooldown to reduce the number of signals and focus on stronger trends.
Lower values will make the indicator more active, suitable for shorter-term trading or scalping.
Important Note
This is an indicator, not a full trading system:
It does not manage entries/exits, position sizing, or risk by itself.
Always combine it with your own risk management, stop-loss / take-profit rules, and higher-timeframe context.
Use it as a confirmation / regime tool:
Trade only in the direction of the active zone,
Take BUY signals during bullish regimes,
Take SELL signals during bearish regimes.

XAUUSD Pro Setup Suite manuel_lnt.fx is an advanced Pine Script v6 indicator designed exclusively for XAUUSD, built to automatically detect the 5 highest-probability setups in gold day trading.
It combines institutional price action, volatility patterns, mean reversion logic, and momentum confirmation to generate clean, filtered, and actionable signals.
The indicator automatically detects:
⸻
1️⃣ Break & Retest Premium (BR)
Identifies valid breaks of key levels and signals the retest with rejection wick, EMA20 trend confirmation, and neutral RSI.
→ Excellent for trend continuation.
⸻
2️⃣ Fakeout Liquidity Trap (FO)
Detects liquidity grabs above highs or below lows with an opposite close + engulfing candle confirmation.
→ The strongest setup for fast and explosive reversals on gold.
⸻
3️⃣ MACD Zero-Line Shift (MACD)
Signals when the MACD crosses the zero line while price breaks micro-structure.
→ Perfect for spotting the start of a new trend.
⸻
4️⃣ Bollinger Squeeze → Breakout (BB)
Recognizes volatility compression and signals when a breakout is likely to explode.
→ Ideal for clean breakout trades.
⸻
5️⃣ Mean Reversion on EMA50 (MR)
Highlights price extensions far away from the EMA50 with ATR confirmation and a reversal candle.
→ Great for pullbacks back toward the mean value.

ReqoverAI Indicator Zero Lag🔑 Overview
ReqoverAI Indicator ZeroLag is a precision-engineered advanced AI detection tool for multi-asset trading strategies. This tool is designed to work for all time frames and asset classes (like Stocks, Commodities, Forex, Crypto and other Digital Assets). It uses advanced detection techniques that reduces lag and adapts to volatility. It combines a smoothing technique with adaptive reversal logic to highlight meaningful trend shifts earlier than conventional methods. It provides clear signals with built-in alerts, helping traders identify meaningful trend shifts earlier and with greater clarity.
⚙️Core Concepts
Smoothing Technique
Reduces the delay found in traditional moving averages, allowing faster response to price changes.
Adaptive Reversal Detection
Uses volatility- or percentage-based thresholds to identify potential pivots, helping filter out insignificant moves.
Signals
* Green “Buy” labels mark potential upward pivots.
* Red “Sell” labels mark potential downward pivots.
* Optional guideline plotted for trend visualization.
Alerts
Built-in TradingView alerts for Buy/Sell pivots, ready for automation or notifications.
📘 How to Use
Apply to chart: Works directly on price charts with Buy/Sell labels.
Select reversal mode:
* ATR-based (default, recommended for volatile assets).
* Percent-based (for more stable assets).
Interpret signals:
* Green “Buy” → potential upward movement.
* Red “Sell” → potential downward movement.
Combine with your strategy: Use ReqoverAI as a confirmation tool alongside your existing methods.
🧩 Originality & Value
Unique Approach: Integrates smoothing with a proprietary detection framework.
Not Just Another Indicator: Goes beyond standard moving averages or ATR scripts by dynamically managing pivots and reversals.
Vendor Justification: While it uses familiar elements, the hybrid detection logic is proprietary and unavailable in public domain scripts, making it valuable for traders seeking earlier and cleaner signals.
⚠️ Disclaimer
This indicator is a technical analysis tool. It does not guarantee profits or predict the future. Past performance does not ensure future results. Use responsibly and in combination with your own trading plan.

orb cody hoskinscody orb designed a 15 min range orb indicator for people to use dur8ng market open in asian and new york
NDOG & NWOG Levels v2Fully customizable - Select how many NDOG and NWOG you want to see!
Is possibile to select a color for current NDOG and current NWOG and a different color for old ones!
On 1m and 2m you can only see actual NWOG and previous one.

ORB + INMERELO ADR + ATRThis indicator provides **two completely different but complementary lines of information** for intraday traders:
# **1. The ORB Line (ADR-Based Context Line)**
The ORB portion of the script focuses on **range expansion** relative to typical daily behavior.
### **What it measures**
* **20-day ADR (Average Daily Range)**
* **Today’s range as a % of ADR**
* **How much of the average range has been “used”** by the time you’re considering an Opening Range Breakout
### **Why it matters for ORB trading**
Successful ORBs thrive when:
* **ADR used% is low** (green) → plenty of fuel left for expansion
* **ADR used% is moderate** (orange) → breakout still possible but less explosive
* **ADR used% is high** (red) → breakout attempts often fail or reverse
### **What the indicator gives you**
A clean, color-coded readout of:
* ADR
* Today’s range
* Used%
* A simple green/orange/red evaluation of ORB quality
This allows a trader to quickly judge whether **conditions favor ORB continuation or mean-reversion reversal**—without manually calculating ranges or switching charts.
---
# **2. The INMERELO Line (ATR Stretch + MA Interaction)**
The INMERELO portion of the script is built around **mean-reversion mechanics**:
the market tends to revert back toward the **first daily MA it crosses under**.
### **How it determines the active MA**
At the start of each session, the script waits for price to cross under:
* **EMA10**
* **EMA21**
* **SMA50**
Whichever MA is crossed first becomes the **active MA** for the day.
If no cross has occurred yet, the indicator shows the **nearest MA**, so traders know exactly what the likely “INMERELO magnet” will be.
### **What it measures**
* **Stretch from the active MA (in ATR units)**
* **20-day ATR regime direction (expanding or contracting)**
* **Daily MA context: E10, E21, or S50**
### **Why it matters for INMERELOs**
This provides:
* The **target MA**
* The **distance to that MA in ATRs**
* A color-coded stretch score:
* **0.6–1.2 ATR** → prime INMERELO zone (Green)
* Moderately stretched → Orange
* Overstretched or dead zone → Red
An up/down arrow shows whether **volatility is expanding or compressing**, which affects expected retrace behavior.
### **What the indicator gives you**
All INMERELO data is displayed in a second compact line:
* Stretch to MA
* Active MA label (E10/E21/S50)
* ATR regime arrow
This allows fast identification of high-probability **mean-reversion trades back to the MA**.
---
# **Summary**
This indicator shows:
### **Line 1 → ORB Context (ADR)**
* Is the stock setup for a powerful breakout?
* How much ADR is left?
* Are you early (good) or late (risky)?
### **Line 2 → INMERELO Context (ATR + MA Stretch)**
* Which MA is in control today (EMA10, EMA21, or SMA50)?
* How many ATRs away from that MA are we?
* Is volatility expanding or contracting?
* Is this a clean INMERELO setup or not?
Together, these two lines give traders the **two most important intraday lenses**:
**range expansion (ORB)** and **mean reversion (INMERELO)**—updated every bar, without clutter.

Volume GrabdTraderVol GrandTrader — Advanced Volume Indicator
Vol GrandTrader is an enhanced version of the standard volume indicator that shows not only regular chart volume but also higher-timeframe (HTF) volume and highlights significant volume spikes.
Key Features
🔹 HTF Volume
Display volume from a higher timeframe to better understand larger market flows and institutional activity.
🔹 Volume Spike Detection
The indicator highlights bars where volume exceeds the average of the last N candles by a chosen multiplier — helping you spot strong moves, breakouts, and aggressive entries.
Settings
Volume Timeframe (HTF) — select a higher timeframe for additional volume.
Average Volume Length — period for calculating average volume.
Spike Multiplier — threshold for detecting volume spikes.
Why Traders Use It
Better visibility of major market participants
Clear detection of abnormal volume events
Useful for day traders, scalpers, and swing traders
A simple yet powerful tool for deeper volume analysis.

Smart TP Manager - FREE Edition📘 Smart TP Manager - User Guide
🎯 Parameter Adaptation by Timeframe
IMPORTANT: Default parameters are optimized for M5 (5 minutes). If you trade on other timeframes, you MUST adapt the parameters for better results.
📊 Recommended Settings Table
M1 (1 minute) - Ultra Scalping
ATR SL Multiplier: 1.5 - 1.8
Number of TPs: 3 - 4
Base RR: 0.4 - 0.5
Confirmation Bars: 2
Cooldown: 3 - 5 bars
Breakeven: Enable after TP1
Profile: Very fast trades, immediate exits, tight SL
M5 (5 minutes) - Scalping ✅ DEFAULT
ATR SL Multiplier: 1.8 - 2.0
Number of TPs: 4 - 5
Base RR: 0.5 - 0.6
Confirmation Bars: 2 - 3
Cooldown: 5 - 8 bars
Breakeven: Enable after TP1 or TP2
Profile: Standard scalping, balance between speed and security
M15 (15 minutes) - Intraday
ATR SL Multiplier: 2.0 - 2.2
Number of TPs: 5 - 6
Base RR: 0.6 - 0.8
Confirmation Bars: 3
Cooldown: 8 - 10 bars
Breakeven: Enable after TP2
Profile: Intraday trading, 3-8 trades per day
H1 (1 hour) - Swing
ATR SL Multiplier: 2.2 - 2.5
Number of TPs: 5 - 6
Base RR: 0.8 - 1.0
Confirmation Bars: 3 - 4
Cooldown: 10 - 15 bars
Breakeven: Enable after TP2 or TP3
Profile: Swing trading, 1-3 trades per day
H4 (4 hours) - Position
ATR SL Multiplier: 2.5 - 3.0
Number of TPs: 6
Base RR: 1.0 - 1.2
Confirmation Bars: 4 - 5
Cooldown: 15 - 20 bars
Breakeven: Enable after TP3
Profile: Position trading, multi-day trades
🔍 Adaptation Logic
General Rule:
LOWER Timeframe → TIGHTER Parameters
HIGHER Timeframe → WIDER Parameters
Why Adapt?
1. ATR SL Multiplier
M1: Very volatile market, fast moves → Tight SL (1.5-1.8)
H4: Slow moves, breathing room needed → Wide SL (2.5-3.0)
2. Number of TPs
M1: Quick exits before reversal → 3-4 TPs
H4: Let profits run → 6 TPs
3. Base RR
M1: Close targets, quick exits → 0.4-0.5
H4: Ambitious targets, patience → 1.0-1.2
4. Confirmation Bars
M1: Fast entry, 2 candles enough
H4: Strong confirmation needed, 4-5 candles
5. Cooldown
M1: Multiple trades per hour possible → 3-5 bars
H4: Important spacing between trades → 15-20 bars
6. Breakeven
M1: Immediate protection after TP1
H4: Let trade breathe, BE after TP3
💡 Real Examples
Example 1: Gold M1 Scalping
Goal: 10-20 trades/day, ultra-fast exits
Recommended Parameters:
- ATR SL: 1.6
- TPs: 4
- Base RR: 0.5
- Confirmation: 2
- Cooldown: 5
- BE: ON after TP1
Expected Results:
- Winrate: 40-50%
- Net P/L: +3 to +6R per day
- SL: 10-15 pips
- TP1: 5-8 pips (quick exit)
Example 2: Gold M15 Day Trading
Goal: 3-6 trades/day, let it breathe
Recommended Parameters:
- ATR SL: 2.1
- TPs: 5
- Base RR: 0.7
- Confirmation: 3
- Cooldown: 10
- BE: ON after TP2
Expected Results:
- Winrate: 50-60%
- Net P/L: +5 to +10R per day
- SL: 20-30 pips
- TP1: 14-21 pips
Example 3: Gold H1 Swing Trading
Goal: 1-2 trades/day, maximum patience
Recommended Parameters:
- ATR SL: 2.4
- TPs: 6
- Base RR: 0.9
- Confirmation: 4
- Cooldown: 12
- BE: ON after TP2
Expected Results:
- Winrate: 55-65%
- Net P/L: +8 to +15R per week
- SL: 40-60 pips
- TP1: 36-54 pips
⚠️ Common Mistakes to Avoid
❌ MISTAKE #1: Using same parameters on all timeframes
M1 with ATR SL 2.5 → SL too wide, huge losses
H4 with ATR SL 1.5 → SL too tight, constant stop outs
❌ MISTAKE #2: Too many TPs on low timeframe
M1 with 6 TPs → Impossible to reach all TPs
❌ MISTAKE #3: Too long confirmation on M1
M1 with 5 confirmation bars → Misses all fast moves
❌ MISTAKE #4: Too short cooldown on H4
H4 with 3 bars cooldown → Overtrading, too many poor-quality trades
🎯 Testing Methodology
Step 1: Start with recommended values
Use the table above according to your timeframe
Step 2: Backtest on minimum 100 trades
Observe:
Winrate
Net P/L in R
Number of BE hits
Trade frequency
Step 3: Adjust based on results
If too many SL hits:
↑ Increase ATR SL Multiplier by +0.2
↑ Increase Confirmation Bars by +1
If not enough trades:
↓ Reduce Cooldown by -2
↓ Reduce Confirmation Bars by -1
If TPs never reached:
↓ Reduce Number of TPs by -1
↓ Reduce Base RR by -0.1
If too many BE but no real wins:
↑ Increase Base RR by +0.1
Disable BE temporarily
📈 Performance Tracking
Key indicators by timeframe:
TFTrades/DayMin WinrateNet P/L/DayAvg SL (pips)M110-2040%+3R10-15M55-1245%+4R15-20M153-850%+5R20-30H11-455%+3R40-60H40.5-260%+2R80-120
🚀 Final Advice
DO NOT USE THE SAME PARAMETERS ON DIFFERENT TIMEFRAMES!
Each timeframe has its own dynamics. Adapting parameters is not optional, it's MANDATORY for optimal results.
Different timeframe = Different parameters = Different results
Quick Reference Chart
M1 → AGGRESSIVE (tight SL, few TPs, quick BE)
M5 → BALANCED (default settings)
M15 → MODERATE (wider SL, more TPs)
H1 → PATIENT (wide SL, max TPs, late BE)
H4 → CONSERVATIVE (very wide SL, all TPs, very late BE)
📝 Best Practices
Always backtest on your specific timeframe before live trading
Start conservative - use higher ATR multipliers first
Track your stats - Wins, Losses, BE, Net P/L
Adjust gradually - change one parameter at a time
Respect your timeframe - don't force H4 parameters on M1
Use breakeven wisely - protect profits but don't choke trades
Monitor cooldown - too many trades = lower quality
🎓 Understanding the Strategy
EMA 9/21 Crossover
BUY: EMA9 crosses above EMA21
SELL: EMA9 crosses below EMA21
RSI Filter
Avoids overbought (>70) for longs
Avoids oversold (<30) for shorts
Confirmation System
Requires X consecutive candles meeting conditions
Reduces false signals
Take Profit Structure
Non-linear TP levels
TP1: 0.5R (default)
TP2: 1.0R
TP3: 1.5R
TP4: 2.0R
TP5: 2.5R
Risk Management
ATR-based stop loss (adapts to volatility)
Optional breakeven after specified TP
Cooldown prevents overtrading
🌟 Pro Tips
Gold (XAUUSD) specific: Use tighter parameters than forex pairs
NY Session: More volatility, tighter SL recommended
Asian Session: Lower volatility, consider skipping or wider SL
News events: Increase cooldown before/after major news
Trending markets: Increase Number of TPs
Ranging markets: Decrease Number of TPs, faster exits
Happy Trading! 🎯
Remember: Past performance does not guarantee future results. Always use proper risk management and never risk more than you can afford to lose.

