Dollar Volume + SD [ZTD]### So, What's the Big Deal with SD Dollar Volume?
TL:DR
What you see:
1. $ Volume = (Price * Volume) / 1M (we divide it by 1M by default so you don't have to look at 12 digits but you can select between 100k/1M/10M)
2. User selected M.A. period with difference sources
3. Up to 4 Standard Deviation from that M.A.
4. Color coded (explained below)
That's it, no fancy useless multi color rainbows. Functional, bringing depth and clarity to your analysis based on reality not optical illusion.
--------------
The Long version
You know how we've always looked at volume? It's a classic, but it's got a blind spot. A million shares traded when a stock is at $10 is a completely different ballgame from a million shares traded when it's at $200. The first is $10M in action; the second is $200M. Traditional volume treats them the same, but they are not the same story.
That's the whole idea behind the **Dollar Volume Standard Deviation (SD $VVOLUME)** indicator. Instead of just counting shares, it tracks the **actual dollar amount** ( also refered as Dollar Volume) changing hands. This gives you a much clearer picture of the real financial power behind a price move. It helps you see when the "big money" is truly stepping in or backing off.
Think about it this way: after a 20% drop on earnings, you might see a 10% volume increase and think, "Wow, buyers are stepping in!" But if you look at the *value traded*, it might actually be lower than the day before because the share price is so much cheaper. This indicator cuts through that noise.
What about that smaller stock you bought that suddenly doubles in prices in a matter of months. Do you really thing the volume you are looking at carries any meaning anymore?
On longer time frame? Think about Volume traded vs Value Traded on NVDA for example. Looking at volume alone on those charts is absolutely meaningless. I even wonder why volume alone ever existed in the first place as an indicator.
### How to Use It in Your Trading
This isn't just theory; here’s how you can actually use it to make better decisions.
#### Reading the Indicator
The indicator is designed to be visual and intuitive. Here’s what you're looking at:
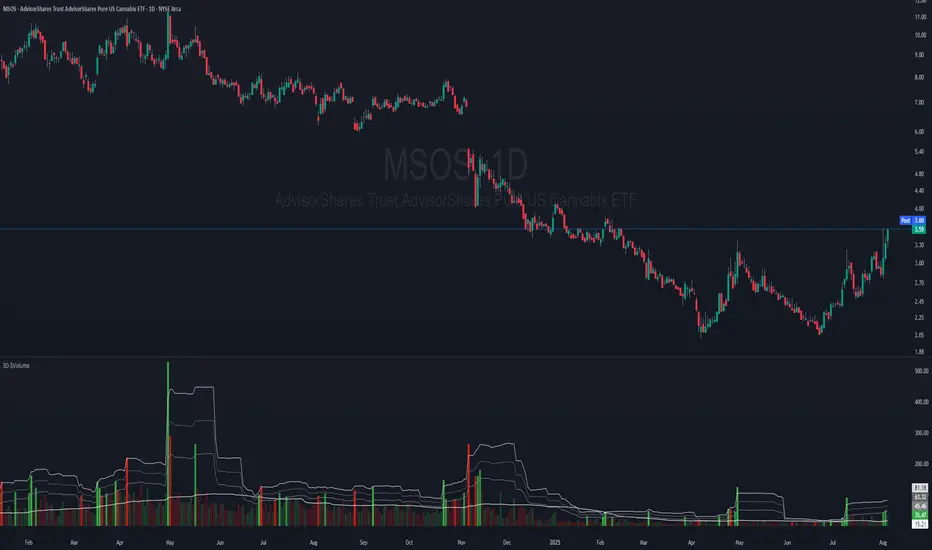
* **The Bars:** Each bar on the indicator represents the total dollar value traded during that period. Bigger bar, more money moved.
* **The White Line:** This is your baseline—the moving average of the value traded. It shows you the normal level of money flow for that stock.
* **Bar Colors (The Important Part):**
* **Direction:** **Green** means the stock closed higher in that period. **Red** means it closed lower. Simple enough.
* **Intensity:** This is the real magic. The brightness or intensity of the color tells you how significant that money flow was. A dull, faded bar means the value traded was pretty average. A **bright, intense bar** means the value was way above normal (usually 1 or 2 standard deviations away from the average). *That's* when you need to pay attention.
#### Actionable Signals for Your Strategy
* **Spotting High-Conviction Moves:** When you see a bright, intense red or green bar that towers over the others, that's a signal of major conviction. Big players are making a decisive move, either buying up everything in sight or dumping their positions. This is your cue that something significant is happening.
* **Confirming a Trend's Strength:** Are you in a strong uptrend? Look for a consistent pattern of bright green bars. This tells you that significant capital is flowing in to support the rising price. It's confirmation that the trend has legs.
* **Catching a Weakening Trend (Divergence):** This is a powerful one. Imagine the stock price is grinding out new highs, but on the SD
V
VOLUME
indicator, the bars are getting smaller and less intense. That's a major red flag. It shows that even though the price is inching up, the real money isn't following. There's no conviction, and the trend could be about to reverse.
* **Gauging Liquidity:** If the bars are consistently low and dull, it's a sign that interest in the stock is drying up. It's a good way to spot illiquid conditions and avoid getting trapped in a stock that's hard to get out of.
Ultimately, SD SEED_YASHALGO_NSE_BREADTH:VOLUME helps you see the market from a different angle. It's not just about the noise of shares being traded; it's about following the money.
Chỉ báo Khối lượng
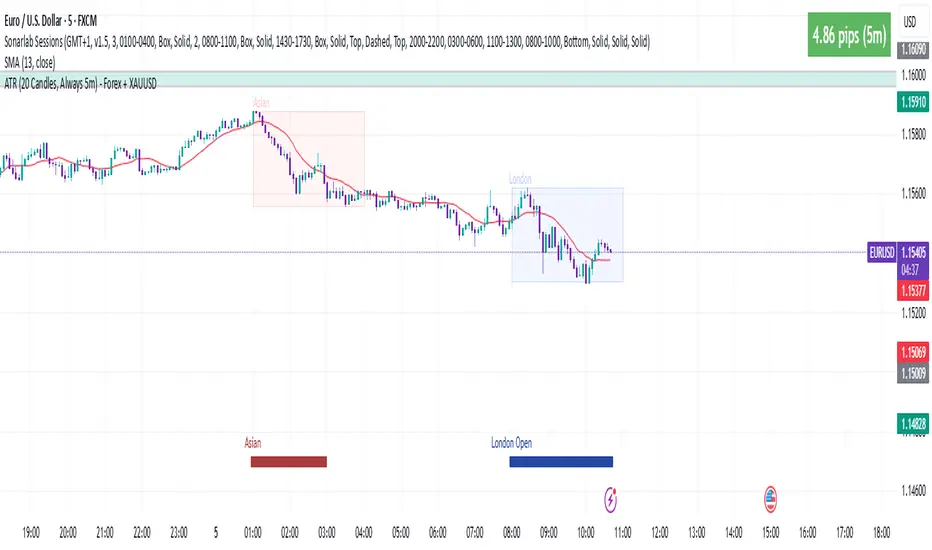
ATR 5 min- FOREX + XAUThis indicator displays the Average True Range (ATR) over the last 20 candles, calculated using the 5-minute timeframe, regardless of the chart timeframe you're currently viewing.
It supports:
All major forex pairs
XAUUSD (Gold), with ATR displayed in full dollars
Key Features
Always reflects 5-minute volatility
Accurate pip scaling:
JPY pairs = 1 pip = 0.01
Other forex pairs = 1 pip = 0.0001
XAUUSD = 1 pip = 1.00 (i.e., full dollar)
Clean and minimal top-right table display
Automatically adapts based on the instrument you're viewing
Helps traders gauge recent market volatility across timeframes
This is an ideal tool for scalpers, intraday traders, or swing traders who want to monitor short-term volatility conditions from any timeframe view.
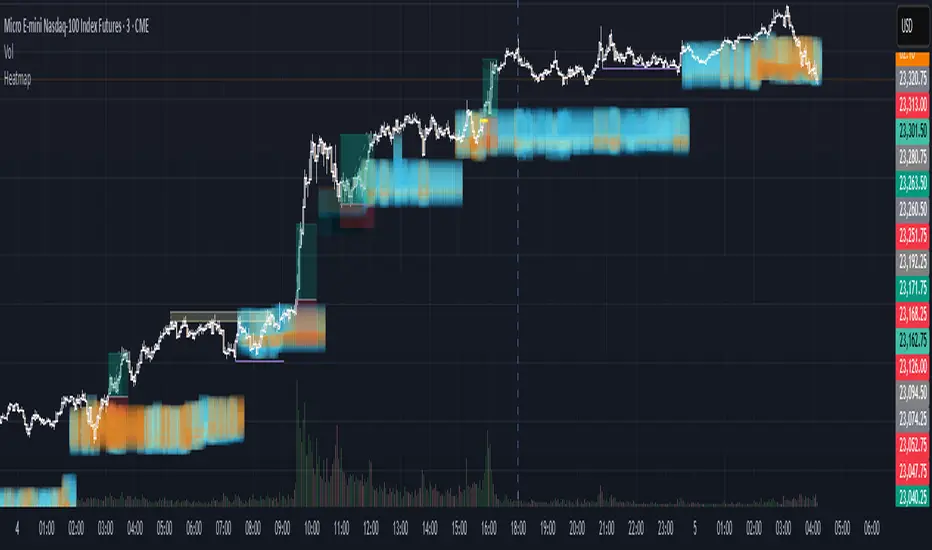
Institutional HeatmapHeatmap Range - Volume Profile Visualization Indicator
What This Indicator Does
The Heatmap Range indicator provides a sophisticated volume profile visualization that displays price levels with the highest trading activity using color-coded heatmaps directly on your chart. Unlike traditional volume indicators, this tool shows WHERE the most significant trading occurred within specific price ranges over a customizable lookback period.
Advanced Volume Analysis
Volume-Weighted Price Levels: Calculates and displays up to 20 price levels based on actual trading volume
Customizable Time Period: Analyze volume distribution over 10-500 bars (default: 180 bars)
Smart Bin Sizing: Adjustable pip range (0.1-50 pips) for precise level identification
Peak Detection: Automatically identifies and centers display around highest volume areas
Visual Customization
3 Color Patterns:
Inverted Heat (Orange to Dark Red)
Inverted Cool (Orange to Dark Blue)
Inverted Purple (Light Pink to Dark Purple)
Transparency Control: 0-95% transparency for optimal chart readability
Adaptive Display: Shows most relevant levels centered around peak volume
Multi-Asset Support
Forex Pairs (EUR/USD, GBP/USD, etc.)
Precious Metals (Gold/XAUUSD, Silver/XAGUSD)
Futures (NQ, ES, YM, etc.)
Cryptocurrencies
Stock Indices
Customizable Parameters
Histogram Period (10-500, Default: 180) Bars to analyze for volume distribution
Bin Range (0.1-50 pips, Default: 5.0) Price range for each volume level
Color Pattern (1-3, Default: 1) Visual color scheme selection
Average Volume Period (10-200, Default: 100) Period for volume normalization
Max Display Levels (5-20, Default: 20) Maximum price levels to show
Transparency (0-95%, Default: 50%) Opacity of heatmap display
How to Use
For Day Traders
Identify key support/resistance levels based on actual volume
Spot high-probability reversal zones
Plan entries/exits around significant volume levels
For Swing Traders
Analyze longer-term volume distribution patterns
Identify major accumulation/distribution zones
Confirm breakout levels with volume validation
For Scalpers
Quick identification of intraday volume hotspots
Real-time volume level updates
Precise entry/exit timing around volume clusters
Visual Interpretation
Darker Colors: Higher volume concentration (stronger levels)
Lighter Colors: Lower volume concentration
Color Intensity: Directly correlates to volume strength at that price level
Level Positioning: Automatically centers around peak volume areas
Technical Specifications
Pine Script Version: v5
Chart Overlay: Yes
Max Bars Back: 1000
Performance Optimized: Limited to 200 bins for smooth operation
Real-time Updates: Dynamic calculation on each bar close
Getting Started
Add to Chart: Apply indicator to any supported timeframe
Adjust Period: Set histogram period based on your trading style
Choose Colors: Select color pattern that suits your chart theme
Fine-tune Levels: Adjust bin range and max levels for optimal display
Set Transparency: Balance visibility with chart clarity
Important Notes
Minimum Data Requirement: Needs at least 10 bars of history to function
Performance: Higher periods and smaller bin ranges require more processing
Volume Dependency: Most effective on instruments with consistent volume data
Timeframe Agnostic: Works on all timeframes from 1-minute to monthly
Status Information
The indicator includes a real-time information table showing:
Current settings (Period, Bin Range, Color Pattern, Transparency)
Indicator status (Active/Loading)
Disclaimer: This indicator is for educational and informational purposes only. Past performance does not guarantee future results. Always conduct your own analysis and risk management before making trading decisions.
Compatible with TradingView's Pine Script v5 | Optimized for all market conditions | Professional-grade volume analysis
Win trades [Albassam]This script was inspired from my personal trading strategy for daily trades in 15 min frame.
main factor for trades in this indicator is:
Band : which indicates the range of movement
vwap : show momentum and type of the trend
how dose it work ?
please check the introduction video of the script
or whatsapp me : 0542228866

Previous VWAP Levels by Riotwolftrading The "Previous VWAP" indicator calculates and displays the previous session's Volume Weighted Average Price (VWAP) for five timeframes (Daily, Weekly, Monthly, Quarterly, Yearly).
Each VWAP is plotted as a horizontal line extending to the right edge of the chart, with customizable labels at the right to identify each level. The indicator is designed for traders who want to visualize key price levels from prior periods without cluttering the chart with current VWAPs or additional metrics like standard deviations.
**Functionality**:
- **Calculates Previous VWAPs**: Computes the VWAP for the previous session of each timeframe (Daily, Weekly, Monthly, Quarterly, Yearly) based on the input source (default: `hlc3`) and volume.
- **Visual Style** : Uses `line.new` to draw horizontal lines from five bars back to the current bar, ensuring the lines extend to the right edge of the chart. Labels are placed at the right edge using `label.new` for clear identification.
- **Customization** : Allows users to toggle visibility, adjust line styles, widths, colors, and label sizes, and choose between abbreviated or full label text.
- **Minimalist Design**: Focuses solely on previous VWAPs, omitting current VWAPs, rolling VWAPs, and standard deviation bands to keep the chart clean.
**Intended Use**: This indicator is useful for traders who rely on historical VWAP levels as support/resistance or reference points for trading decisions, particularly in strategies involving mean reversion or breakout trading.
---
### Rules and Features
*VWAP Calculation**:
- The VWAP is calculated as the cumulative sum of price (`src`) multiplied by volume (`sumSrcVol`) divided by the cumulative volume (`sumVol`) for each timeframe.
- The "previous VWAP" is the VWAP value from the prior session, captured when a new session begins (e.g., new day, week, month, etc.).
- The indicator uses the `hlc3` (average of high, low, close) as the default source, but users can modify this in the settings.
**Timeframes**:
- **Daily**: Previous day's VWAP.
- **Weekly**: Previous week's VWAP.
- **Monthly**: Previous month's VWAP.
- **Quarterly**: Previous quarter's VWAP (3 months).
- **Yearly**: Previous year's VWAP (12 months).
- New sessions are detected using `ta.change(time(period))` for each timeframe.
**Line Drawing**:
- Lines are drawn using `line.new` from `time ` (five bars back) to the current bar (`time`), ensuring they extend to the right edge of the chart.
- Lines are updated only on the last confirmed bar (`barstate.islast`) to optimize performance and avoid repainting.
- Previous lines are deleted (`line.delete`) to prevent overlapping or clutter.
**Labels**:
- Labels are drawn at the right edge (`x=time`, `xloc=xloc.bar_time`) with `label.new`.
- Users can choose between abbreviated labels (e.g., "pvD" for Previous Daily VWAP) or full labels (e.g., "Prev Daily VWAP").
- Label sizes are customizable (`tiny`, `small`, `normal`, `large`, `huge`).
- Labels are deleted (`label.delete`) on each update to maintain a clean chart.
5. **Customization Options**:
- **Visibility**: Toggle each VWAP (Daily, Weekly, Monthly, Quarterly, Yearly) on or off.
- **Colors**: Individual color settings for each VWAP line and label (default colors: Daily=#E12D7B, Weekly=#F67B52, Monthly=#EDCD3B, Quarterly=#3BBC54, Yearly=#2665BD).
- **Line Style**: Choose from `solid`, `dotted`, or `dashed` lines.
- **Line Width**: Adjustable from 1 to 4 pixels.
- **Label Settings**: Enable/disable labels, abbreviate text, and select label size.
- **Source**: Customize the price source (default: `hlc3`).
**Performance Optimization**:
- The indicator only updates lines and labels on the last confirmed bar to minimize computational overhead.
- Uses `var` to initialize variables and avoid unnecessary recalculations.
- Deletes previous lines and labels to prevent chart clutter.
---
### Usage Instructions
1. **Add to Chart**:
- In TradingView, go to the Pine Editor, paste the script, and click "Add to Chart."
- The indicator will overlay on the price chart, showing previous VWAP lines and labels.
2. **Configure Settings**:
- Open the indicator settings to customize:
- Toggle visibility of each VWAP timeframe.
- Adjust colors, line style, and width.
- Enable/disable labels, choose abbreviation, and set label size.
- Modify the source if needed (e.g., use `close` instead of `hlc3`).
3. **Interpretation**:
- **Previous VWAPs**: Act as dynamic support/resistance levels based on the prior session's volume-weighted price.
- **Timeframes**: Use shorter timeframes (Daily, Weekly) for intraday/swing trading, and longer timeframes (Monthly, Quarterly, Yearly) for positional trading.
- **Labels**: Identify each VWAP level at the right edge of the chart for quick reference.
4. **Best Practices**:
- Use on charts with sufficient volume data, as VWAP relies on volume (a warning is triggered if no volume data is available).
- Combine with other indicators (e.g., moving averages, RSI) for confirmation in trading strategies.
- Adjust line styles and colors to avoid visual overlap with other chart elements.
---
### Example Use Case
A trader using a 1-hour chart can add the "Previous VWAP" indicator to identify key levels from the prior day, week, or month. For example:
- The Previous Daily VWAP might act as a support level for a bullish trend.
- The Previous Weekly VWAP could serve as a target for a swing trade.
- Labels at the right edge make it easy to identify these levels without cluttering the chart.
This indicator provides a clean, customizable way to visualize previous VWAPs, making it ideal for traders who want historical price context with minimal chart noise. For the complete Pine Script code, refer to the artifact provided in the previous response.

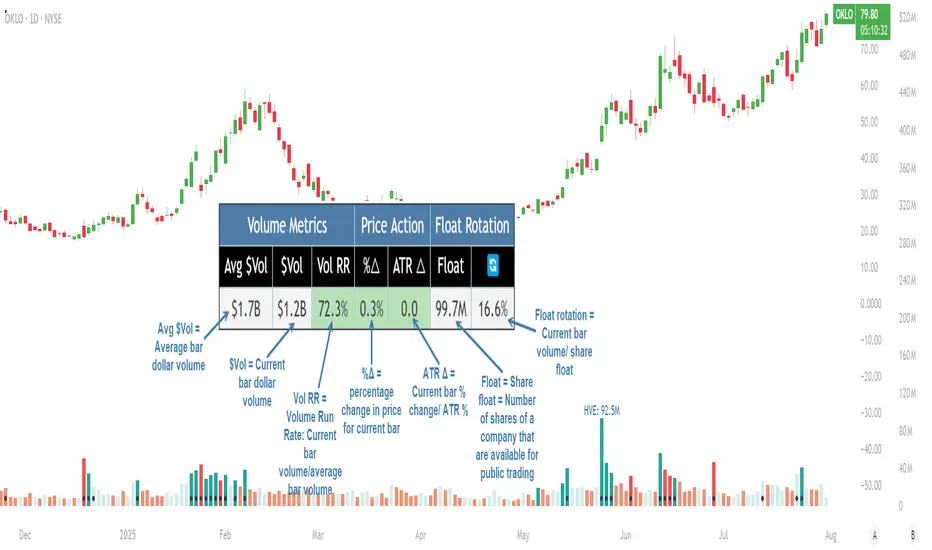
Pristine Volume AnalysisThe Pristine Volume Analysis indicator organizes volume, liquidity, and share structure data, allowing users to quickly gauge the relative volume a security is trading on, and whether it is liquid enough to trade🏆
Volume is an important metric to track when trading, because abnormally high volume tends to occur when a new trend is kicking off, or when an established trend is hitting a climax.
Track only the most important metrics, reducing mental clutter and noise:
▪ Volume run rate - Candle volume/ Avg candle volume
▪ Security liquidity - Average volume and average dollar volume
▪ Float rotation - Candle volume/ Float
This script automatically detects and flags the following conditions on volume bars:
▪ High volume run rate buying/selling based on user-defined thresholds
▪ HVE (highest volume ever) & HVY (highest volume in a year)
▪ High float rotation based on user-defined thresholds
Settings and Preferences
Customize this script based by setting preferred colors and thresholds:
Custom Alerts on HVE and HVY
Set custom alerts on a single equity or an entire watchlist to receive notifications when volume hits HVE or HVY.
Screen for HVE or HVY
Using the Pine Screener, scan watchlists for equities that have reached HVE or HVY.
Note: The Pine Screener is limited to calculations on the last 500 bars. If a symbol has less than 500 bars and has reached HVE, it will be included in the screener results. All symbols with more than 500 historical bars will not be included in the scan.
Volume Analysis Use Case : Confirming a breakout (1/3)
A high volume run rate as a stock breaks out to new highs can confirm a change of character and increase the odds of success on long setups. SMCI put in an HVE candle in January '24, sparking a super-performance run.
1-Month follow-through +137%
SMCI had plenty of gas left in the tank after putting in it's first HVE candle. The rest is history!
Volume Analysis Use Case : Gauging sentiment (2/3)
When a stock advances on repeated high run rate volume and an increasing angle of ascent (parabolic) , it can be a good indication that sentiment is overheated and it is time to reduce exposure to the stock.
Note:25% is the default float rotation threshold. This value can be customized based on your own trading style and preferences.
Following the parabolic ascent on high volume run rate and float rotation, HIMS topped, falling ~67% over the next two months!
Volume Analysis Use Case : Passing on a meme stock (3/3)
High float rotation often goes hand-in-hand with high stock volatility. One might opt out of trading a stock if it is outside their risk tolerance.
EGX30 Volume BY Sherif RaoufThe indicator can read volume for EGX30 with any time frame ( 10,15,30 mins ... etc. )

Heikin Ashi VolumeHeikin Ashi candles decrease market noise so that broader trends can be more easily visualized. In a typical chart utilizing Heikin Ashi candles, volume bars are colored in such a way that they also allow for the visualization of trends during a bullish/bearish move.
The Heikin Ashi Volume indicator allows the trader to continue to use the same volume bar coloring technique to visualize trends without having to utilize the Heikin Ashi candles, since a Heikin Ashi candle’s OHLC values are not true prices but instead based on calculations in order to provide the ‘denoising’ effect they are known for.
In addition to providing the Heikin Ashi Volume coloring effects, the Heikin Ashi Volume indicator also allows the user to set a volume threshold level where the bar colors will be darker unless volume is beyond that threshold, helping traders quickly determine if there is enough participation in the market at that time to justify taking risk in a trade when the market isn’t very active. The user has the option to show or hide the threshold line, change the colors of the bullish/bearish colors (for both above and below threshold volumes) and the option for the indicator to gradually brighten the bar colors are they approach the threshold instead of having a clear line of demarcation showing volume above or below the set threshold.

Volume Bars - Shubhashish DixitThis helps you to identify volume based on your given period and it solves the issues which we are unable to see units in the main bar of Volume default chart

Market DashboardMarket Dashboard — All-in-One Technical Indicator Panel
The Market Dashboard is a powerful visual tool that consolidates key technical indicators into a single on-chart table, helping traders make faster and more informed decisions. This script includes:
RSI — Detects overbought and oversold market conditions
MACD — Shows trend momentum and crossover signals
CVD (Cumulative Volume Delta) — Highlights buyer vs. seller pressure
Volume Analysis — Flags unusually high volume
ATR (Average True Range) — Displays current market volatility
Session Detector — Automatically identifies ASIAN, LONDON, or NEW YORK sessions based on UTC time
Fully Customizable — Adjust table position and text size to fit your chart layout
Designed for traders who want a clean, real-time snapshot of market dynamics, directly on the chart.

VOLUME Simple [Titans_Invest]VOLUME Simple
A streamlined volume analysis tool crafted for simplicity and smart signal detection.
Although simple in appearance, this indicator brings intelligent volume-based entries through configurable logic. Its design emphasizes clean and effective interpretation of volume signals.
⯁ WHAT IS THE VOLUME INDICATOR❓
The Volume indicator is a fundamental technical analysis tool that measures the number of shares or contracts traded in a security or market during a given period. It helps traders and investors understand the strength or weakness of a price movement, confirm trends, and predict potential reversals. Volume is typically displayed as a histogram below a price chart, with each bar representing the volume traded during a specific time interval.
⯁ HOW TO USE THE VOLUME❓
The Volume indicator can be used in several ways to enhance trading decisions:
• Trend Confirmation: High volume during a price move confirms the strength of that trend, while low volume can indicate a weak or unsustainable trend.
• Breakouts: A price breakout from a pattern or range accompanied by high volume is more likely to be valid and sustainable.
• Divergence: When the price moves in one direction and volume moves in the opposite direction, it can signal a potential reversal.
• Overbought/Oversold Conditions: Extreme volume levels can sometimes indicate that an asset is overbought or oversold, though this is less straightforward than with oscillators like the RSI.
⯁ ENTRY CONDITIONS
The conditions below are fully flexible and allow for complete customization of the signal.
______________________________________________________
🔹 CONDITIONS TO BUY 📈
______________________________________________________
▪︎ Signal Validity: The signal will remain valid for X bars .
🔹 volume > volume_MA * Trigger Signal (close > open)
🔹 volume > volume_MA * Trigger Signal (Keep State)
______________________________________________________
______________________________________________________
🔸 CONDITIONS TO SELL 📉
______________________________________________________
▪︎ Signal Validity: The signal will remain valid for X bars .
🔸 volume > volume_MA * Trigger Signal (close > open)
🔸 volume > volume_MA * Trigger Signal (Keep State)
______________________________________________________
______________________________________________________
🤖 AUTOMATION 🤖
• You can automate the BUY and SELL signals of this indicator.
______________________________________________________
______________________________________________________
⯁ UNIQUE FEATURES
______________________________________________________
Signal Validity: The signal will remain valid for X bars
Condition Table: BUY/SELL
Condition Labels: BUY/SELL
Plot Labels in the Graph Above: BUY/SELL
Automate and Monitor Signals/Alerts: BUY/SELL
Signal Validity: The signal will remain valid for X bars
Table of Conditions: BUY/SELL
Conditions Label: BUY/SELL
Plot Labels in the graph above: BUY/SELL
Automate & Monitor Signals/Alerts: BUY/SELL
______________________________________________________
📜 SCRIPT : VOLUME Simple
🎴 Art by : @Titans_Invest & @DiFlip
👨💻 Dev by : @Titans_Invest & @DiFlip
🎑 Titans Invest — The Wizards Without Gloves 🧤
✨ Enjoy!
______________________________________________________
o Mission 🗺
• Inspire Traders to manifest Magic in the Market.
o Vision 𐓏
• To elevate collective Energy 𐓷𐓏

Relative Volume Pulse [Asa]Relative Volume Pulse is a powerful intraday tool designed to help you instantly spot volume surges and anomalies compared to recent history. It highlights how today’s volume at each bar time compares to the typical volume observed at the same time over your chosen number of previous days. With intuitive color-coding and threshold logic, you can quickly identify both significant and extreme spikes in buying or selling activity—ideal for day traders, scalpers, and anyone who cares about real-time volume dynamics.
Key Features
Smart Intraday Volume Benchmarking:
Compares today’s volume to the average volume at the exact same time over the past X days, automatically adapting to typical intraday volume waves.
Dynamic Color Coding:
Up/Down Volume Bars:
Uses different colors for bullish and bearish candles.
Threshold Highlights:
Volume bars that exceed user-defined multiples of average (“Large” and “Extreme” thresholds) are highlighted with stronger colors, making true surges pop visually.
Configurable Visualization:
Choose to view today’s volume as columns, histogram, or line—whatever fits your workflow best.
Average Volume Overlay:
Plots the rolling intraday average as a reference line, so you can see at a glance what’s “normal” for any bar in the session.
Extreme Event Marker:
Optional marker flags bars that cross your “Extreme” volume threshold.
How It Works
For each bar, the script calculates the average volume at this exact time using your selected number of previous days (e.g., 5 days).
Today’s volume is compared to this average:
If volume exceeds your “Large” threshold (e.g., 1.5× average), the bar is colored with a more intense highlight.
If volume exceeds your “Extreme” threshold (e.g., 2× average), the bar is colored with the strongest highlight and optionally flagged with a marker.
Separate color controls for up and down candles let you instantly see whether surging volume is driven by buyers or sellers.
Typical Uses
Spotting Breakouts:
Quickly identify bars where volume is truly unusual for the time of day—filtering out routine open/close surges and focusing on real-time activity.
Scalping & Day Trading:
Use threshold-based color alerts to time entries or exits, especially when sudden volume accompanies price moves.
Volume-Based Confirmation:
Validate signals from other indicators by requiring confirmation from large or extreme relative volume.
Parameters
Number of Past Days for Average: How many previous days to use for the time-matched average.
Large / Extreme Thresholds: Customize what constitutes a notable or extreme volume event, as multiples of the average.
Up/Down & Highlight Colors: Choose your preferred colors for all volume and threshold levels.
Display Style: Select columns, histogram, or line to match your charting style.
Why Use This Indicator?
Most “relative volume” tools compare only to simple session averages, which miss the real ebb and flow of intraday trading. Relative Volume Pulse gives you contextually accurate volume analysis—helping you spot the bars that matter, not just those that look big on paper.
Stop guessing what’s “high” volume—see it, and act on it.

Buyer/Seller Zone (Simplified Version)📌 Indicator: Buyer/Seller Zone (Simplified Version)
This indicator is designed to highlight potential areas of strong buyer or seller activity based on advanced volume and volatility analysis. It identifies key candles that exhibit anomalous behavior — those standing out from typical market noise — and marks them as potential interest zones.
🔍 What it does:
Detects candles with unusually high volume (anomalies).
Filters them further based on strong price movement (volatility).
Marks bullish and bearish zones using customizable visuals: area, circle, or diamond.
Provides optional alerts when a buyer/seller signal is detected.
💡 How to use:
Use this tool to identify potential reversal or continuation zones.
Zones may act as strong support/resistance areas.
Some levels are more significant than others — do not trade every level blindly. Combine with your own analysis or wait for a retest/confirmation before entry.
⚙️ Customization:
Volume filter threshold
Volatility sensitivity
Visualization type, size, and transparency
🚨 Alerts: Set alerts for bullish, bearish, or any signal type.

🇰🇷 Kim'in Kim'out — Korean Premium TrackerKim’in Kim’out is a premium-tracking TradingView indicator that reveals Korean market sentiment by comparing real-time asset prices on Upbit (KRW) and Binance (USDT).
It detects when Korean traders are spot accumulating (Kim’in) or spot distributing (Kim’out) — enhanced by volume confirmation and trend context.
Perfect for crypto scalpers, swing traders, and arbitrage hunters.
⚙️ How It Works
Kimchi Premium: Measures how much more (or less) Koreans are paying on Upbit compared to Binance.
Volume Confirmation: Filters signals by comparing Upbit volume vs its moving average.
Signal Logic:
🔼 Kim’in: Premium exceeds the buy threshold + high volume
🔽 Kim’out: Premium drops below the sell threshold + high volume
Trend Context: Premium trend line gives insight into sustained interest/disinterest.
🎛️ Settings Overview
Input Description
Select Cryptocurrency Choose from supported coins (BTC, ETH, SOL, etc.)
Buy Threshold (%) How high the premium must be to trigger a Kim’in signal
Sell Threshold (%) How low the premium must be to trigger a Kim’out signal
Volume MA Period The number of candles for volume average
Volume Multiplier Volume spike ratio needed to confirm a signal
Show Info Table Toggle detailed premium stats in a side panel
Show Premium Zones Visual background zones (green/red/yellow)
Debug Mode Shows extra signals that trigger without volume confirmation
✅ How to Use It
Add the indicator to any chart (e.g. BTC/USDT)
Choose a coin from the dropdown (BTC, ETH, etc.)
Watch for:
Green Triangle Up (Kim’in) = Korean spot buy pressure confirmed
Red Triangle Down (Kim’out) = Korean selloff or disinterest
Use the Info Table (top-right) to see:
Premium %
Volume confirmation
Real-time KRW-USD exchange rate
Upbit vs Binance price comparison
Set Alerts:
Right-click on a signal → Add Alert on "Kim’in" or "Kim’out"
Or use the prebuilt alertconditions
🔔 Alert Messages
🇰🇷 Korean Premium BUY signal detected → Kim’in
🇰🇷 Korean Premium SELL signal detected → Kim’out
🧪 Best Practices
Use on 1H or 4H timeframe for best results
Confirm with broader market structure or confluence tools
Spot divergences between Binance and Upbit to predict regional flow shifts
🚫 Limitations
Works only with coins that have both Binance USDT & Upbit KRW pairs
Premium may be delayed by low liquidity or FX rate fluctuations (USDKRW)
Not suitable for lowcaps not listed on Upbit
Created by UKMC Crypto

Liquidity Trap Zones [PhenLabs]📊 Liquidity Trap Zones
Version: PineScript™ v6
📌 Description
The goal of the Liquidity Trap Zones indicator is to try and help traders identify areas where market liquidity appears abundant but is actually thin or artificial, helping traders avoid potential fake outs and false breakouts. This advanced indicator analyzes the relationship between price wicks and volume to detect “mirage” zones where large price movements occur on low volume, indicating potential liquidity traps.
By highlighting these deceptive zones on your charts, the indicator helps traders recognize where institutional players might be creating artificial liquidity to trap retail traders. This enables more informed decision-making and better risk management when approaching key price levels.
🚀 Points of Innovation
Mirage Score Algorithm: Proprietary calculation that normalizes wick size relative to volume and average bar size
Dynamic Zone Creation: Automatically generates gradient-filled zones at trap locations with ATR-based sizing
Intelligent Zone Management: Maintains clean charts by limiting displayed zones and auto-updating existing ones
Scale-Invariant Design: Works across all assets and timeframes with intelligent normalization
Real-Time Detection: Identifies trap zones as they form, not after the fact
Volume-Adjusted Analysis: Incorporates tick volume when available for more accurate detection
🔧 Core Components
Mirage Score Calculator: Analyzes the ratio of price wicks to volume, normalized by average bar size
ATR-Based Filter: Ensures only significant price movements are considered for trap zone creation
EMA Smoothing: Reduces noise in the mirage score for clearer signals
Gradient Zone Renderer: Creates visually distinct zones with multiple opacity levels for better visibility
🔥 Key Features
Real-Time Trap Detection: Identifies liquidity mirages as they develop during live trading
Dynamic Zone Sizing: Adjusts zone height based on current market volatility (ATR)
Smart Zone Management: Automatically maintains a clean chart by limiting the number of displayed zones
Customizable Sensitivity: Fine-tune detection parameters for different market conditions
Visual Clarity: Gradient-filled zones with distinct borders for easy identification
Status Line Display: Shows current mirage score and threshold for quick reference
🎨 Visualization
Gradient Trap Zones: Purple gradient boxes with darker centers indicating trap strength
Mirage Score Line: Orange line in status area showing current liquidity quality
Threshold Reference: Gray line showing your configured detection threshold
Extended Zone Display: Zones automatically extend forward as new bars form
📖 Usage Guidelines
Detection Settings
Smoothing Length (EMA) - Default: 10 - Range: 1-50 - Description: Controls responsiveness of mirage score. Lower values make detection more sensitive to recent price action
Mirage Threshold - Default: 5.0 - Range: 0.1-20.0 - Description: Score above this level triggers trap zone creation. Higher values reduce false positives but may miss subtle traps
Filter Settings
ATR Length for Range Filter - Default: 14 - Range: 1-50 - Description: Period for volatility calculation. Standard 14 works well for most timeframes
ATR Multiplier - Default: 1.0 - Range: 0.0-5.0 - Description: Minimum bar range as multiple of ATR. Higher values filter out smaller moves
Display Settings
Zone Height Multiplier - Default: 0.5 - Range: 0.1-2.0 - Description: Controls trap zone height relative to ATR. Adjust for visual preference
Max Trap Zones - Default: 5 - Range: 1-20 - Description: Maximum zones displayed before oldest are removed. Balance clarity vs. history
✅ Best Use Cases
Identifying potential fakeout levels before entering trades
Confirming support/resistance quality by checking for liquidity traps
Avoiding stop-loss placement in trap zones where sweeps are likely
Timing entries after trap zones are cleared
Scalping opportunities when price approaches known trap zones
⚠️ Limitations
Requires volume data - less effective on instruments without reliable volume
May generate false signals during news events or genuine volume spikes
Not a standalone system - combine with price action and other indicators
Zone creation is based on historical data - future price behavior not guaranteed
💡 What Makes This Unique
First indicator to specifically target liquidity mirages using wick-to-volume analysis
Proprietary normalization ensures consistent performance across all markets
Visual gradient design makes trap zones immediately recognizable
Combines multiple volatility and volume metrics for robust detection
🔬 How It Works
1. Wick Analysis: Calculates upper and lower wicks for each bar. Normalizes by average bar size to ensure scale independence
2. Mirage Score Calculation: Divides total wick size by volume to identify thin liquidity. Applies EMA smoothing to reduce noise. Scales result for optimal visibility
3. Zone Creation: Triggers when smoothed score crosses threshold. Creates gradient boxes centered on trap bar. Sizes zones based on current ATR for market-appropriate scaling
💡 Note: Liquidity Trap Zones works best when combined with traditional support/resistance analysis and volume profile indicators. The zones highlight areas of deceptive liquidity but should not be the sole factor in trading decisions. Always use proper risk management and confirm signals with price action.

THF Crossover and Trend Signals Golden & Death Cross with VolumeScript Overview:
This Pine Script is designed to assist traders in identifying key buy/sell signals and major trend changes on the chart using Exponential Moving Averages (EMA) and Simple Moving Averages (SMA), as well as visualizing Golden Cross and Death Cross events. The script also includes a volume indicator to highlight the volume trading activity in relation to the price movements.
Key Features:
1. Moving Averages:
EMA 21: Exponential Moving Average over a 21-period, shown in green.
EMA 50: Exponential Moving Average over a 50-period, shown in yellow.
SMA 50: Simple Moving Average over a 50-period, shown in red.
SMA 200: Simple Moving Average over a 200-period, shown in blue.
2. Signals:
Buy Signal: Generated when EMA 21 crosses above SMA 50, indicating a potential upward trend. Displayed with a green label below the price bar.
Sell Signal: Generated when EMA 21 crosses below SMA 50, indicating a potential downward trend. Displayed with a red label above the price bar.
3. Golden Cross (Bullish Trend):
A Golden Cross occurs when EMA 50 crosses above SMA 200, which often signals the start of a long-term upward trend. The signal is displayed with a yellow label below the price bar.
4. Death Cross (Bearish Trend):
A Death Cross occurs when EMA 50 crosses below SMA 200, which often signals the start of a long-term downward trend. The signal is displayed with a blue label above the price bar.
5. Volume Indicator:
The volume is plotted as colored columns. Green indicates higher volume than the 20-period moving average, and red indicates lower volume.
A Volume Moving Average (SMA 20) is also plotted to compare volume changes over time.
How the Script Works:
1. The EMA and SMA lines are plotted on the chart, providing a visual representation of the short- and long-term trends.
2. Buy/Sell signals are triggered based on the crossover between EMA 21 and SMA 50, helping to identify potential entry and exit points.
3. The Golden Cross and Death Cross indicators highlight major trend reversals based on the crossover between EMA 50 and SMA 200, providing clear visual cues for long-term trend changes.
4. Volume is displayed alongside price movements, offering insight into the strength or weakness of a trend.
Key Customizations:
Moving Average Periods: Users can modify the lengths of the EMAs and SMAs for customized analysis.
Volume Moving Average Period: The script allows for adjustment of the volume moving average period to suit different market conditions.
Signal Visibility: The size and color of the buy, sell, Golden Cross, and Death Cross signals can be easily customized to make them more prominent on the chart.
Conclusion:
This script is ideal for traders looking to combine price action with volume analysis, using key technical indicators such as EMA, SMA, Golden Cross, and Death Cross to make informed decisions in trending markets.
---
This explanation covers all aspects of the script and provides a clear understanding of its functionality, which is helpful for sharing the script or using it as an educational resource.

Big Trade % Heatmap### Big Trade % Heatmap
**Quick overview**
This indicator highlights where “whale” activity is clustered by showing what fraction of the recent candles contained *large‑value trades*. A candle is considered “big” when its notional volume (`volume × close`) exceeds your chosen USD threshold. You instantly see:
* **Percent of big candles** in the last *N* bars, refreshed at the cadence you pick.
* **On‑chart labels & markers** every refresh, so the chart stays clean.
* **Optional heat‑map background** that turns orange (>20 %) or green (>50 %) when big‑trade concentration spikes.
* **Ready‑made alert** when big‑trade dominance crosses 50 %.
---
#### How it works
1. **Trade size per candle** – Calculates `close × volume` to estimate dollars traded.
2. **Threshold filter** – Flags candles whose value is above *Big Trade Threshold (\$)*.
3. **Look‑back window** – Counts what percentage of the last *Lookback Window (X Candles)* were “big.”
4. **Refresh interval** – Repeats the measurement only every *Refresh Interval (Every X Candles)* to avoid label spam.
5. **Visuals** –
* A small blue ▼ above the bar + a text label such as `35.00 % > $25 000`.
* Background shading (green/orange) for quick, at‑a‑glance sentiment.
---
#### Inputs
| Input | Purpose | Default |
| -------------------------------------- | ----------------------------------------------------- | ------- |
| **Lookback Window (X Candles)** | How many recent bars to sample for the % calculation. | 20 |
| **Refresh Interval (Every X Candles)** | How often to display a new label/marker. | 5 |
| **Big Trade Threshold (\$)** | Minimum USD value for a candle to count as “big.” | 10 000 |
Tune these to the symbol and timeframe you trade (e.g., raise the threshold for BTC‑USDT 1‑h, lower it for micro‑caps).
---
#### Alerts
Enable **“High Big Trade %”** to get notified the moment more than half of the last *N* candles qualify as big trades—handy for spotting sudden accumulation or distribution.
---
#### Typical use cases
* **Breakout confirmation** – A surge in big‑trade % just before price escapes a range can validate the move.
* **Whale spotting** – Detect hidden accumulation on pullbacks or aggressive selling into rallies.
* **Filter noise** – Combine with your favorite trend indicator; only act when both align.
---
> *Built with Pine Script v6. Always back‑test before trading live; this tool is for educational purposes and not financial advice.*

Volume-Based Candle ShadingThe Volume Shading indicator dynamically adjusts the color brightness of each price bar based on relative volume levels. It helps traders quickly identify whether a candle formed on low, average, or high volume without needing to reference a separate volume pane.
Candles are shaded dynamically as they form, so you can watch volume flow into them in real time. This indicator is designed to be as minimally intrusive as possible, allowing you to visualize volume levels without extra clutter on your charts.
The additional volume indicator in the preview above is there just for a point of reference to allow you to see how the shading on the bars correlates to the volume.
⸻
SETTINGS:
Bullish and bearish base colors — These serve as the midpoint (average volume) for shading.
Brightness mapping direction — Optionally invert the shading so that either high volume appears darker or lighter.
Volume smoothing length — Defines how many bars are averaged to determine what constitutes “normal” volume.
Candles with volume above average will appear darker or lighter depending on user preference, while those with average volume will be painted the chosen colors, giving an intuitive gradient that enhances volume awareness directly on the chart.
⸻
USES:
Confirming price action: Highlight when breakout candles or reversal bars occur with high relative volume, strengthening signal conviction.
Spotting low-volume moves: Identify candles that lack volume support, potentially signaling weak continuation or false breakouts.
Enhancing visual analysis: Overlay volume dynamics directly onto price bars, reducing screen clutter and aiding faster decision-making.
Custom visual workflows: Adapt the visual behavior of candles to your trading style by choosing color direction and base tones.

Exchanges Combined Volume📊 Exchanges Combined Volume
(Aggregated Multi-Exchange Volume: Binance, OKX, Bybit, etc.) by BIGTAKER*
🔍 Purpose
The Exchanges Combined Volume indicator aggregates real-time trading volumes from multiple global exchanges for a specific asset (e.g., a cryptocurrency).
Instead of relying on a single market, it provides a broader view of market activity, helping users detect abnormal volume behavior and increased participation across the entire market.
⚙️ Supported Exchanges
* USDT Markets
`Binance`, `OKX`, `Bybit`, `Bitget`, `Gate.io`
* USD Markets
`Coinbase`, `Bitfinex`, `Bitstamp`
* Default
Includes the current chart symbol’s native volume by default.
🧮 Core Calculation Logic
1. 📛 Symbol Normalization (cleanSymbol)
Prefixes such as `1000`, `10000`, `100000`, or `1M` (common in leveraged tickers) are automatically removed to extract the base token.
> Example:
> `1000PEPEUSDT` → `PEPEUSDT`
2. 📈 Volume Requests from External Exchanges
Volume is retrieved using the `` format (e.g., `'BINANCE:PEPEUSDT'`, `'COINBASE:BTCUSD'`).
Invalid or delisted pairs are safely ignored using `ignore_invalid_symbol=true`.
3. 📊 Total Volume Calculation
totalVolume = usdtVolume + usdVolume + currentSymbolVolume
The indicator sums the volume from all target exchanges plus the volume from the current chart symbol.
4. 📏 Comparison to Average Volume
* Period: `length = 60` (Simple Moving Average over 60 candles)
* A candle is considered **high-intensity** if:
5. 🎨 Visual Styling
| Condition | Color | Meaning |
| -------------------------- | --------------------- | ----------------------- |
| High-volume Bullish Candle | Light Green (#30db78) | Strong Buying Activity |
| High-volume Bearish Candle | Bright Red (#ff0000) | Strong Selling Activity |
| Normal Bullish Candle | Dark Green (#3c7058) | Regular Buying Volume |
| Normal Bearish Candle | Dark Red (#682e2c) | Regular Selling Volume |
📌 Use Cases
* Detect synchronized volume surges across major global exchanges.
* Identify pre-pump accumulation phases on altcoins.
* Combine with premium gap indicators (e.g., Kimchi Premium) to identify leading market sentiment.
* Confirm breakout momentum with multi-exchange volume validation.
📘 Notes & Warnings
* Listing differences across exchanges may result in **zero volume** on some platforms.
* Prefixes like `1000`, `1M`, etc., are automatically removed to **improve symbol matching accuracy**.
* As volume units are not standardized, this indicator is best suited for **absolute value analysis**, not ratio-based comparisons.

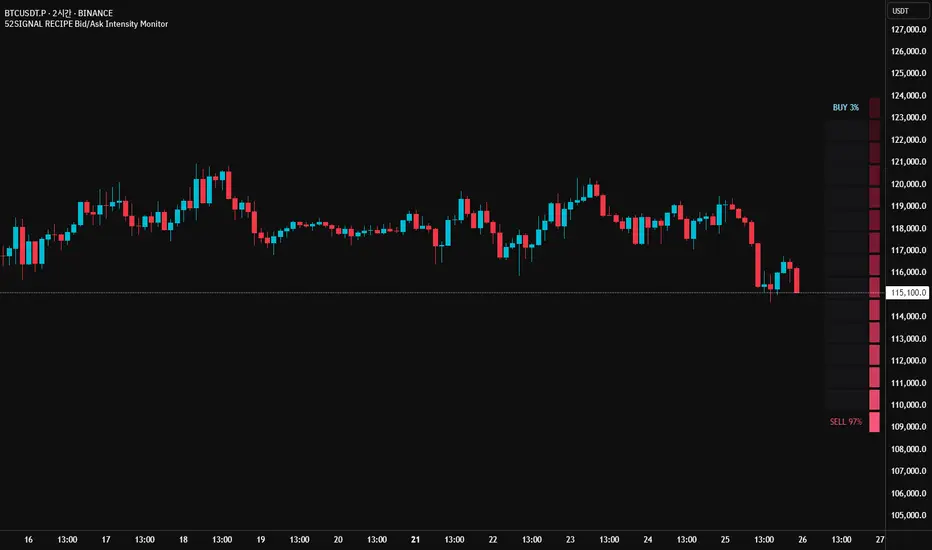
52SIGNAL RECIPE Bid/Ask Intensity Monitor═══ 52SIGNAL RECIPE Bid/Ask Intensity Monitor ═══
◆ Overview
52SIGNAL RECIPE Bid/Ask Intensity Monitor is a technical indicator that visualizes the balance of buying and selling forces in the market in real-time. Based on candle structure, this indicator calculates the relative strength of buying and selling pressure, displaying it through an intuitive color gradient gauge that allows traders to instantly grasp short-term market psychology and trading activity.
─────────────────────────────────────
◆ Key Features
• Intuitive Visualization: Instantly recognize buy/sell ratios through color gradient gauges
• Real-time Force Balance: Accurately display the buy/sell force ratio as a percentage in the current candle
• Candle Structure Analysis: Interpret market participant behavior through relationships between high, low, and close prices
• Chart Overlay: Displayed on the chart to observe changes in force balance alongside price movements
• Color Psychology: Provides intuitive psychological understanding through blue series (buy) and red series (sell) colors
─────────────────────────────────────
◆ Technical Foundation
■ Buy/Sell Ratio Calculation
• Basic Principle: Measure the relative strength of buyers and sellers by analyzing candle structure
• Buy Ratio Calculation: (Close - Low) ÷ (High - Low)
• Sell Ratio Calculation: 1 - Buy Ratio
• Interpretation Logic: The closer the closing price is to the high, the stronger the buying force; the closer to the low, the stronger the selling force
■ Visualization Mechanism
• Gradient Color Map: Express buy/sell intensity through 12-level color gradients
• Buy Color Range: Gradual change from light sky blue (#8be2ff) to deep navy blue (#103c60)
• Sell Color Range: Gradual change from light pink (#f65575) to deep burgundy (#3d101a)
• Gauge Structure: Vertical table positioned in the middle right of the chart for enhanced visual focus
─────────────────────────────────────
◆ Practical Applications
■ Market Psychology Identification
• Strong Buying Pressure Signals:
▶ When buy ratio is displayed as 70% or higher
▶ When the gauge is filled with bright blue shades
• Strong Selling Pressure Signals:
▶ When sell ratio is displayed as 70% or higher
▶ When the gauge is filled with bright red shades
• Force Balance State:
▶ When buy/sell ratio is in the 40-60% range
▶ When the color distribution in the gauge is even
■ Trading Strategy Application
• Trend Confirmation Strategy:
▶ Consecutive high buy ratios (70% or more) signal uptrend confirmation
▶ Consecutive high sell ratios (70% or more) signal downtrend confirmation
• Reversal Detection Strategy:
▶ Decreasing sell ratio during a downtrend suggests potential rebound
▶ Decreasing buy ratio during an uptrend suggests potential correction
• Volatility Breakout Strategy:
▶ Rapid changes in buy/sell ratio from a balanced state (50%) provide breakout signals
▶ Dramatic shifts in the opposite direction after extreme ratios signal trend reversals
─────────────────────────────────────
◆ Advanced Setting Options
■ Gauge Settings
• Gauge Width: Default value 15 (can be adjusted narrower or wider)
• Position Adjustment: Can be positioned at various locations on the chart (default is middle right)
• Border Thickness: Adjust border thickness for gauge visibility (default is 4)
■ Color Customization
• Buy Gradient: Color range can be modified according to personal preference
• Sell Gradient: Color range can be modified according to personal preference
• Transparency Settings: Optimize chart readability by adjusting background color transparency
■ Display Frequency Settings
• Update Cycle: Can be set to update every bar or at specific intervals
• History Length: Set display range for historical data
─────────────────────────────────────
◆ Synergy with Other Indicators
• Volume Profile: Analyze the Bid/Ask Intensity Monitor together with volume distribution to confirm buying/selling pressure at key price levels
• RSI: Improve signal reliability by checking extreme values of the Bid/Ask Intensity Monitor alongside RSI's overbought/oversold levels
• Moving Averages: Observe changes in the Bid/Ask Intensity Monitor when price is near key moving averages to assess support/resistance strength
• Bollinger Bands: Observe the Bid/Ask Intensity Monitor's reaction at band boundaries to evaluate potential reversals or trend continuation
─────────────────────────────────────
◆ Conclusion
52SIGNAL RECIPE Bid/Ask Intensity Monitor is a powerful tool that visualizes market participants' psychology and behavior in real-time based on candle structure. Through intuitive color gradients and percentage displays, it allows for immediate understanding of the balance between buying and selling forces, greatly aiding in predicting short-term market direction and momentum. When used in conjunction with other technical indicators, it provides a comprehensive understanding of market conditions, contributing to more accurate entry and exit timing decisions. This indicator, particularly useful in scalping and short-term trading, will enhance the chart analysis capabilities of all traders.
─────────────────────────────────────
※ Disclaimer: Past performance does not guarantee future results. Always use appropriate risk management strategies.
═══ 52SIGNAL RECIPE Bid/Ask Intensity Monitor ═══
◆ 개요
52SIGNAL RECIPE Bid/Ask Intensity Monitor는 실시간으로 시장의 매수/매도 세력 균형을 시각화하는 기술적 지표입니다. 이 지표는 캔들 구조를 기반으로 매수와 매도 압력의 상대적 강도를 계산하고, 직관적인 그라데이션 색상 게이지를 통해 표시함으로써 시장 참여자들의 단기 심리와 거래 활동을 한눈에 파악할 수 있게 합니다.
─────────────────────────────────────
◆ 주요 특징
• 직관적인 시각화: 매수/매도 비율을 색상 그라데이션 게이지로 즉각적으로 인식
• 실시간 세력 균형: 현재 봉에서의 매수/매도 세력 비율을 백분율로 정확히 표시
• 캔들 구조 기반 분석: 고가, 저가, 종가의 관계를 통해 시장 참여자 행동 해석
• 차트 오버레이: 차트 위에 표시되어 가격 움직임과 함께 세력 균형 변화 관찰 가능
• 색상 심리학 활용: 파란색 계열(매수)과 붉은색 계열(매도)로 직관적인 심리적 이해 제공
─────────────────────────────────────
◆ 기술적 기반
■ 매수/매도 비율 계산
• 기본 원리: 캔들의 구조를 분석하여 매수자와 매도자의 상대적 강도 측정
• 매수 비율 계산: (종가 - 저가) ÷ (고가 - 저가)
• 매도 비율 계산: 1 - 매수 비율
• 해석 논리: 종가가 고가에 가까울수록 매수 세력이 강하고, 저가에 가까울수록 매도 세력이 강함
■ 시각화 메커니즘
• 그라데이션 컬러 맵: 12단계 색상 그라데이션으로 매수/매도 강도 표현
• 매수 색상 범위: 밝은 하늘색(#8be2ff)에서 짙은 남색(#103c60)까지 점진적 변화
• 매도 색상 범위: 밝은 분홍색(#f65575)에서 짙은 적갈색(#3d101a)까지 점진적 변화
• 게이지 구조: 세로형 테이블로 우측 중앙에 배치되어 시각적 주목도 향상
─────────────────────────────────────
◆ 실용적 응용
■ 시장 심리 파악
• 강한 매수 압력 신호:
▶ 매수 비율이 70% 이상으로 표시될 때
▶ 게이지가 밝은 청색 계열로 채워질 때
• 강한 매도 압력 신호:
▶ 매도 비율이 70% 이상으로 표시될 때
▶ 게이지가 밝은 적색 계열로 채워질 때
• 세력 균형 상태:
▶ 매수/매도 비율이 40-60% 범위에 있을 때
▶ 게이지의 색상 분포가 균등할 때
■ 트레이딩 전략 적용
• 추세 확인 전략:
▶ 연속적인 높은 매수 비율(70% 이상)은 상승 추세 확인 신호
▶ 연속적인 높은 매도 비율(70% 이상)은 하락 추세 확인 신호
• 반전 탐색 전략:
▶ 하락 추세 중 매도 비율 감소는 반등 가능성 시사
▶ 상승 추세 중 매수 비율 감소는 조정 가능성 시사
• 변동성 돌파 전략:
▶ 균형 상태(50%)에서 급격한 매수/매도 비율 변화는 돌파 신호 제공
▶ 극단적 비율 후 반대 방향으로의 급격한 변화는 추세 전환 신호
─────────────────────────────────────
◆ 고급 설정 옵션
■ 게이지 설정
• 게이지 너비: 기본값 15 (좁게 또는 넓게 조정 가능)
• 위치 조정: 차트의 다양한 위치에 배치 가능 (우측 중앙 기본값)
• 테두리 두께: 게이지 가시성을 위한 테두리 굵기 조절 (기본값 4)
■ 색상 커스터마이징
• 매수 그라데이션: 개인 선호에 따라 색상 범위 수정 가능
• 매도 그라데이션: 개인 선호에 따라 색상 범위 수정 가능
• 투명도 설정: 배경색 투명도 조절로 차트 가독성 최적화
■ 표시 빈도 설정
• 업데이트 주기: 모든 봉마다 또는 특정 간격으로 업데이트 설정 가능
• 히스토리 길이: 과거 데이터에 대한 표시 범위 설정
─────────────────────────────────────
◆ 다른 지표와의 시너지
• 볼륨 프로파일: Bid/Ask Intensity Monitor와 볼륨 분포를 함께 분석하여 주요 가격대의 매수/매도 압력 확인
• RSI: Bid/Ask Intensity Monitor의 극단치와 RSI의 과매수/과매도 수준을 함께 확인하여 신호 신뢰도 향상
• 이동평균선: 가격이 주요 이동평균선 근처에서 Bid/Ask Intensity Monitor 변화를 관찰하여 지지/저항 강도 판단
• 볼린저 밴드: 밴드 경계에서의 Bid/Ask Intensity Monitor 반응을 관찰하여 반전 또는 추세 지속 가능성 평가
─────────────────────────────────────
◆ 결론
52SIGNAL RECIPE Bid/Ask Intensity Monitor는 캔들 구조를 기반으로 시장 참여자들의 심리와 행동을 실시간으로 시각화하는 강력한 도구입니다. 직관적인 색상 그라데이션과 백분율 표시를 통해 매수/매도 세력의 균형을 즉각적으로 파악할 수 있어, 시장의 단기적 방향성과 모멘텀을 예측하는 데 큰 도움이 됩니다. 다른 기술적 지표와 함께 사용하면 시장 상황에 대한 종합적인 이해를 얻을 수 있으며, 이는 더 정확한 진입 및 퇴출 타이밍을 결정하는 데 기여합니다. 특히 스캘핑과 단기 트레이딩에서 유용하게 활용될 수 있는 이 지표는 모든 트레이더의 차트 분석 능력을 한 단계 향상시켜 줄 것입니다.
─────────────────────────────────────
※ 면책 조항: 과거 성과가 미래 결과를 보장하지 않습니다. 항상 적절한 리스크 관리 전략을 사용하세요.
Z-Score Multi-Model ClusteringA price/volume clustering framework combining three market behavior models into a single indicator. Designed to help identify emerging trend strength, turning points, and volatility-driven entries or exits.
🔍 How It Works
This indicator classifies market states by comparing normalized price/volume behavior (via Z-Score) to different types of statistical or geometric "cluster centers." You can choose from three clustering approaches:
🧠 Clustering Models
1. Percentile (Z+CVD) – Trend Momentum Bias
Uses volume Z-Score + Cumulative Volume Delta (CVD).
Detects institutional pressure by clustering volume surges with directional delta.
Best for: Breakouts, momentum trades, volume-led reversals.
Cluster Colors:
🔹 Green triangle = Strong bullish confluence
🔻 Red triangle = Bearish divergence (bull trap risk)
⚪ Gray = Neutral/low conviction
2. Euclidean (Z+Slope) – Swing Mean-Reversion
Measures the angle of recent Z-score slope and compares it to directional cluster centers.
Helps detect early directional shifts or exhaustion.
Best for: Swing entries, pullback setups, exit timing
3. Hilbert Phase – Turn Detection via Signal Phase
Applies Hilbert Transform to the Z-Score, measuring the phase difference between trend and oscillator components.
Ideal for anticipating turns or detecting cyclical inflection points.
Useful for: Scalping, top/bottom spotting, volatility fades
✅ Features
Auto-updating cluster logic based on current data
Tooltips and clean user interface
Optional cluster bar coloring (can be toggled off)
Signal-only plotting keeps candlesticks readable
Clear entry/exit logic with triangle markers
Supports trend, swing, and oscillation-based systems
🛠️ Suggested Use Cases
Combine with VWAP, Session High/Low, or Liquidity Zones to confirm entry conditions.
Use Cluster 2 (strong bullish) on pullbacks to trend structure for add-on entries.
Use Cluster 1 in strong trends to watch for potential traps or exits.
Toggle models based on your strategy: e.g., Hilbert for scalping, Percentile for macro trend breaks.
🧪 Best Timeframes
Works across all markets and timeframes
For Percentile (Z+CVD), use intraday TF with 1m–5m CVD source
Hilbert and Euclidean preferred on 5m–1h for accurate slope/phase signals
⚠️ Notes
Clusters do not generate trade signals alone; use them in context with structure, VWAP, or trend filters.
Marker signals are filtered with a magnitude threshold to reduce noise.

Z-Score Volume with CVD Clustering Script Title:
Z-Score Volume with CVD Clustering & NY VWAP
📘 Description:
This indicator combines statistical volume analysis with order flow confirmation to detect high-probability trade zones and volume-based divergences.
📌 Components:
Z-Score of Volume: Identifies statistically significant volume surges or drops relative to a moving average baseline.
Cumulative Volume Delta (CVD): Gauges net buying vs. selling pressure using high-frequency bid/ask delta.
K-Means Clustering: Applies clustering logic to classify each bar into:
Cluster 2 – Strong Bullish: Z-Score and CVD both strong
Cluster 1 – Divergence / Bull Trap: Z-Score high, but weak CVD
Cluster 0 – Neutral / Noise: No clear alignment
Anchored VWAP (NY Session Open): Confirms market structure and institutional trend bias from 9:30 AM ET forward.
🎯 Suggested Applications:
✅ 1. Trend Continuation Entries (Add-ons):
Look to add to positions when:
Cluster 2 signal occurs
Price is above the NY session VWAP
Price structure has broken out of prior day high/low or range
⚠️ 2. Divergence Detection (Fade Traps):
Cluster 1 signals a bearish divergence (e.g., high volume but weak CVD).
Especially useful when price is failing to stay above VWAP.
Useful for early exits or reversal setups.
📊 3. Volume Profile Confirmation:
Combine with fixed or session-based volume profile tools.
Use Z-Score clusters to confirm volume spikes into low-volume nodes (LVNs) or during imbalance transitions.
📍 4. VWAP Structure Confirmation:
Anchored VWAP acts as a dynamic reference point.
Helps confirm acceptance vs. rejection zones at key institutional levels.
📈 Visuals & Alerts:
Color-coded volume bars show intensity of Z-Score & CVD confluence
CVD Line plots real-time delta bias with green/red coloring
Cluster-based shape markers highlight key bars for actionable signals
Optional: Add alerts for Cluster 2 above VWAP or Cluster 1 below VWAP
⚙️ Customization Options:
Adjustable Z-Score length
Custom anchor timeframe for CVD (e.g., 1D or sessions)
Adjustable max lookback depth
Toggle VWAP inclusion
Extendable to include additional filters: RSI, structure break alerts, etc.
🔧 Ideal Use Cases:
NY session intraday traders (ES, NQ, CL, 6E, FX pairs)
Breakout traders wanting order flow confirmation
Mean reversion traders spotting fake moves
Volume-based scalpers looking for edge on short-term order imbalance
