Dự đoán ETH từ 11/06/25.⭐️⭐️⭐️⭐️⭐️ Dự đoán ETH từ 11/06/25.
👉 Sell limit: 2,850-2,900
👉SL: 2,950
👉TP: 2,400-2,500
⭐️ Khuyến cáo: Dự đoán trên chỉ mang tính chất tham khảo.
Ý tưởng giao dịch

Dự đoán ETH từ 06/06/25.⭐️⭐️⭐️⭐️⭐️ Dự đoán ETH từ 06/06/25.
👉 Buy limit: 2,250-2,300
👉SL: 2,220
👉TP: 2,500-2,600
⭐️ Khuyến cáo: Dự đoán trên chỉ mang tính chất tham khảo.

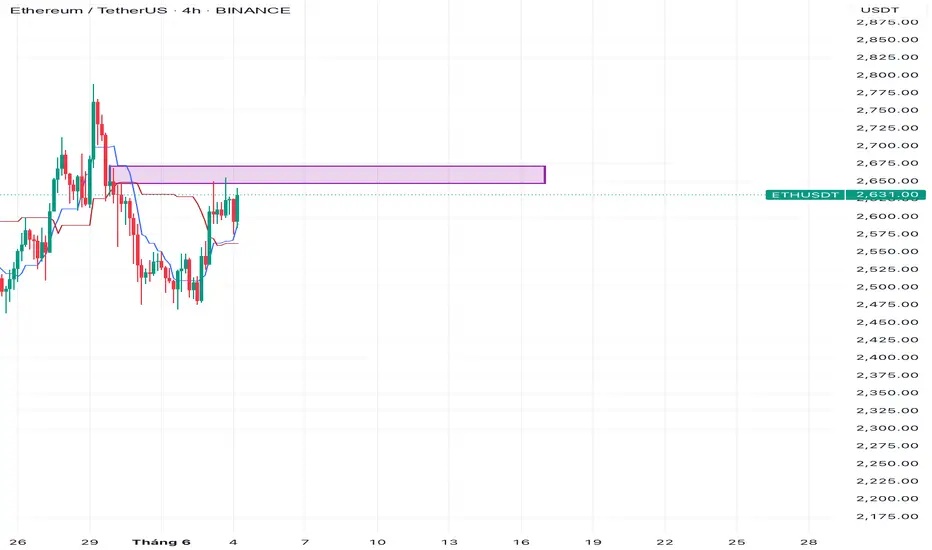
Dự đoán ETH từ 04/06/25.⭐️⭐️⭐️⭐️⭐️ Dự đoán ETH từ 04/06/25.
👉 Sell limit: 2,660-2,670
👉SL: 2,690
👉TP: 2,570-2,590
⭐️ Khuyến cáo: Dự đoán trên chỉ mang tính chất tham khảo.
Phân Tích ETH :Ethereum Bật Lên Từ Vực Thẳm! Cơ Hội Hay Cạm Bẫy?ETH đang có một pha phản ứng cực kỳ đáng chú ý tại vùng hỗ trợ mạnh nhất trong suốt 2 năm qua... Và tín hiệu mua đang dần hình thành! Liệu đây có phải là điểm vào lệnh lý tưởng?
1. Vị trí hiện tại của ETH trên biểu đồ khung tuần:
Trên khung thời gian 1 tuần, chúng ta có thể thấy ETH vừa chạm vùng hỗ trợ vàng cực mạnh, nằm trong khoảng 1.083 đến 1.444 USDT – vùng giá này đã từng nhiều lần giữ giá và tạo đáy vào năm 2022.
Giá chạm hỗ trợ → xuất hiện nến bật mạnh lên → lực mua xuất hiện rõ ràng!
Hiện tại ETH đang năm trên vùng hổ trợ 1.542 đến 1.679 usdt vùng hổ trợ khung tuần cũng khá mạnh.trên vùng supply zone 1 chút.
2. Cây nến tín hiệu cho thấy điều gì?
Cây nến tuần vừa qua có râu nến dưới rất dài và đóng cửa cao hơn vùng hỗ trợ → Điều này chứng tỏ bên mua đã vào cuộc quyết liệt để đẩy giá lên, không để ETH thủng đáy.
💥 Đây chính là mẫu hình nến Pin bar đảo chiều thường xuất hiện khi thị trường muốn quay đầu.
3. Khối lượng giao dịch tăng đột biến:
Quan sát kỹ biểu đồ, bạn sẽ thấy volume tuần này lớn hơn hẳn các tuần trước → Tức là dòng tiền thông minh đã bắt đầu vào cuộc.
📌 Đây là yếu tố xác nhận cho tín hiệu nến đảo chiều.
4. RSI bật lên từ vùng quá bán:
Chỉ báo RSI đã về vùng quá bán dưới mốc 30 – và đang hướng lên nhẹ.
📈 Dấu hiệu này thường đi trước một đợt hồi phục ngắn hạn hoặc thậm chí là đảo chiều xu hướng.
5. Vùng kháng cự sắp tới cần lưu ý:
Tuy ETH đang hồi lên, nhưng phía trên còn một rào cản rất lớn – đó là vùng kháng cự đỏ từ 1.935 đến 2.144 USDT.
⚠️ Nếu muốn bứt phá, ETH cần phá vỡ vùng này bằng volume lớn và nến xác nhận.
📌 Tóm lại – Chiến lược hành động:
✅ ETH đã phản ứng tốt tại vùng hỗ trợ mạnh → xuất hiện tín hiệu nến + volume xác nhận
✅ RSI bật từ quá bán → dấu hiệu hồi phục
🎯 Chiến lược:
Mua thăm dò quanh 1.520 – 1.600 USDT
Stoploss dưới 1.444
Target ngắn hạn: 1.935 – 2.144
Target dài hạn (nếu phá được kháng cự): 2.600+
Đây là thời điểm ETH đứng trước cơ hội bật dậy sau cú giảm sâu. Hãy quan sát kỹ vùng hỗ trợ – vì đây có thể là cơ hội vàng trong giai đoạn đầy biến động này!
Đừng quên like – follow – và chia sẻ nếu bạn thấy hữu ích!”😁😁😁

Share kèo fu coin vol cfe - daily - Long ETH, XRPShare kèo fu coin vol cfe - daily
Link tham gia nhóm telegram share kèo:
t.me/xuhufucoincafe
—————
Giao dịch vol cfe, tp 100%, sl 50%
Giao dịch tại sàn CoinSAVI vừa kiếm tiền cafe hàng ngày, vừa hoàn thành các mission đào đồng coin SAVI, chờ airdrop.
—————
Thông tin giới thiệu tại tài khoản:
- Remitano:
Referral code (mã giới thiệu): 8120316
Link giới thiệu: remitano.com
- Azasend:
Referral code (mã giới thiệu): 222312
Link giới thiệu: azasend.com
- CoinSAVI:
Referral code (mã giới thiệu): 50487699
Link giới thiệu: coinsavi.com

ETH 1h ngày 14/02/2025 - Mọi thứ không rõ ràng1. Tổng quan thị trường (Bias & Giai đoạn)
Hiện tại giá đang nằm trong một vùng sideway
Volume Profile cho thấy POC (Point of Control) nằm ở phía dưới của vùng giá hiện tại → Có thể đây là vùng tích lũy hơn là phân phối.
CVD và Delta đều đang có xu hướng tiêu cực, cho thấy áp lực bán vẫn đang chiếm ưu thế.
2. Kiểm tra Spring hoặc UTAD
Spring: Không có dấu hiệu rõ ràng
Chưa có cú rũ bỏ mạnh (Shakeout) với volume tăng vọt, điều này làm giảm xác suất đây là giai đoạn tái tích lũy với Spring.
Giá đang đi ngang với biên độ hẹp, volume duy trì ổn định, chưa thấy tín hiệu của Seller Climax hoặc Automatic Rally mạnh.
UTAD: Chưa rõ ràng
Giá chưa có dấu hiệu phá vỡ đỉnh kèm theo tăng volume để xác nhận đây là giai đoạn UTAD của phân phối.
3. Kịch bản giao dịch Wyckoff - Phải chờ đợi cho đúng tín hiệu kèm Volume lớn, nếu không thì đứng ngoài, không giao dịch
Kịch bản 1: Giá tiếp tục tích lũy, chờ Breakout
Nếu giá breakout lên trên vùng sideway (tầm 2,750 - 2,800 USDT) với volume lớn, xác nhận phe mua kiểm soát → Long theo xu hướng.
SL: Dưới vùng POC, khoảng 2,600 USDT.
TP: 2,950 - 3,000 USDT.
Kịch bản 2: Giá Breakdown, xác nhận phân phối
Nếu giá phá thủng vùng hỗ trợ (2,600 USDT) với volume lớn, xác nhận đây là tái phân phối → Short theo xu hướng.
SL: Trên vùng 2,750 USDT.
TP: 2,400 - 2,300 USDT.
4. Kết luận
Hiện tại chưa có tín hiệu rõ ràng của Spring hoặc UTAD, thị trường đang tích lũy.
Quan sát phản ứng giá quanh 2,600 và 2,800 USDT để quyết định chiến lược.
Nếu giá tiếp tục sideway mà không phá vỡ, có thể chờ thêm dấu hiệu từ Order Flow để xác định xu hướng tiếp theo.

ETHUSDT: Nỗ Lực Phục Hồi Sau Đợt Sụt Giảm
Chào các nhà giao dịch! Hôm nay chúng ta cùng phân tích $ETHUSDT. Giá hiện đang cố gắng phục hồi sau một đợt sụt giảm mạnh, hiện đang ở mức 3,345.52 USDT . Chúng tôi nhận thấy mức hỗ trợ quan trọng tại 3,308.46 USDT , đã chịu được áp lực, nhưng việc duy trì mức này là rất quan trọng.
---
🔑 Các Mức Quan Trọng:
Hỗ trợ:
3,308.46 USDT — vùng hỗ trợ chính mà người mua có thể giữ cho thị trường ổn định.
3,302.52 USDT — mức hỗ trợ bổ sung trong trường hợp áp lực gia tăng.
Kháng cự:
3,360.00 USDT — mục tiêu gần nhất để kiểm tra sức mạnh của phe mua.
3,400.00 USDT — vùng để chốt lời từng phần nếu đà tăng tiếp tục.
---
🚩 Chiến Lược Giao Dịch:
Điểm vào lệnh:
- Cân nhắc mở vị thế mua sau khi xác nhận mức hỗ trợ tại 3,308.46 USDT và quan sát động lực tăng giá.
Stop-Loss:
- Đặt lệnh dừng lỗ dưới mức 3,302.52 USDT để giảm thiểu rủi ro.
Mục tiêu chốt lời (Take-Profit):
3,360.00 USDT — điểm chốt lời đầu tiên.
3,400.00 USDT — mục tiêu cuối cùng cho đợt tăng giá này.
---
📈 Phân Tích Kỹ Thuật:
Đợt giảm mạnh về khối lượng cho thấy một nỗ lực thu hút thanh khoản.
Nếu phe mua giữ được mức 3,308.46 USDT , có khả năng phục hồi về mức kháng cự.
Quan trọng cần theo dõi khối lượng và phản ứng giá tại các mức chính.
---
💡 Kết Luận:
Ethereum rõ ràng đang cố gắng phục hồi sau một đợt giảm mạnh, nhưng người mua cần giữ vững mức hỗ trợ. Liệu thị trường có thể lấy lại vị thế đã mất không? Hãy chia sẻ ý kiến của bạn trong phần bình luận!

ALT20 INDEX - ADAMIndicator Description
The "ALT20 INDEX" is a financial analysis tool designed to track the aggregate value of the top 20 cryptocurrencies by market capitalization and closing prices over specific periods. This indicator reflects changes in the combined value of these 20 ALTCOINs, providing an overview of trends in the cryptocurrency market.
==================================
Purpose and Practical Applications
1. Tracking Top Cryptocurrencies:
- The indicator allows monitoring the value of the top 20 ALTCOINs, reflecting the general volatility of the cryptocurrency market.
- Helps investors focus on high-capitalization assets.
2. Performance Comparison:
- Serves as a tool to compare the performance of the ALT20 group against other assets like Bitcoin, Ethereum, or traditional financial indices.
3. Assessing Market Health:
- Enables evaluation of market trends, identifying growth or decline periods.
4. Practical Applications:
- Suitable for fund managers, long-term investors, or trend traders to make decisions based on the overall ALTCOIN market performance.
--------------------------------------------
How the Indicator Works
1. Selection of Top 20 ALTCOINs:
- Cryptocurrencies are selected based on their market capitalization at each rebalancing period.
2. Weight Allocation and Calculation:
- Weight: Determined by the market capitalization of each ALTCOIN relative to the total market capitalization of the top 20.
- Token Quantity: Calculated based on weight, total allocation points (e.g., 100 points for T1, 722.63 points for T2, etc.), and each ALTCOIN's closing price.
Formula: Token Quantity = Weight × Total Allocation Points/Closing Price
3. Periodic Rebalancing:
- Rebalancing frequency: Once a year.
- At each rebalancing period, the weights and token quantities are adjusted based on new market capitalization and prices.
4. Portfolio Value Calculation:
- The value of each ALTCOIN is calculated as:
Token Value = Closing Price × Token Quantity
- Index Total:
ALT20 Index ='20'∑'i=1' Token Value'i'
----------------------------------------------
Rebalancing Periods
T1 (2020-2021): Initial period, token quantities calculated based on weights and a total of 100 points.
T2 (2021-2022): Rebalanced with a total allocation of 722.63 points.
T3 (2022-2023): Total allocation of 252.26 points, reflecting portfolio adjustments based on new prices and market caps.
T4 (2023-2024): Total allocation of 261.43 points.
T5 (2024-Present): Total allocation of 437.42 points, updated to reflect the current market.
----------------------------------------------
Indicator Features
- Displays Index Value Over Time:
+ index_value_T1 to index_value_T5 represent the portfolio value during specific timeframes.
+ Values are calculated based on the daily closing prices of ALTCOINs.
- Visualization:
+ The index for each period is plotted on the chart, enabling easy observation of market trends over time.
---------------------------------------------
Practical Applications
- Portfolio Management:
The indicator helps track the performance of asset groups within the ALTCOIN portfolio.
- Integration into Trading Systems:
+ Used as a reference for automated or manual trading strategies.
- Market Analysis:
+ Assists analysts in evaluating cryptocurrency market movements based on the top 20 ALTCOINs.
Let me know if further optimization or additional information is needed!

ETH nên đợi thêm hay vào ngay?Dựa trên biểu đồ kỹ thuật hiện tại của ETH, có một số điểm nổi bật cần lưu ý:
1. Xu hướng MA (Moving Average): Các đường MA cho thấy sự phân kỳ với đường MA dài hạn (200 MA - đường xanh dày nhất) đang ở phía trên, trong khi các đường MA ngắn hơn đã cắt xuống phía dưới, cho thấy xu hướng giảm vẫn còn hiệu lực trong trung hạn.
2. Chỉ báo MACD: MACD đang có dấu hiệu tích cực khi các đường tín hiệu nằm gần mức 0, nhưng vẫn chưa có sự bứt phá mạnh mẽ nào để xác nhận xu hướng tăng trở lại. Nếu MACD vượt lên mức 0, điều này có thể là dấu hiệu cho thấy động lực tăng giá sắp quay trở lại.
3. ADX: Chỉ báo ADX hiện đang ở mức thấp, cho thấy xu hướng hiện tại không mạnh mẽ, thiếu động lực và có thể tiếp tục di chuyển trong biên độ hẹp. Điều này cũng có nghĩa là ETH có thể dao động trong khoảng đi ngang hoặc có thể chuẩn bị cho một xu hướng mới khi ADX bắt đầu tăng.
4. RSI (Relative Strength Index): RSI dao động quanh mức trung tính (50), chưa có dấu hiệu quá bán hoặc quá mua rõ ràng. Điều này cho thấy ETH đang trong trạng thái cân bằng về lực mua và bán, chưa có sự lệch rõ ràng về phía tăng hay giảm.
❇️ Kết luận
ETH đang trong giai đoạn tích lũy với áp lực bán vẫn hiện diện nhưng chưa đủ mạnh để đẩy giá xuống sâu. Nếu giá ETH có thể vượt qua các mức kháng cự gần (khoảng 2,800 USD), có thể sẽ có một đợt hồi phục ngắn hạn. Tuy nhiên, để xác nhận xu hướng tăng dài hạn, cần thấy các tín hiệu bứt phá rõ ràng hơn từ MACD và ADX.
💠 Khuyến nghị đầu tư: Nên chờ các tín hiệu xác nhận rõ ràng hơn trước khi vào lệnh. Nếu là nhà đầu tư dài hạn, có thể cân nhắc mua ở các vùng hỗ trợ mạnh, nhưng vẫn cần quản lý rủi ro cẩn thận.

Dự đoán ETH 08-13/10/24.⭐️⭐️⭐️⭐️⭐️Dự đoán ETH 08-13/10/24. Bán tại 2600. SL: 2700. TP: 2400.
⭐️Khuyến cáo: Chiến thuật trên chỉ mang tính tham khảo.

Dự đoán ETH 02-06/10/24.⭐️⭐️⭐️⭐️⭐️Dự đoán ETH 02-06/10/24. Mua tại 2200. SL: 2050. TP: 2500
⭐️Khuyến cáo: Chiến thuật trên chỉ mang tính tham khảo.

Dự đoán ETH 25-29/09/24.⭐️⭐️⭐️⭐️⭐️Dự đoán ETH 25-29/09/24. Bán tại 2770. SL: 2880. TP: 2570.
⭐️Khuyến cáo: Chiến thuật trên chỉ mang tính tham khảo.

Dự đoán ETH 16-22/09/24.⭐️⭐️⭐️⭐️⭐️Dự đoán ETH 16-22/09/24. Mua tại 2400. SL: 2300. TP: 2550.
⭐️Khuyến cáo: Chiến thuật trên chỉ mang tính tham khảo.

Dự đoán ETH 09-15/09/24.⭐️⭐️⭐️⭐️⭐️Dự đoán ETH 09-15/09/24. Mua tại 2050. SL: 1950. TP: 2350.
⭐️Khuyến cáo: Chiến thuật trên chỉ mang tính tham khảo.

Dự đoán ETH 02-08/09/24.⭐️⭐️⭐️⭐️⭐️Dự đoán ETH 02-08/09/24. Bán dưới 2350. SL: 2550. TP: 2000.
⭐️Khuyến cáo: Chiến thuật trên chỉ mang tính tham khảo.

Đánh giá biểu đồ hàng ngày ETHUSDTKhi xem xét biểu đồ hàng ngày của ETHUSDT; Có thể thấy rằng biến động giá tiếp tục với áp lực bán. Miễn là mức 2817 của tiền điện tử không thể vượt lên trên, người ta đánh giá rằng trong các biến động giá dưới mức 2550, nó có thể phá vỡ mức 2114 và thoái lui về mức 1817.

Dự đoán ETH 26/08-01/9/24.⭐️⭐️⭐️⭐️⭐️Dự đoán ETH 26/08-01/09/24. Mua trên 2850. SL: 2500. TP: 3200.
⭐️Khuyến cáo: Chiến thuật trên chỉ mang tính tham khảo.

Dự đoán ETH 19-25/08/24.⭐️⭐️⭐️⭐️⭐️Dự đoán ETH 19-25/08/24. Mua trên 2850. SL: 2500. TP: 3300.
⭐️Khuyến cáo: Chiến thuật trên chỉ mang tính tham khảo.

Dấu hiệu điều chỉnh sau pha quét thanh khoản tại 2750với nến H4 bán mạnh sau pha quét thanh khoản tại 2750 khả năng cao sẽ có pha điề chỉnh về đáy củ thậm chí thấp hơn.

Dự đoán ETH 13-18/08/24.⭐️⭐️⭐️⭐️⭐️Dự đoán ETH 13-18/08/24. Bán tại 2850. SL: 3100. TP: 2500.
⭐️Khuyến cáo: Chiến thuật trên chỉ mang tính tham khảo.

Dự đoán ETH 06-11/08/24. ⭐️⭐️⭐️⭐️⭐️Dự đoán ETH 06-11/08/24. Bán tại 2650. SL: 2800. TP: 2290.
⭐️Khuyến cáo: Chiến thuật trên chỉ mang tính tham khảo.

Mô hình đang vào nhịp cuối để hoà thiệnETH đang hình thành mô hình cờ khá rỏ, còn 1 giai đoạn phân phối và nhiều khả năng phá lên trong thời gian ngắn tới đây.

Bitcoin báo hiệu nhịp hồi ngắn hạn gần HT cứng W050824#BITCOIN BÁO HIỆU NHỊP HỒI NGẮN HẠN GẦN HỖ TRỢ CỨNG W050824
Thị trường tuần rồi tiếp tục chứng kiến 1 tuần giảm mạnh hơn 9% từ KC gần 70,000 về vùng HT mạnh 60,000.
Các trạng thái short quanh mốc 68k - 69k có thể tạm chốt lời quanh vùng này.
View trung hạn của tôi thì bitcoin có thể về 53k trong 3-4 tuần tới.
Tuy nhiên, hiện tại tôi k mở short mới quanh 61k - 62k này nữa vì thị trường tôi dự đoán tuần sau sẽ có nhịp hồi nhẹ.
**********************************************************************
Các bạn có thể cân nhắc tín hiệu sau cho Bitcoin:
📩 #BTCUSDT H1 | Mid-Term
📉 Long Entry Zone: 61,300 - 61,800
- ⏳ - Signal details:
Target 1: 62,684
Target 2: 63,142
Target 3: 63,655
Target 4: 64,078
_
🧲Strong-Support: 60,000
❌Stop-Loss: 60,000
💡After reaching the first target you can put the rest of the position to breakeven
By TIK Ventures ©️ ⚡️
