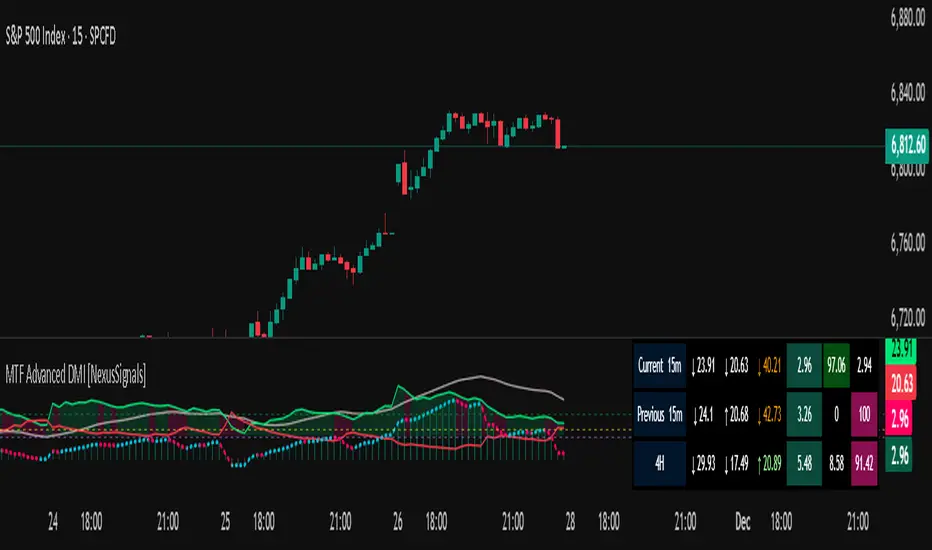
MTF Advanced DMI [NexusSignals]

Key features include:
- Multi-Timeframe Analysis: Displays DMI/ADX data for the current chart timeframe, plus two user-defined higher timeframes (e.g., 4H and 1D).
- A trend strength metric that quantifies bullish/bearish dominance on each timeframe.
- A dynamic table summarizing real-time MTF values, with color-coded signals, arrows, and buy/sell pressure percentages.
- Visual fills and arrows for intuitive trend reading.
- Built-in alerts for key events, including MTF-specific conditions (note: higher TF alerts may repaint due to live candle calculations via request.security).
How It Works
The indicator calculates DMI/ADX on three timeframes: the current chart TF, a mid-higher TF (default: 4H), and a highest TF (default: 1D).
For each:
- +DI (Plus Directional Indicator): Upward movement strength.
- -DI (Minus Directional Indicator): Downward movement strength.
- ADX: Overall trend strength.
- Trend Strength: ((+DI - -DI) / (+DI + -DI)) * ADX – positive for bullish, negative for bearish.
- Buy/Sell %: Percentage of buyer/seller control in the candle based on HLC.
Plots focus on the current TF:
- Strength Histogram: Color-coded (green bullish, red bearish).
- ADX Line: White, with direction arrows.
- +DI/-DI Lines: Green/red, with fills above 15 for strong trends.
- Horizontal lines at 15 (consolidation) and 25 (strong trend).
The table (optional) shows data for the current timeframe candle, previous current timeframe candle, and the two higher TFs (if different from current), enabling quick cross-TF comparisons.
Inputs
General Settings:
- DMI Length (default: 14): Period for +DI/-DI.
- ADX Smoothing (default: 14): ADX period.
- ADX Consolidation Threshold (default: 15): Low ADX suggests sideways.
- ADX Stronger Trend Threshold (default: 25): High ADX indicates strong trends.
- Higher Timeframe (default: 240/4H): Mid-level TF for MTF analysis.
- Highest Timeframe (default: 1D): Top-level TF for broader context.
- Threshold for Strong Bullish/Bearish DMI Strength (defaults: 10 / -10): For strength alerts.
Table Settings:
- Show Table? (default: true): Toggle table visibility
- Table Text Color, Header Color, Text Size (default: small)
- Position (default: middle_right): Customize for your chart
Interpretation
- Bullish Alignment: +DI > -DI across TFs, rising +DI (↑), Strength > 0 (green), Buy% > Sell%. Stronger if ADX > 25 on higher TFs.
- Bearish Alignment: -DI > +DI, rising -DI (↑), Strength < 0 (red), Sell% > Buy%. Confirm with rising ADX on MTF.
- Consolidation: +DI/-DI < 20 and ADX ≤ 15 (blue fill). Check if higher TFs show the same for range-bound confirmation.
- Crossovers: +DI above -DI for bullish; reverse for bearish. MTF agreement reduces false signals.
- Fills: Highlight dominant trends above 15 (green bullish, maroon bearish).
- MTF Insight: Use the table to spot divergences (e.g., bullish current TF but bearish on daily) for potential reversals.
Combine with support/resistance or other momentum oscillators like macd, rsi, stochastic for robust strategies. Test on various assets and TFs to find the best settings that suit your trading style.
Alerts
Includes 20 alert conditions, with MTF extensions (higher TF alerts may repaint – use with caution for live trading):
- Strength crossing 0 or bullish/bearish thresholds (on current and higher TFs).
- +DI/-DI crossovers (bullish/bearish) on current TF.
- ADX above strong threshold.
- +DI/-DI above 25 or below 15.
- Consolidation detection.
- MTF-specific: Strength changes on higher TFs (e.g., "Strength Above Bullish Threshold on TF1").
- Configure in TradingView by selecting from the alert dropdown.
Usage Tips
- Select higher TFs that suit your strategy (e.g., 1H chart with 4H and Daily for day trading).
- Use the table for at-a-glance MTF alignment without switching charts.
- Customize appearance to avoid clutter on busy setups.
- Backtest thoroughly, especially noting potential repainting on higher TFs.
- Changed default Strength style from columns to histogram
- Added a SMA on Strength plot with length 1 to improve visibility, users can see now all the fast trend changes
Tập lệnh chỉ hiển thị cho người được mời
Chỉ những người dùng được tác giả chấp thuận mới có thể truy cập tập lệnh này. Bạn sẽ cần yêu cầu và được cấp quyền sử dụng. Thông thường quyền này được cấp sau khi thanh toán. Để biết thêm chi tiết, làm theo hướng dẫn của tác giả bên dưới hoặc liên hệ trực tiếp với NexusSignals.
TradingView KHÔNG khuyến nghị bạn trả phí hoặc sử dụng một tập lệnh trừ khi bạn hoàn toàn tin tưởng vào tác giả và hiểu cách hoạt động của tập lệnh. Bạn cũng có thể tìm các lựa chọn miễn phí, mã nguồn mở trong các script cộng đồng của chúng tôi.
Hướng dẫn của tác giả
Thông báo miễn trừ trách nhiệm
Tập lệnh chỉ hiển thị cho người được mời
Chỉ những người dùng được tác giả chấp thuận mới có thể truy cập tập lệnh này. Bạn sẽ cần yêu cầu và được cấp quyền sử dụng. Thông thường quyền này được cấp sau khi thanh toán. Để biết thêm chi tiết, làm theo hướng dẫn của tác giả bên dưới hoặc liên hệ trực tiếp với NexusSignals.
TradingView KHÔNG khuyến nghị bạn trả phí hoặc sử dụng một tập lệnh trừ khi bạn hoàn toàn tin tưởng vào tác giả và hiểu cách hoạt động của tập lệnh. Bạn cũng có thể tìm các lựa chọn miễn phí, mã nguồn mở trong các script cộng đồng của chúng tôi.