PROTECTED SOURCE SCRIPT
TradiKator 09 HH HL LH LL & Linear Regression
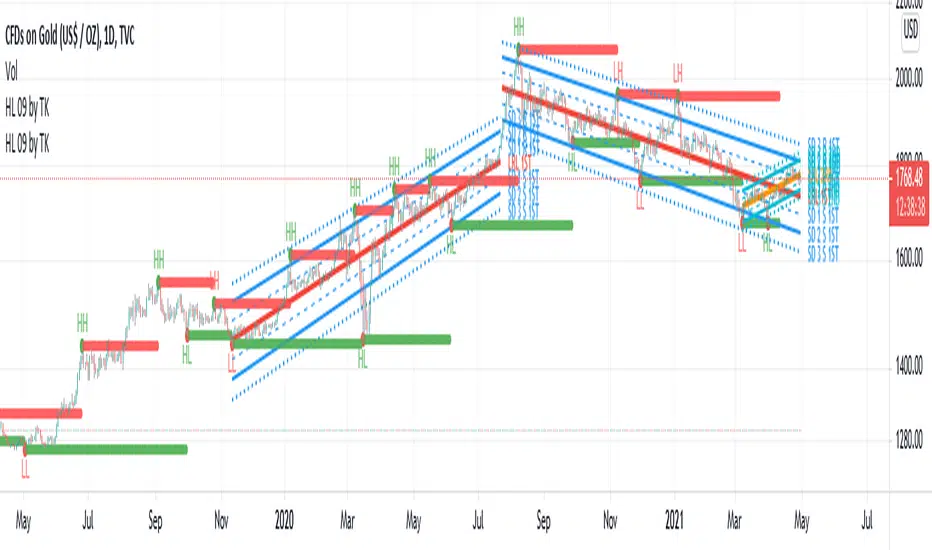
TradiKator 09 HH HL LH LL & Linear Regression indicates whether current price movement exceed the trend or not.
Here, we use Higher High,Higher low, Lower High, Lower Low to identify a possible change of trend.
Also we use 2 Linear Regression Channels (short term & long term) to identify a price trend.
I hope this indicator can help traders to estimate trend change in the essential trading behavior.
1)Higher High,Higher low, Lower High, Lower Low
Higher High and Higher Low indicates a Bull trend
Lower High and Lower Low indicates a Bear trend
Those high low pivot points is a verg good mark to judge if current trend keeps going on or not.
Setting :
Left pivot length
Right pivot length
The longer pivot length is , the less sensetive and more delay you signal will be, especially the right privot
2)Linear Regression Channels
Linear Regression Line – is a line drawn according to the least-squares statistical method which produces a best fit line
The resulting can be used to predict price trend from the same system.
Setting :
Count ---> the length of the Linear Regression, remember more data in interest = less accuracy and bigger sigma
The End bar of Linear Regression ---> If you don't want latest K bar in the Linear Regression interest (they are not in the same trend), then you can move the Linear Regression to earlier bar
This indicator is inspired by GDT who is a great coder.
Known issue:
Not yet.
Mã được bảo vệ
Tập lệnh này được đăng dưới dạng mã nguồn đóng. Tuy nhiên, bạn có thể sử dụng tự do và không giới hạn – tìm hiểu thêm tại đây.
Thông báo miễn trừ trách nhiệm
Thông tin và các ấn phẩm này không nhằm mục đích, và không cấu thành, lời khuyên hoặc khuyến nghị về tài chính, đầu tư, giao dịch hay các loại khác do TradingView cung cấp hoặc xác nhận. Đọc thêm tại Điều khoản Sử dụng.