PROTECTED SOURCE SCRIPT
Standard Deviation Lines v1.0

Overview
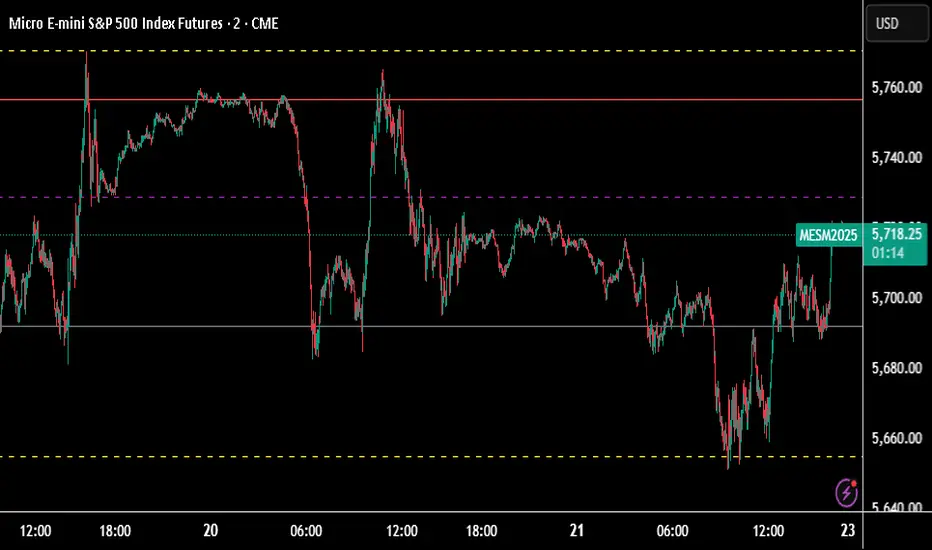
The Standard Deviation Lines v1.0 indicator is designed to provide a statistical approach to market volatility by plotting multiple standard deviation levels based on price action. This tool helps traders identify key price levels where the market may experience significant reactions, making it useful for trend analysis, support/resistance identification, and volatility-based trading strategies.
Key Features
✅ Dynamic Standard Deviation Levels: Calculates and plots up to ±3 standard deviation levels, giving traders a clear view of price dispersion and potential overbought/oversold areas.
✅ Quadrant-Based Deviation Zones: Divides standard deviation ranges into smaller, meaningful levels (e.g., 0.214, 0.382, 0.50, 0.618, 0.786) for a granular analysis of price movements.
✅ VIX Integration for Volatility Adjustment: Incorporates CBOE:VIX to dynamically adjust standard deviation levels based on market volatility.
✅ Weekly vs. Daily Mode: Users can toggle between weekly and daily standard deviation calculations to adapt to different trading strategies.
✅ Auto-Updating Levels: The indicator refreshes at market close (17:00), ensuring traders work with the latest price data.
✅ Customizable Display: Uses color-coded lines to differentiate between positive and negative deviations, with dashed lines for mid-levels and key support/resistance areas.
How to Use
📌 Trend & Volatility Analysis – Higher standard deviation levels indicate strong price movements, helping traders assess trend strength and market volatility.
📌 Reversal & Continuation Signals – Prices reaching extreme standard deviation levels (±2 or ±3) may suggest potential reversals or breakouts.
📌 Support & Resistance Zones – The quadrant-based deviation zones help identify hidden support/resistance areas where price may react.
📌 Risk Management – Traders can use standard deviation bands to set stop-loss and take-profit levels based on statistical price dispersion.
Best For
🔹 Day traders & swing traders looking to incorporate volatility-based strategies.
🔹 Mean reversion traders who capitalize on price returning to statistical averages.
🔹 Momentum traders who want to confirm trend strength and continuation.
Try the Standard Deviation Lines v1.0 now and enhance your market analysis with a statistical edge!
Mã được bảo vệ
Tập lệnh này được đăng dưới dạng mã nguồn đóng. Tuy nhiên, bạn có thể sử dụng tự do và không giới hạn – tìm hiểu thêm tại đây.
Thông báo miễn trừ trách nhiệm
Thông tin và các ấn phẩm này không nhằm mục đích, và không cấu thành, lời khuyên hoặc khuyến nghị về tài chính, đầu tư, giao dịch hay các loại khác do TradingView cung cấp hoặc xác nhận. Đọc thêm tại Điều khoản Sử dụng.