PROTECTED SOURCE SCRIPT
Realtime Order Bubbles — cryptomonk
Description:
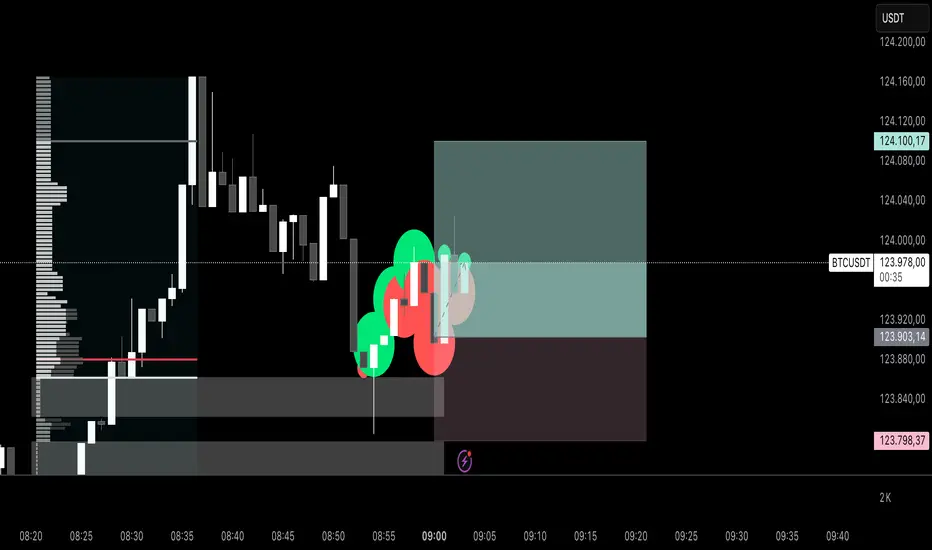
Displays real-time bubbles on the chart to visualize buy and sell activity within each candle.
• Green bubbles → Volume increase on upticks (buy pressure)
• Red bubbles → Volume increase on downticks (sell pressure)
• Bubble size → Strength of the volume change
How it works:
The indicator compares live tick updates (or bar closes) against previous volume and price values to detect whether a move was initiated by buyers or sellers, then plots bubbles in real-time accordingly.
Best used for:
• Scalping / Intraday analysis on lower timeframes (1–5 min)
• Detecting volume spikes, momentum shifts, and aggressive order flow
• Works best when chart is set to “Go Live” for tick-level updates
Use case:
A lightweight visual tool for identifying short-term order flow and understanding market pressure without needing full footprint data.
Mã được bảo vệ
Tập lệnh này được đăng dưới dạng mã nguồn đóng. Tuy nhiên, bạn có thể sử dụng tự do và không giới hạn – tìm hiểu thêm tại đây.
Thông báo miễn trừ trách nhiệm
Thông tin và các ấn phẩm này không nhằm mục đích, và không cấu thành, lời khuyên hoặc khuyến nghị về tài chính, đầu tư, giao dịch hay các loại khác do TradingView cung cấp hoặc xác nhận. Đọc thêm tại Điều khoản Sử dụng.