PROTECTED SOURCE SCRIPT
Volatility Heat-Map, momentum ribbon and divergence detector
✅ Summary:
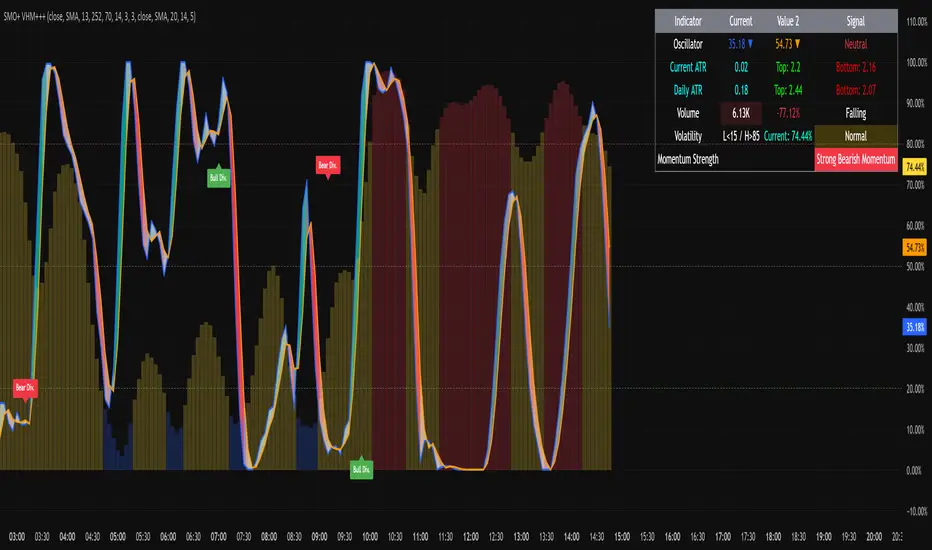
This is a comprehensive volatility + momentum + volume + ATR dashboard with table visualization, momentum ribbon, and divergence detection. It’s optimized for visual clarity with dynamic coloring and is suitable for both trend-following and mean-reversion traders.
Table shows:
Oscillator values with arrows and K/D status.
Current & Daily ATR with tops/bottoms.
Volume & % change, rising/falling indicator.
Volatility regime (Low/Normal/High) with color coding.
Momentum strength (strong/weak bullish/bearish).
Oscillator
stoch = hh != ll ? 100 * (src - ll) / (hh - ll) : 0
k = smooth(stoch, kSmoothing)
d = smooth(k, dSmoothing)
Standard stochastic normalization.
Smoothing based on selected type (SMA/EMA/WMA).
diff between K and D is normalized for the momentum ribbon color:
Greenish for bullish, red for bearish, silver for neutral.
Overbought / Oversold lines: 80/20, midline at 50.
4. BBWP Calculation
bbwp = f_bbwp(i_priceSrc, i_bbwpLen, i_bbwpLkbk, i_basisType)
bbwpSMA5 = f_maType(bbwp, 5, "SMA")
Heatmap Thresholds:
Low < 15%
High > 85%
Otherwise Normal.
Colors dynamically assigned for histogram and table background.
Plotted as columns if table
Bullish and Bearish divergence labels plotted, both regular and hidden.
Mã được bảo vệ
Tập lệnh này được đăng dưới dạng mã nguồn đóng. Tuy nhiên, bạn có thể tự do sử dụng tập lệnh mà không có bất kỳ hạn chế nào – tìm hiểu thêm tại đây.
Want to join a safe community full of like-minded individuals that work together, not against each other? Join Xtrader! Link for more amazing indicators and support.
discord.gg/NHjztdYv6U
discord.gg/NHjztdYv6U
Thông báo miễn trừ trách nhiệm
Thông tin và ấn phẩm không có nghĩa là và không cấu thành, tài chính, đầu tư, kinh doanh, hoặc các loại lời khuyên hoặc khuyến nghị khác được cung cấp hoặc xác nhận bởi TradingView. Đọc thêm trong Điều khoản sử dụng.