PROTECTED SOURCE SCRIPT
Cập nhật MTF Stochastic Dashboard
What you see:
Settings
Signal mode:
Quick presets
Settings
Signal mode:
Quick presets
Phát hành các Ghi chú
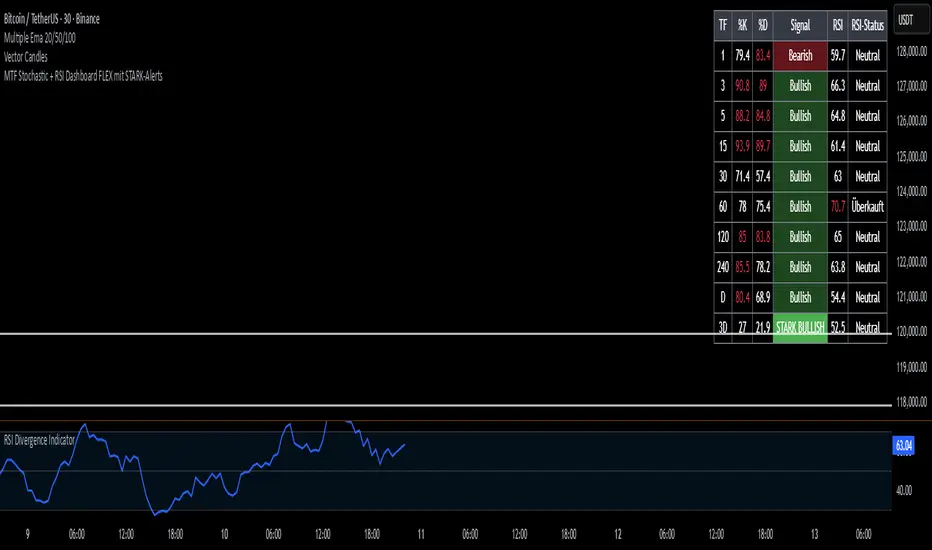
This Pine Script v6 creates a multi-timeframe dashboard that shows Stochastic (%K, %D) and RSI values across 1m–3D.Cells turn red/green when overbought/oversold.
A signal column shows Bullish / Bearish conditions based on gap/cross logic.
An extra column displays the RSI status (Overbought / Oversold / Neutral).
Would you like me to also rename headers and labels to English inside the code so the table matches this description?
Phát hành các Ghi chú
This Pine Script is a Multi-Timeframe Stochastic + RSI Dashboard with fully customizable alerts.It shows %K, %D, RSI values, and signal status for multiple timeframes in a table.
Signals are classified as Bullish / Bearish and Strong Bullish / Strong Bearish based on adjustable thresholds.
Colors for signals can be customized in the Style tab.
You can choose which timeframes to display and which ones should trigger alerts.
Alerts only fire on Strong signals, with optional RSI confirmation.
Mã được bảo vệ
Tập lệnh này được đăng dưới dạng mã nguồn đóng. Tuy nhiên, bạn có thể sử dụng tự do và không giới hạn – tìm hiểu thêm tại đây.
Thông báo miễn trừ trách nhiệm
Thông tin và các ấn phẩm này không nhằm mục đích, và không cấu thành, lời khuyên hoặc khuyến nghị về tài chính, đầu tư, giao dịch hay các loại khác do TradingView cung cấp hoặc xác nhận. Đọc thêm tại Điều khoản Sử dụng.