PROTECTED SOURCE SCRIPT
Cập nhật Cumulative volume analysis
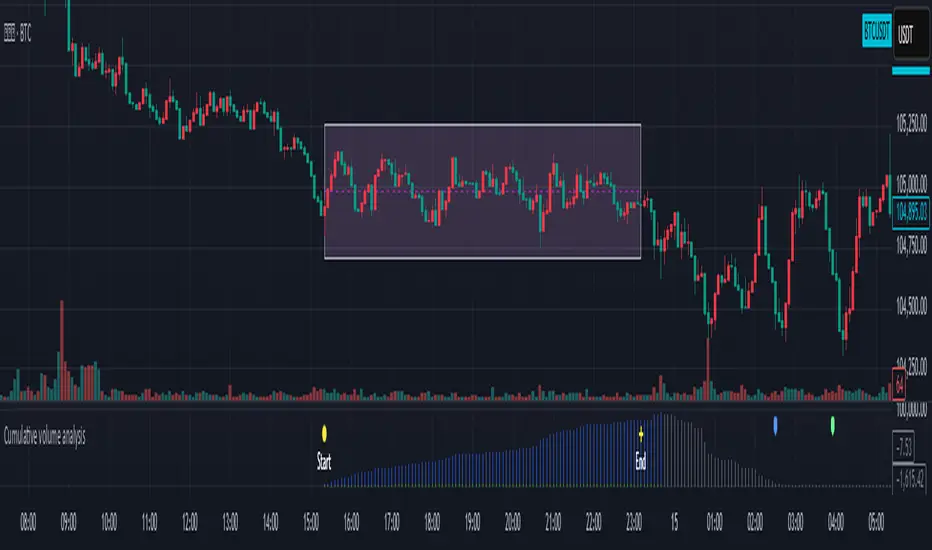
After user define the ragion area. While break out the region area, you can try this indicator to notice when the power is ended and maybe reverse the trend.
1. The user enters the start time, and end time
2. The indicator will record the highest, lowest price, and cumulative amount during this period.
The cumulative amount is calculated by adding up the amount of each K bar, regardless of whether it rises or falls.
3. When the cumulative amount is reduced to less than or equal to 0, make a plotshape arrow
4.There are two diferent method to record the volume. Try the better way to different product.
Phát hành các Ghi chú
Added more explanation below:This indicator is suitable for short-term use. I prefer the range of 5 minutes K to 1 hour K.
The chart uses 5 points K as an example.
I think this concept is my own idea, and there is no plagiarism.
If you like it, like it or share it
Phát hành các Ghi chú
Change some description into English version.Mã được bảo vệ
Tập lệnh này được đăng dưới dạng mã nguồn đóng. Tuy nhiên, bạn có thể sử dụng tự do và không giới hạn – tìm hiểu thêm tại đây.
Thông báo miễn trừ trách nhiệm
Thông tin và các ấn phẩm này không nhằm mục đích, và không cấu thành, lời khuyên hoặc khuyến nghị về tài chính, đầu tư, giao dịch hay các loại khác do TradingView cung cấp hoặc xác nhận. Đọc thêm tại Điều khoản Sử dụng.
Mã được bảo vệ
Tập lệnh này được đăng dưới dạng mã nguồn đóng. Tuy nhiên, bạn có thể sử dụng tự do và không giới hạn – tìm hiểu thêm tại đây.
Thông báo miễn trừ trách nhiệm
Thông tin và các ấn phẩm này không nhằm mục đích, và không cấu thành, lời khuyên hoặc khuyến nghị về tài chính, đầu tư, giao dịch hay các loại khác do TradingView cung cấp hoặc xác nhận. Đọc thêm tại Điều khoản Sử dụng.