OPEN-SOURCE SCRIPT
Cập nhật NYSE New Highs vs New Lows
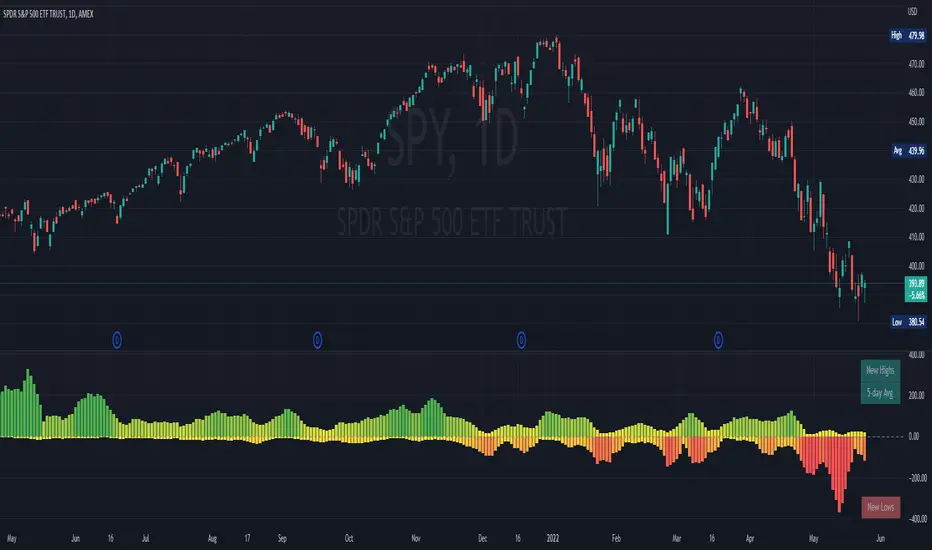
NYSE New Highs vs New Lows is a simple market breadth indicator that compares HIGN, the number of new highs during that day, and LOWN, the number of new lows. The new highs are on top and lows are appropriately on bottom. Without averaging, it's a little chaotic so you can smooth them out as much as you want, and the top-right label shows how much you're smoothing.
Interpretation:
Essentially, we use SPY or
  QQQ as a proxy for what's going on in the market, but because the FAANG stocks are so heavily weighted, it's not always representative. If SPY is flat/down, but there are 200 new highs today, then one of the big boys is weighing down an otherwise very bullish market. It's like looking at one of those heatmap charts, but in a single number.
Bullish Trend
- Lots of new highs
- Very few new lows
Bearish Trend
- Lots of new lows
- Very few new highs
Potential Reversal
- Too high, 250+
- Too low, 150+
Interpretation:
Essentially, we use
Bullish Trend
- Lots of new highs
- Very few new lows
Bearish Trend
- Lots of new lows
- Very few new highs
Potential Reversal
- Too high, 250+
- Too low, 150+
Phát hành các Ghi chú
Added option for cumulative count. Adjusted line/column colors. Label always said "day" even when it was on weekly so had to figure that out. Mã nguồn mở
Theo đúng tinh thần TradingView, người tạo ra tập lệnh này đã biến tập lệnh thành mã nguồn mở để các nhà giao dịch có thể xem xét và xác minh công năng. Xin dành lời khen tặng cho tác giả! Mặc dù bạn có thể sử dụng miễn phí, nhưng lưu ý nếu đăng lại mã, bạn phải tuân theo Quy tắc nội bộ của chúng tôi.
Thông báo miễn trừ trách nhiệm
Thông tin và ấn phẩm không có nghĩa là và không cấu thành, tài chính, đầu tư, kinh doanh, hoặc các loại lời khuyên hoặc khuyến nghị khác được cung cấp hoặc xác nhận bởi TradingView. Đọc thêm trong Điều khoản sử dụng.
Mã nguồn mở
Theo đúng tinh thần TradingView, người tạo ra tập lệnh này đã biến tập lệnh thành mã nguồn mở để các nhà giao dịch có thể xem xét và xác minh công năng. Xin dành lời khen tặng cho tác giả! Mặc dù bạn có thể sử dụng miễn phí, nhưng lưu ý nếu đăng lại mã, bạn phải tuân theo Quy tắc nội bộ của chúng tôi.
Thông báo miễn trừ trách nhiệm
Thông tin và ấn phẩm không có nghĩa là và không cấu thành, tài chính, đầu tư, kinh doanh, hoặc các loại lời khuyên hoặc khuyến nghị khác được cung cấp hoặc xác nhận bởi TradingView. Đọc thêm trong Điều khoản sử dụng.