MidWeekPlotMid week high and low Plotting , usefull for finding a mid range or Expiry range detail of High and low
[i]price

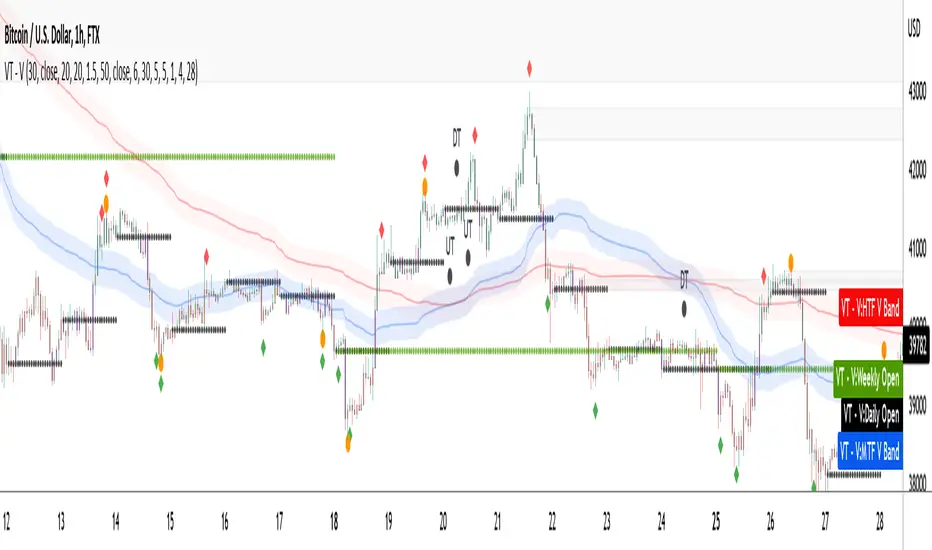
VTrend - Volume ScriptThe Volume script is designed to help you trade the market more efficiently, giving you a lot of information to intrepret, based on volume calculations.
The fundamental part of the script, is the volume weighted bands in blue and red, which help determine the trend and dynamic support and resistance. The blue band is a shorter length than the red band.
When the blue band dips below the red band, this tells us there is a downtrend. And when the blue band is trending above the red band, this is bullish uptrend price action. You will be able to note price whatever the timeframe really respects these bands, and you can use that to your advantage flicking through the high timeframes on where price will go next, combined with your own support and resistance levels.
The other most important aspects are the bar colors and the colored bollinger band line. Whenever price action is above the blue band the bars are green, when closing within the blue band, they are orange to show possible resistance or support. Below the blue band the bars are red for downtrend price action.
When the bars are bouncing off the daily open, a key level for you to play off everyday and makes it easier to gauge what price is doing, the bars are colored purple to highlight this.
The bollinger band line serves to act as a trendline, to help identify where price is going combined with the information above in the short term, and allows you to pick entry points more finely. There are also two bollinger band clouds in the background, which are areas to look at reversal or support for. You can turn these off if you wish, as not to clog up the chart.
Next feature up, are the reversal signals, which also double as areas to take profit. The default are the diamond reversal plots.
Enabled by default also are the custom leledc exhaustion plots, the major signals are enabled by default, whilst the minor signals are not turned on and are very noisy by comparison, especially at low timeframes.
You'll notice in the screenshot below, there is a black MA, that is an adjustable Hull Moving Average included for determining shorter term trend movements combined with the bollinger band colored line, depending on your trading style.
The image below shows when both major and minor leledc signals are turned on.
Also we have circular colored plots showing different reversal calculations, you can use them as a guide and take profit areas. These are based on candle type, and i consider them noisy especially at low time frames.
The indicator is designed to give you key information, but be quite customisable as well to suit your exact trading style.
Recommended timeframes i use this on; Weekly (for key liquidity areas), Trading on the Daily, 6h, 4h, 2h, 1h, and 25 minutes.
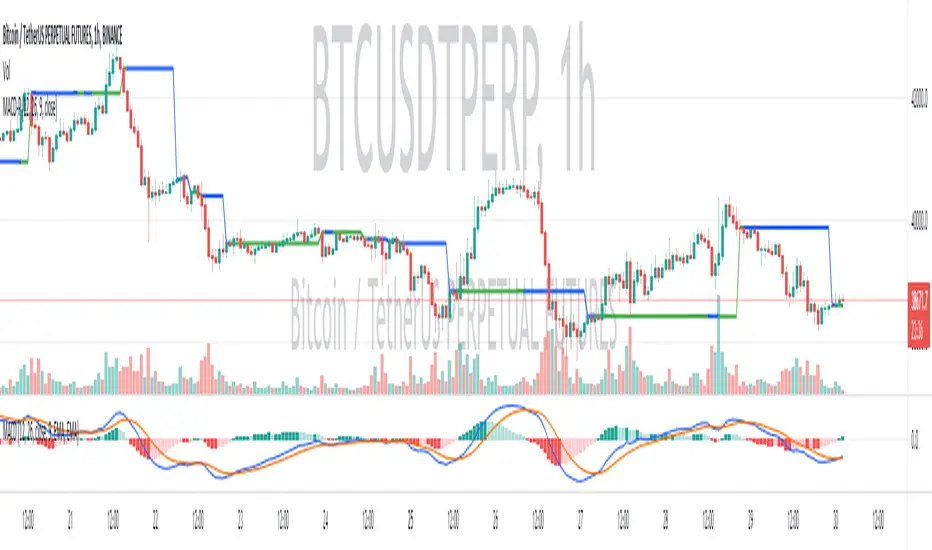
(MACD-Price) Displaying MACD Indicators on Price Chartshello?
Although it is a simple indicator, I decided to disclose it because I thought it was a pretty useful (?) indicator.
** Others may have previously published indicators similar to this indicator.
** Please understand this.
** All charts or indicators disclosed are not guaranteed to result in profit or loss.
** Therefore, please use it as a reference for your own trading strategy.
(design purpose)
The MACD indicator is a secondary indicator and is located below the price chart.
Accordingly, it is not easy to check along with the price flow.
Therefore, the index has been reorganized to display important factors in interpreting the MACD index according to the price change.
(Metric Description)
- The center line of the EMA line corresponding to the MACD value and the signal value displayed in the MACD indicator is designed to receive the Close value or Open value among prices according to changes in the rise and fall.
- The color of the line displayed in the manner described above is designed to change color when the Histogram passes the zero point, so that you can check whether the current state is in an uptrend or a downtrend.
Uptrend: green
Downtrend: blue
(How to Interpret and Apply)
- Buy when the 'Buy / Sell line' of the MACD-P indicator is level and the color is green, and when it crosses the 'Buy / Sell line' upwards.
- Sell when the 'Buy / Sell line' of the MACD-P indicator is level and the color is blue, and when it crosses below the 'Buy / Sell line'.
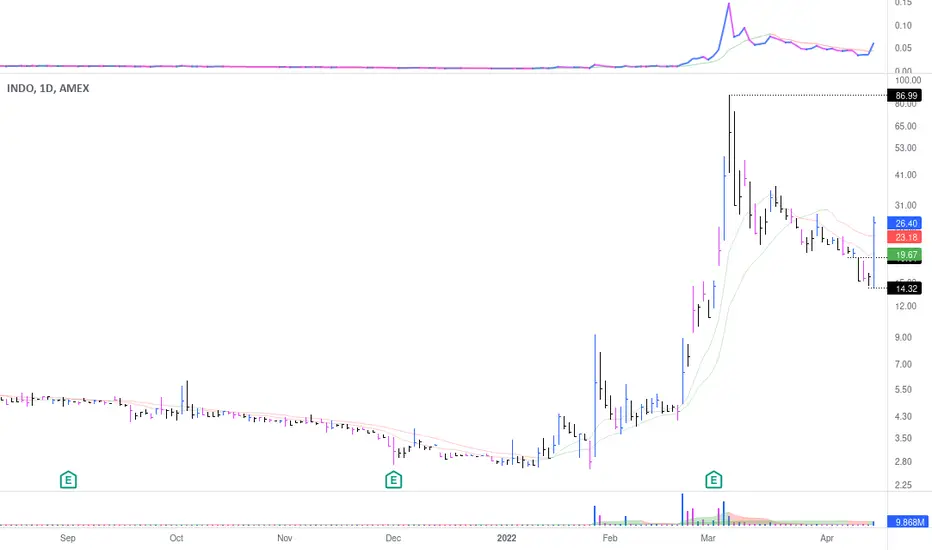
% Price change (by OP)To visually evaluate the percentage change in price over any time period
This handsome indicator shows exact % price change at each candle by displaying a circle at the level of the change. To read numerical value, point at the circle of the relevant bar corresponding to the candle you are interested in, and look at the scale.

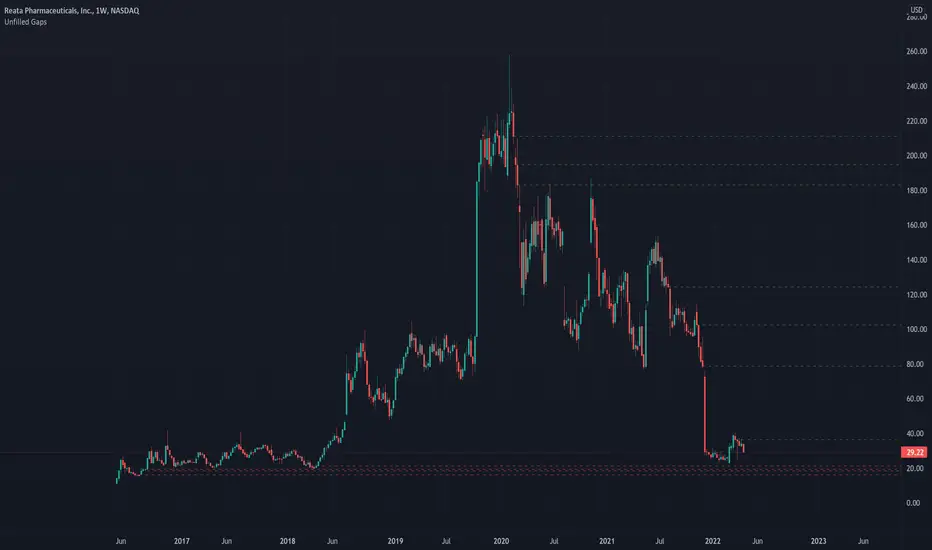
Unfilled GapsThis indicator displays gaps which have not been filled.
Notes:
- It shows only the unfilled gaps.
- You can edit the style and color of the gap lines.
- It will not work on charts with huge number of candles or gaps.
- It's based on someone else script which is mentioned in the code comments.
Capeya Bar ColorColor bars based on price and volume.
Volume can be set dollar denominated.
Change can be set close to close.
Volume can meet a threshold.
Color is bullish if the change is positive & bar's volume is greater than previous bar's volume.
Color is bearish if the change is negative & bar's volume is greater than previous bar's volume.
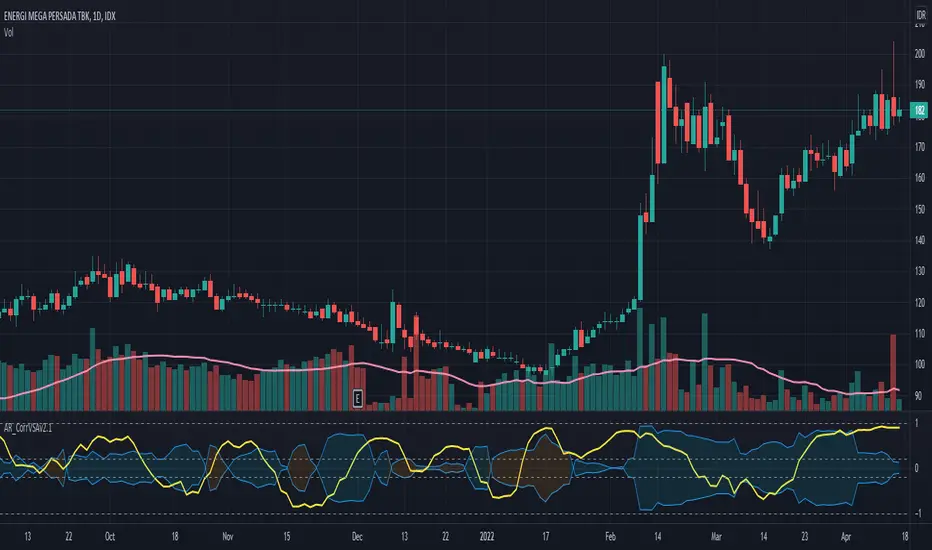
Correlation of Price Spread and VolumeCorrelation between candle's price spread (length of candle of each bar) and volume.
Generally, increases in volume precede significant price movements. However, If the price is rising in an uptrend but the volume is reducing, it may show that there’s little interest in the instrument, and the price may reverse.
The closer the correlation is to 1.0, indicates the instruments will move up and down together as it is expected with volume and price spread. So the correlation Indicator aims to display when the price spread and volume is in correlation and not. Blue color represent positive correlation while orange negative correlation. The strength of the correlation is determined by the width of the bands.
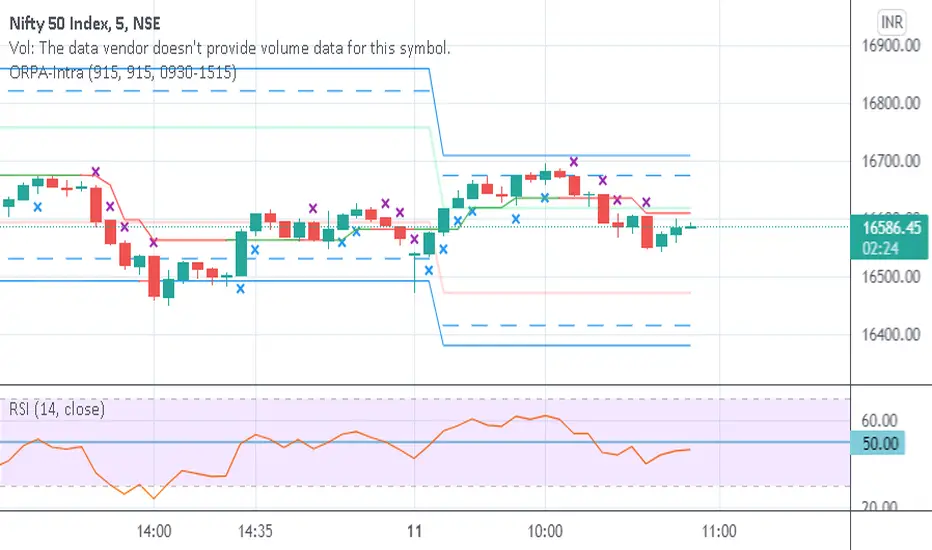
Opening Range-Price Action IntradayThis combines Opening Range of 15 min and Price Action in one script. Crosses are marked on candles for upside and downside. Break of High/Low of cross marked candles gives direction of market.
Heatmap WatchlistThis is a Heatmap for custom watchlist tickers. Similar to S&P500 Heatmap .
Add up to 20 tickers.
Check higher timeframe from a lower timeframe.
Check previous candle for any timeframe.
Switch on/off "Price%" and/or "Volume%" heatmap.

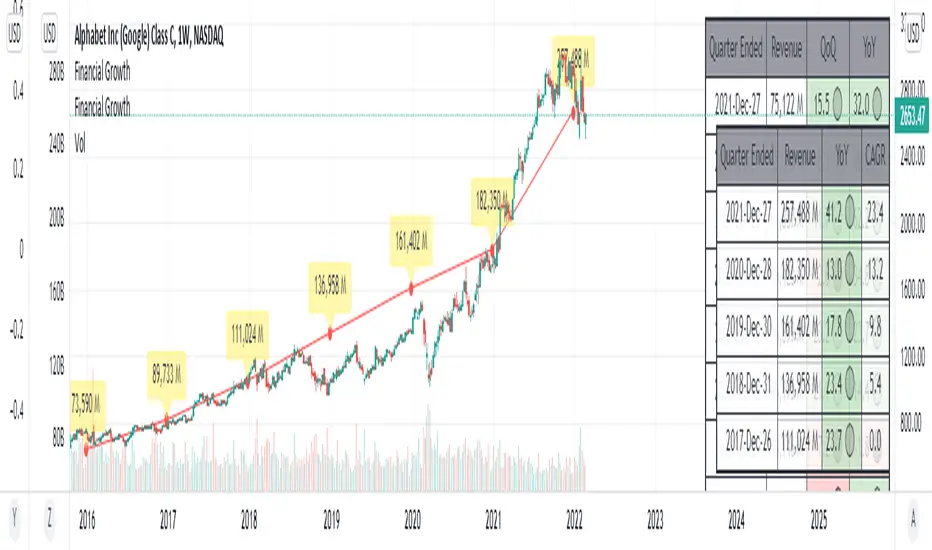
Financial GrowthThis indicator will acquire the financial data provided by Tradview.
the data is compare between Quarter, Annual and TTM in term of percent of growth.
YoY, QoQ and CAGR is also available by this script (The minimum is 4).
in addition, ploting of data, label and table also available (you can check the mark to toggle on / off).
Data : Revenue, Net Income, EBITDA, EPS, DVPS, Free Cash Flow and Forward PE .
How to use it.
just select the financial data, period and size of data to compare.
you can check the box to toggle the plotting line, label and table.
Enjoy.
Price/Time CyclesThis is a script for laying out cycles of price & time that are square (though you can adjust the ratios)
There is an "Auto-cycle" option also
You may have to adjust the ratios of both time & price in different ways to get the right settings but you can experiment
Limit the amount of price lines you are displaying otherwise you may get some errors in the information plotted
(the script says max 10 but really there is no true maximum set & you will get missing information as it begins to plot too many lines... I'll try to define this in the future)
Remember you can put down multiple cycles & change the styling.
FOR LINE STYLE- please use this syntax:
Solid Line = sol
Dotted Line = dot
Dashed Line = dsh
(I'll try to setup options for that in the future)
You can lay cycles into the past using the horizontal offset tool but there is a limit of setting the info back beyond 5000 bars, also, generally this process is a bit funny
The script can only put vertical lines up to 500 bars into the future. So, although cycles of 500 bars or more can be used, the future bar will not be plotted until it is within 500 bars of the current bar. In other words, doing very long-term analysis or trying to lay higher timeframe bar counts onto smaller timeframes might not work & may be a buggy process

Detrended Synthetic Price [CC]The Detrended Synthetic Price was created by Bill Mars and this indicator is another undiscovered gem that I have found very useful. He obviously took inspiration from John Ehlers in the creation of this indicator and I would describe this indicator as a combination of a MACD and Ehlers work. This indicator is extremely smooth and gives very clear buy and sell signals. Let me know how this indicator works for you. I have included strong buy and sell signals in addition to normal ones so strong signals are darker in color and normal signals are lighter in color. Buy when the line turns green and sell when it turns red.
Let me know if there are any other indicators or scripts you would like to see me publish!

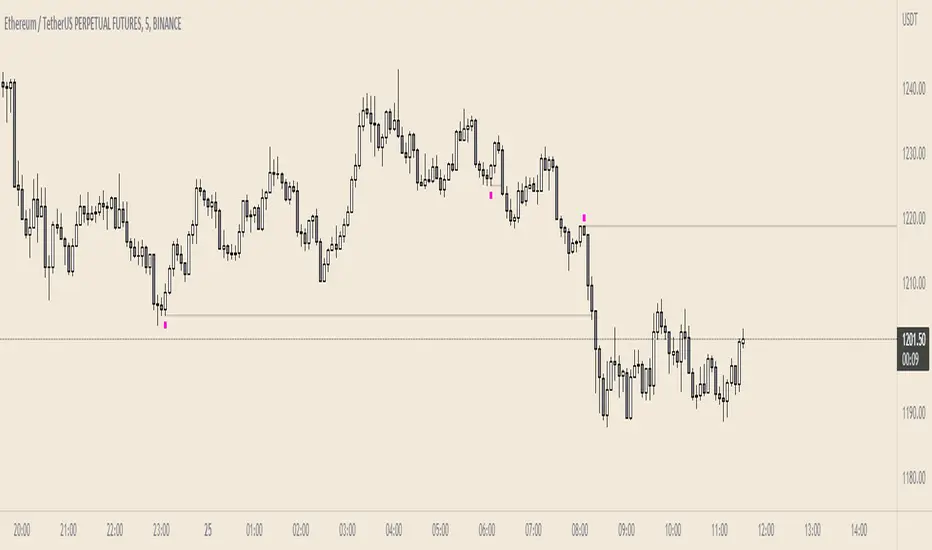
Failed AuctionAs we know, buyers and sellers take part in the market auction.
A failed auction is where price could not tick above or below a specific price. This means that there were no buyers willing to buy or sellers willing to sell beyond that price. Price then moves away in the other direction.
The failed auction acts as a magnet and becomes a target to revisit sooner or later. The failed auction is a successful/finished auction once it has been satisfied.
On the indicator, two adjacent candles with the exact same high or low are marked. The icon will appear on the high or low of the 2nd candle. This notifies us that there was a failed auction.
If you are in a trade, you can use the failed auction to hold onto the trade longer. If you are not in a trade, you should be cautious if a failed auction rests above or below you limit order.
Icons and colours are customisable. An option to have plotted lines for the failed auction is included.
Works on all timeframes.
GT - Recent High/Low█ OVERVIEW
This indicator will help traders identify the recent high and low of the current trend so we know where we are in the trend. If recent high/low broken it could be that the trend is changing. This indicator is based on price action.
█ HOW IT WORKS
Basically, a trend is when the prices move up and down in a stair-step fashion. In an uptrend, The indicator keeps track of the up and down movement and remember the last high and once the price pull back and broke the recent high it will mark out the new high. When prices pull back in and uptrend it must not broken the recent low. If the pull back move broke the recent low it could means that the trend is changing and we could see prices start going down. Downtrend is the reverse of uptrend.
Whenever the price broke the recent high or low the script will go back from the candle that broken the previous high to find the recent low. As long as the high of previous candle is lower than each other consecutively backward, all of those candle will be counted as part of the up move. The lowest low of these candles will be counted as the recent low. If one of the candles that are part of the up move is an inside bar then the recent low is the low of that inside bar candle (for downtrend it will be the high). Inside bar candle is a candle that it's high and low are both inside the high and low of the candle preceding it (to its left).
█ DISCLAIMERS
The content of this post is NOT investment advice and I am not a financial advisor.
This is for educational purpose only.
Always do you own research. Do not blindly trust a random stranger online.
█ HOW DOES IT HELP YOU
Moving the recent high and low every time a candle break out is a very tedious job. Plus, you cannot set an automatic alert system whenever price broke a recent high or low. This indicator allow you to create an alert whenever a recent high or low is broken.
You can use this indicator as a trailing stop loss strategy. Move the stop loss of your long position to the recent low level whenever price broke recent high or move the stop loss of your short position to the recent high level whenever price broke recent low.
The bullet line is the minor recent high or low before the prices broke the major recent high/low. This line could be the level where prices touch before continue with the trend.
█ TRADING IDEAS
Based on how a candle broke the recent high or low, if it breaks impulsively you can develop your strategy to trade the pullback and hoping on the trend before it continue to move up or down.
█ CURRENT FEATURES
Recent high/low.
Previous high/low.
Inside bar marker.
Alert for when high/low broken. Configurable message format either in JSON or plain text, useful when using with webhook alert.
Bullet line (trend continuation line).
Toggle switch to redraw in realtime. CAUTION: this will cause repainting and alert will fire multiple time during a real-time bar.
█ NOTES
- I am very new to pine script. So there could be a way to handle the alert in realtime to not fire multiple time, Once I found a way I will update the indicator. However, redrawing in realtime will definitely cause repainting of high/low or bullet line, as far as I know this cannot be fixed because it is how pine script compiler works.
- If you like the indicators and it helps you please be sure to leave a like.
█ CREDITS
This indicator is made by me but the idea is inspired by Guerrilla Trading course. Which is why this indicator is closed-source. Guerrilla doesn't support the use of indicators and they believe in mastering reading candle sticks using price action on a naked chart. However, I'm a visual learner, I do my due diligent in backtesting and learning how to read the chart. I think that a little help with indicator to smooth my learning curve or make it easier to identify important level is very useful.
!IMPORTANT!: If you are a member of Guerrilla please do not advertise this indicator on their forum as they do not support the idea of using indicators.
While using the indicator if you found any bugs or the lines draw incorrectly please report it directly to me by leaving a comment or message me directly. Do not report the bugs of this indicator to Guerrilla Trading as this has nothing to do with them and they are not the maintainer.
If you are not a member of Guerrilla but you are considering joining Guerrilla Trading. You can support me out by using my affiliate link in my Signature . Thank you very much!
█ CONTRIBUTE
If you are a developer and a member of Guerrilla and you would like to contribute to this indicator please message me.

Silen's Financials Fair ValueIt is finally here! 🔥 My 3rd and most important script in my Financial series! 🚀
Ever imagined to see all fundamentals (or many that is) combined into one indicator that is right on your chart, showing you how your favorite stock is trading compared to its fundamentals?
Well, here is your answer! 📡
____________________________________________________________________________________________
This script shows you my own personal interpretation of fair value, based solely on the financial fundamentals of a company compared to market averages.
I don't believe that certain sectors of the market should be priced higher than others. If you look at historical data you'll see that favored sectors always rotate - placing insanely high P/E multiples on some sectors. Once they are "out" and people rotate away from those sectors you're left with nothing but the naked fundamentals that matter. So, you'll see many companies, that have been doing well on paper, see their share price decline by 70-90% for no other reasons than people favoring other sectors.
That's why it's even more important to focus on fair value that is solely fundamentals-based. Know when your stock gets to expensive. 🤯
____________________________________________________________________________________________
To give you some examples:
- Most Megacaps trade at historically high valuations, several times my fair value. Those include AAPL, MSFT, NVDA, AMZN, TSLA, JPM, TSM, V and so on. And no, in the past they partially traded below (my) fair value.
- Most Cybersecurity / Cloud companies are trading at truly massive multiples of my fair value. (NET, DDOG, etc)
- Many Smallcaps & Midcaps are trading several multiples (OESX, CODX, QFIN) below my fair value. And no, in the past they partially traded above (my) fair value.
Ok, so much about the market. You ultimately decide how much you want to orientate on fair value. 👨🏫
____________________________________________________________________________________________
This fair value indicator (purple line):
Takes the P/E rate of the company and compares it to the market (50% weight)
Takes the P/S rate of the company and compares it to the market (50% weight)
Then adds boni and mali f or debt/equity rates and debt and equity itself
Also looks at past growth and calculates future P/E and P/S rates which adds , in some cases, value to the fair value (green line)
Also compares how historical valuations have behaved compared to fair value and simulates a fair value guideline (dark blue line)
____________________________________________________________________________________________
This script is part 3️⃣ of a series of indicators that work well together.
Script 1️⃣ of the series is:
P/E & P/S Rates
Script 2️⃣ of the series is:
Debt & Equity
If you use all 3 scripts together it will look like this, giving you truly deep and simple information about the fundamentals of a company:
Example 1 - AMD
Example 2 - HZO
Example 3 - APPS
I hope this script makes your investing and stock picks a lot easier! 🔆💹🕗
Disclaimer: Fair value is always subjective. There are many different approaches to fair value. This one is only my personal interpretation.
Disclaimer 2: This script works only for the Day-Timeframe.
Disclaimer 3: This script uses 17,5 P/E and 3,0 P/S as market averages. The actual average keeps changing but, historically speaking, these seemed to be good numbers.
Feel free to share your thoughts and feedback! 🙃

[DisDev] Market Maker | Technical Time AnalysisThis indicator has three main components: Days of Week Separators , User-Customized Reminder Notes , and Projected Lines . Each component is explained and demonstrated how it could be used as a trading tool.
The basis of this indicator is to analyze past price movements and then project them as a reminder for traders that previously, at that particular time, there was a price increase/decrease.
1) Vertical lines and labels separate days of the week.
a. The vertical lines allow you to quickly see what day of the week the price movement occurred. For example, if a notable price move happens on Monday, you can use the “Reminder Notes” input to enter a note directly on the chart, as explained below.
b. You can select different colors and styles for the lines or background.
2) Vertical lines can be customized to be displayed in the past and future.
a. This allows you to select a specific time when price has increased/decreased, see how often this has occurred, then notate it as a reminder in the future.
3) User-customized reminder notes for future projected lines.
a. This allows you to input notes to be displayed with the future projected lines.
b. Example: You notice that at 06:45, there had previously been significant price action. Your notes can be updated directly on the chart to remind you of them just before 06:45 on the following days.
Below is the indicator in full use.
You can adjust each line's style, width, color, and reminder notes.

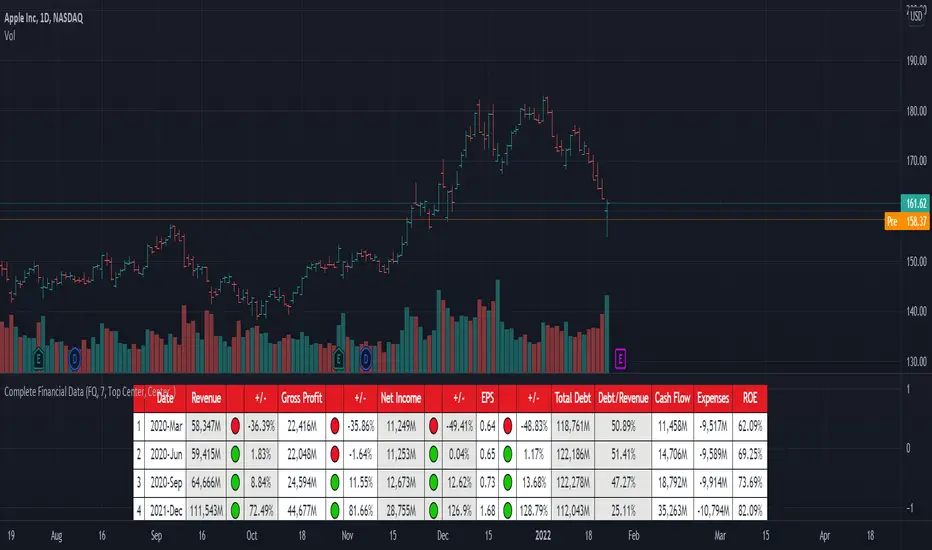
[TG] Complete Financial DataHISTORY & CREDITS
Complete Financial Data is basic, yet very effective tool, that will show the most important information from the company's latest financial statements at a glance.
WHAT IT DOES
The table is designed to show comprehensive financial data about the selected ticker.
Revenue - often referred to as sales or the top line, is the money received from normal business operations.
Gross profit , also called gross income, is calculated by subtracting the cost of goods sold from revenue.
Net income , also called net earnings, is calculated as sales minus cost of goods sold, selling, general and administrative expenses, operating expenses, depreciation, interest, taxes, and other expenses.
Earnings per share (EPS) is calculated as a company's profit divided by the outstanding shares of its common stock. The resulting number serves as an indicator of a company's profitability.
Total debt includes long-term liabilities, such as mortgages and other loans that do not mature for several years, as well as short-term obligations, including loan payments and accounts payable balances.
The debt-to-revenue ratio is a financial measure that compares a company's monthly debt payment to its monthly gross income.
The term cash flow refers to the net amount of cash and cash equivalents being transferred in and out of a company. Cash received represents inflows, while money spent represents outflows.
An expense is the cost of operations that a company incurs to generate revenue. As the popular saying goes, “it costs money to make money.”
Return on equity (ROE) is a measure of financial performance calculated by dividing net income by shareholders' equity.
HOW TO USE IT
Even if you are entirely a technical analyst, it's always a good practice to take a look at the company's fundamentals, in order to understand more about the heath of the business. Look for companies that beat expectations and show positive growth numbers.
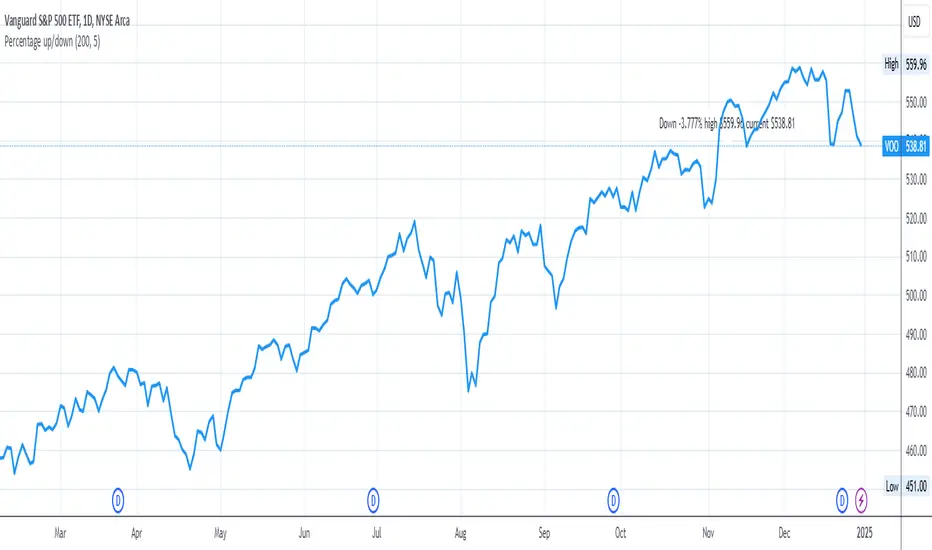
Percentage up/downIn order to buy stocks, I want to know how much the stock went down from the all-time high price. Therefore, this script shows how much the current stock has dropped from the all-time high.
You can change:
- how many periods to get the all-time high from
- location on the y-axis to place the label on the chart
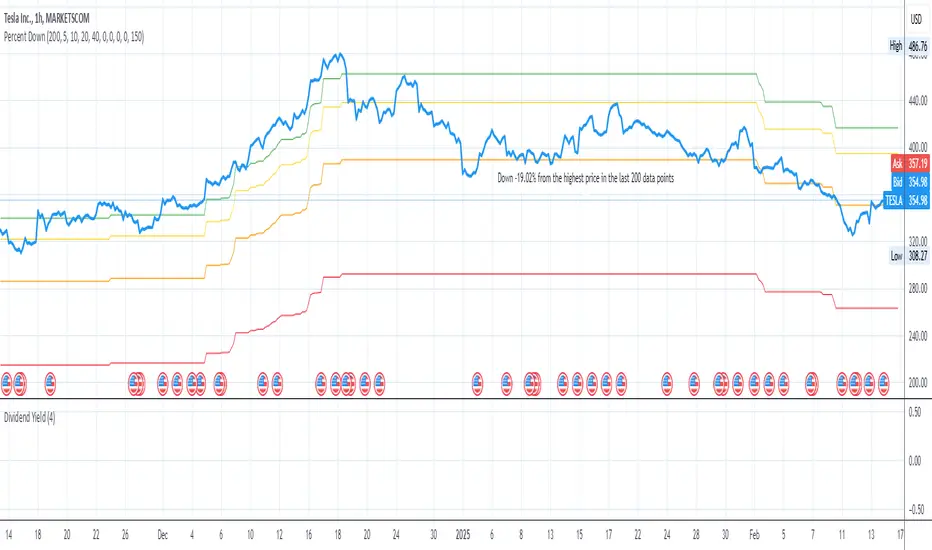
Price Target Pullback Correction or BearPrice Target percent drop is an indicator that allows you to set default percentage down from the 52 week high.
A pullback, correction, bear and a bear market is marked as a 5%, 10%, 20% or 40% drop from the 52 week highest price, so this will show the target price to buy at if these thresholds are hit.
You can change the default values of 5%, 10%, 20% and 40% to any percentage and the price will reflect the change of the default value. Furthermore, the default to use 52 weeks can be changed to find the highest price from the last 26 weeks or 104 weeks.
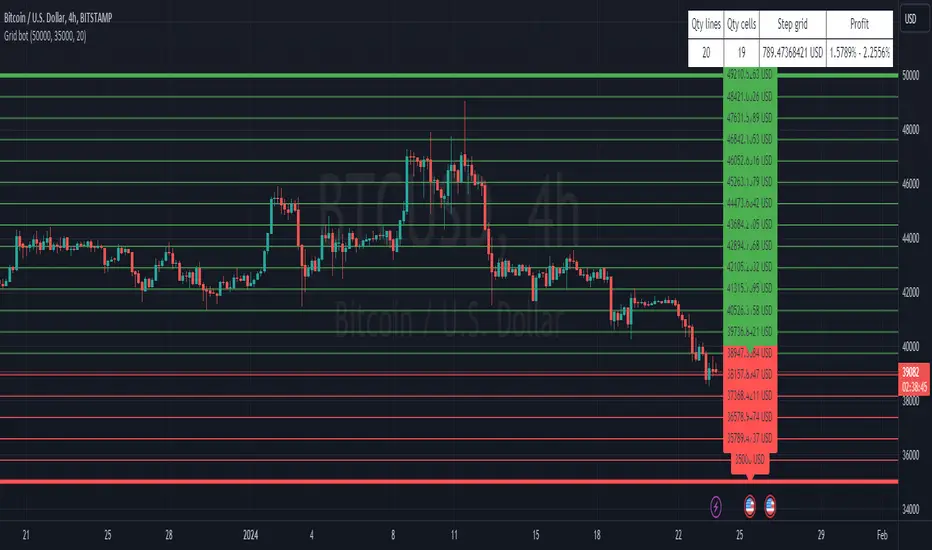
3commas GRID bot VisualisationHello everyone
This is a grid display indicator for a 3-comma grid bot.
Just enter the upper and lower borders of your grid and the number of grid cells in the indicator settings.
It's simple!
FX Profit CalculatorWith this indicator, you will be able to see how much you earn in forex in dollar terms.
It asks you 3 things when adding the indicator.
TP point
SL point
Position Entry point
If you have selected the TP point above, the entry zone below it, and the SL point below it, the indicator will automatically understand that there is a BUY order and will make the calculations accordingly.
The same is true for the opposite.
When you use the indicator in any parity, you will have problems switching to other parities.
So either use it only in one parity, or update your targets from the indicator settings at every parity change.
You will get the same error if:
Your trading entry point should be between your TP and SL points. If you do not set it this way, the indicator will warn that please fix it.
If you are in the trade, tick the settings and show the dollar-based profit of your position according to the instant closing price.
The percentage variable works like this:
When you adjust for one parity, shifts occur in the chart when you switch to the other parity. When switching to non-circulating graphics at the same prices, the user is prompted to re-enter so that the graphic does not deteriorate.
BONUS : You can move these lines up and down with your mouse on the graphic :)

MTF Market Structure Highs and LowsThe indicator marks the last fractal highs and lows (W,D,4H and 1H options) to help determine current market structure. The script was created to help with directional bias but also as a MTF visual aid for stop hunts/liquidity raids.
Liquidity areas are where we assume trader's stop losses would be when buying or selling. Liquidity lies above and below swing points and institutions need liquidity to fill large orders.
Monitor price action as it hits these areas for a potential reversal trade.

Synthetic Price Action GeneratorNOTICE:
First thing you need to know, it "DOES NOT" reflect the price of the ticker you will load it on. THIS IS NOT AN INDICATOR FOR TRADING! It's a developer tool solely generating random values that look exactly like the fractals we observe every single day. This script's generated candles are as fake as the never ending garbage news cycles we are often force fed and expected to believe by using carefully scripted narratives peddled as hypnotic truth to psychologically and emotionally influence you to the point of control by coercion and subjugation. I wanted to make the script's synthetic nature very clear using that analogy, it's dynamically artificial. Do not accidentally become disillusioned by this scripts values, make trading decisions from it, and lastly don't become victim to predatory media magic ministry parrots with pretty, handsome smiles, compelling you to board their ferris wheel of fear. Now, on to the good stuff...
BACKSTORY:
Occasionally I find myself in situations where I have to build analyzers in Pine to actually build novel quantitative analytic indicators and tools worthy of future use. These analyzers certainly don't exist on this platform, but usually are required to engineer and tweak algorithms of the highest quality with the finest computational caliber. I have numerous other synthesizers to publish besides this one.
For many reasons, I needed a synthetic environment to utilize the analyzers I built in Pine, to even pursue building some exotic indicators and algorithms. Pine doesn't allow sourcing of tuples. Not to mention, I required numerous Pine advancements to make long held dreams into tangible realities. Many Pine upgrades have arrived and MANY, MANY more are in need of implementation for all. Now that I have this, intending to use it in the future often when in need, you can now use it too. I do anticipate some skilled Pine poets will employ this intended handy utility to design and/or improved indicators for trading.
ORIGIN:
This was inspired by the brilliance from the world renowned ALGOmist John F. Ehlers, but it's taken on a completely alien form from its original DNA. Browsing on the internet for something else, I came across an article with a small code snippet, and I remembered an old wish of mine. I have long known that by flipping back and forth on specific tickers and timeframes in my Watchlist is not the most efficient way to evaluate indicators in multiple theatres of price action. I realized, I always wanted to possess and use this sort of tool, so... I put it into Pine form, but now have decided to inject it with Pine Script steroids. The outcome is highly mutable candle formations in a reusable mutagenic package, observable above and masquerading as genuine looking price candles.
OVERVIEW:
I guess you could call it a price action synthesizer, but I entitled it "Synthetic Price Action Generator" for those who may be searching for such a thing. You may find this more useful on the All or 5Y charts initially to witness indication from beginning (barstate.isfirst === barindex==0) to end (last_bar_index), but you may also use keyboard shortcuts + + to view the earliest plottable bars on any timeframe. I often use that keyboard shortcut to qualify an indicator through the entirety of it's runtime.
A lot can go wrong unexpectedly with indicator initialization, and you will never know it if you don't inspect it. Many recursively endowed Infinite Impulse Response (IIR) Filters can initialize with unintended results that minutely ring in slightly erroneous fashion for the entire runtime, beginning to end, causing deviations from "what should of been..." values with false signals. Looking closely at spg(), you will recognize that 3 EMAs are employed to manage and maintain randomness of CLOSE, HIGH, and LOW. In fact, any indicator's barindex==0 initialization can be inspected with the keyboard shortcuts above. If you see anything obviously strange in an authors indicator, please contact the developer if possible and respectfully notify them.
PURPOSE:
The primary intended application of this script, is to offer developers from advanced to even novice skill levels assistance with building next generation indicators. Mostly, it's purpose is for testing and troubleshooting indicators AND evaluating how they perform in a "manageable" randomized environment. Some times indicators flake out on rare but problematic price fluctuations, and this may help you with finding your issues/errata sooner than later. While the candles upon initial loading look pristine, by tweaking it to the minval/maxval parameters limits OR beyond with a few code modifications, you can generate unusual volatility, for instance... huge wicks. Limits of minval= and maxval= of are by default set to a comfort zone of operation. Massive wicks or candle bodies will undoubtedly affect your indication and often render them useless on tickers that exhibit that behavior, like WGMCF intraday currently.
Copy/paste boundaries are provided for relevant insertion into another script. Paste placement should happen at the very top of a script. Note that by overwriting the close, open, high, etc... values, your compiler will give you generous warnings of "variable shadowing" in abundance, but this is an expected part of applying it to your novel script, no worries. plotcandle() can be copied over too and enabled/disabled in Settings->Style. Always remember to fully remove this scripts' code and those assignments properly before actual trading use of your script occurs, AND specifically when publishing. The entirety of this provided code should never, never exist in a published indicator.
OTHER INTENTIONS:
Even though these are 100% synthetic generated price points, you will notice ALL of the fractal pseudo-patterns that commonly exist in the markets, are naturally occurring with this generator too. You can also swiftly immerse yourself in pattern recognition exercises with increased efficiency in real time by clicking any SPAG Setting in focus and then using the up/down arrow keys. I hope I explained potential uses adequately...
On a personal note, the existence of fractal symmetry often makes me wonder, do we truly live in a totality chaotic universe or is it ordered mathematically for some outcomes to a certain extent. I think both. My observations, it's a pre-deterministic reality completely influenced by infinitesimal amounts of sentient free will with unimaginable existing and emerging quantities. Some how an unknown mysterious mechanism governing the totality of universal physics and mathematics counts this 100.0% flawlessly and perpetually. Anyways, you can't change the past that long existed before your birth or even yesterday, but you can choose to dream, create, and forge the future into your desires and hopes. As always, shite always happens when your not looking for it. What you choose to do after stepping in it unintentionally... is totally up to you. :) Maybe this tool and tips provided will aid you in not stepping in an algo cachucha up to your ankles somehow.
SCRIPTING LESSONS PORTRAYED IN THIS SCRIPT:
Pine etiquette and code cleanliness
Overwrite capabilities of built-in Pine variables for testing indicators
Various techniques to organize Settings panel while providing ease of adjustment utility
Use of tooltip= to provide users adequate valuable information. Most people want to trade with indicators, not blindly make adjustments to them without any knowledge of their intended operation/effects
When available time provides itself, I will consider your inquiries, thoughts, and concepts presented below in the comments section, should you have any questions or comments regarding this indicator. When my indicators achieve more prevalent use by TV members , I may implement more ideas when they present themselves as worthy additions. Have a profitable future everyone!
