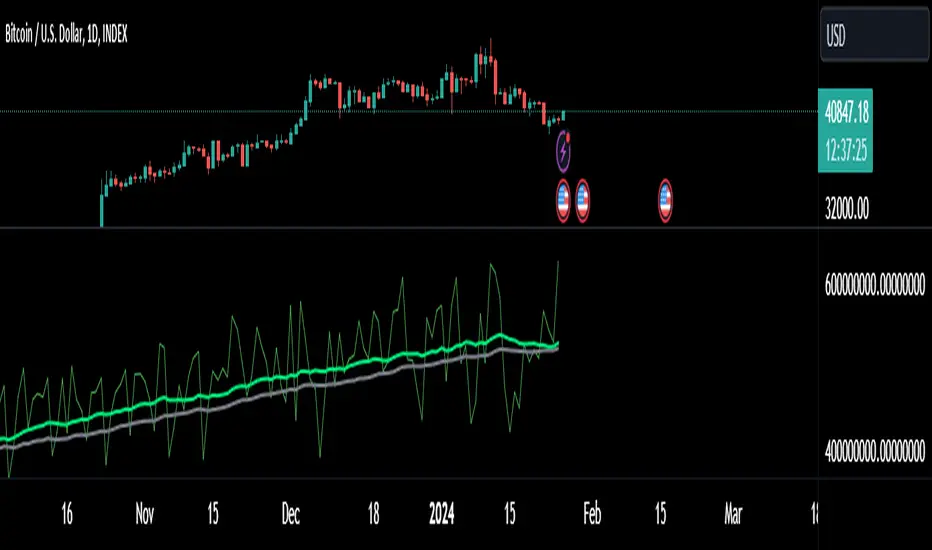
Momentum Acceleration by DGTItalian physicist Galileo Galilei is usually credited with being the first to measure speed by considering the distance covered and the time it takes. Galileo defined speed as the distance covered during a period of time. In equation form, that is v = Δd / Δt where v is speed, Δd is change in distance, and Δt is change in time. The Greek symbol for delta, a triangle (Δ), means change.
Is the speed getting faster or slower?
Acceleration will be the answer, acceleration is defined as the rate of change of speed over a set period of time, meaning something is getting faster or slower. Mathematically expressed, acceleration denoted as a is a = Δv / Δt , where Δv is the change in speed and Δt is the change in time.
How to apply in trading
Lets think about Momentum, Rate of Return, Rate of Change all are calculated in almost same approach with Speed
Momentum measures change in price over a specified time period,
Rate of Change measures percent change in price over a specified time period,
Rate of Return measures the net gain or loss over a specified time period,
And Speed measures change in distance over a specified time period
So we may state that measuring the change in distance is also measuring the change in price over a specified time period which is length, hence
speed can be calculated as (source – source )/length and acceleration becomes (speed – speed )/length
In this study acceleration is used as signal line and result plotted as arrows demonstrating bull or bear direction where direction changes can be considered as trading setups
Just a little fun, since we deal with speed the short name of the study is named after famous cartoon character Speedy Gonzales
Trading success is all about following your trading strategy and the indicators should fit within your trading strategy, and not to be traded upon solely
Disclaimer: The script is for informational and educational purposes only. Use of the script does not constitutes professional and/or financial advice. You alone the sole responsibility of evaluating the script output and risks associated with the use of the script. In exchange for using the script, you agree not to hold dgtrd TradingView user liable for any possible claim for damages arising from any decision you make based on use of the script
Backtest

Candle Crawler V1 [Moon]Candle Crawler is designed to crawl back through candle and bar data to retrieve specific values of interest.
The first implementation shows
Total bars or candles on any specific time frame or asset to the beginning of the chart. This can be used for backtesting or looking for specific assets / time frames that have a lot of backtest data.
- *usually* More backtest data = More accurate strategy implementation or live testing.
Crawls back and counts Red vs Green candles in a defined period (the max is 4999 total bars).
Use this to identify bearish or bullish trends and assets.
- *hint* if an asset through time is leaning heavily one way, a long-only or short-only strategy may be worth investigating.
Plots days of the week on each candle within it's specific day (turned off by default).
Default view of Total Candles + R/G (note if you want to turn off the labels go to the "Style" tab and just uncheck "Labels" at the bottom).
Works on any asset or timeframe including stocks and forex.
Easily filter days on or off to identify specific patterns or trends (check the "days of the week" box for ON|OFF) or head to the "style" tab to customize days or colors.
Most precise on the Daily (D) timeframe, but applicable on any.
If interested send me a DM.

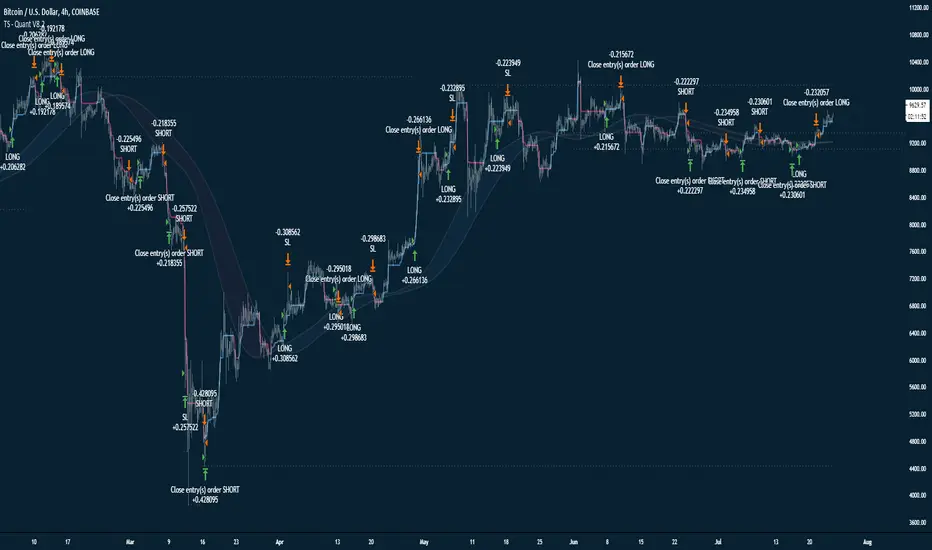
Tradespot Quant - Strategy & AlertsTradespot - Quant is an extensive trading algorithm, signal generator and technicals screener packed into one beautifully designed, functional indicator. The script is very customisable to not limit the trader using it but does have some very respectable default settings for BTCUSD on the 4H and 15M charts that we run in an automated fashion here a Tradespot round the clock on Binance Futures.
What does Tradespot Quant do?
Trade following signals generated via our bespoke algorithm
Full customisation to allow a deeper use of the indicator across different assets
Full risk management with take profit and stop loss levels (configurable) built in
Presets for BTCUSD & ETHUSD on the 4H/15M timeframes avaliable instantly for your use.
Innovative trade panel that illustrates key information such as what trade the algorithm is looking for next
More features being added all the time, we have great ideas and our only limitation is how fast we can program it!
Cornix compatible alerts - with the easiest of configurations you can automate this execution of this strategy.
Do you do a free trial?
Yes! Get in touch for a complimentary 48 hour free trial to the indicator, no strings attached.
Who are you?
Tradespot has been creating scripts for years on TradingView that we use to leverage our social trading and signal group offerings. We currently have over $200K in assets trading with our strategies across over 300 users.
You can learn more about us on our website. Please reach out to me or see the link on our profile.
Simple SMA Strategy Backtest Part 4Added Take Profit and Stop Loss logic.
Part 4 :
www.tradingview.com
Part 3:
www.tradingview.com

Combo Backtest 123 Reversal & Empirical Mode Decomposition This is combo strategies for get a cumulative signal.
First strategy
This System was created from the Book "How I Tripled My Money In The
Futures Market" by Ulf Jensen, Page 183. This is reverse type of strategies.
The strategy buys at market, if close price is higher than the previous close
during 2 days and the meaning of 9-days Stochastic Slow Oscillator is lower than 50.
The strategy sells at market, if close price is lower than the previous close price
during 2 days and the meaning of 9-days Stochastic Fast Oscillator is higher than 50.
Second strategy
The related article is copyrighted material from Stocks & Commodities Mar 2010
WARNING:
- For purpose educate only
- This script to change bars colors.

Simple SMA Strategy BacktestAdded strategy logic.
Part 3:
www.tradingview.com
Part 2:
www.tradingview.com
Part 1:
Simple SMA Indicator
www.tradingview.com
WARNING:
- For purpose educate only

Combo Backtest 123 Reversal & EMA & MA Crossover This is combo strategies for get a cumulative signal.
First strategy
This System was created from the Book "How I Tripled My Money In The
Futures Market" by Ulf Jensen, Page 183. This is reverse type of strategies.
The strategy buys at market, if close price is higher than the previous close
during 2 days and the meaning of 9-days Stochastic Slow Oscillator is lower than 50.
The strategy sells at market, if close price is lower than the previous close price
during 2 days and the meaning of 9-days Stochastic Fast Oscillator is higher than 50.
Second strategy
The Moving Average Crossover trading strategy is possibly the most popular
trading strategy in the world of trading. First of them were written in the
middle of XX century, when commodities trading strategies became popular.
This strategy is a good example of so-called traditional strategies.
Traditional strategies are always long or short. That means they are never
out of the market. The concept of having a strategy that is always long or
short may be scary, particularly in today’s market where you don’t know what
is going to happen as far as risk on any one market. But a lot of traders
believe that the concept is still valid, especially for those of traders who
do their own research or their own discretionary trading.
This version uses crossover of moving average and its exponential moving average.
WARNING:
- For purpose educate only
- This script to change bars colors.

Combo Backtest 123 Reversal & Elder Ray (Bull Power) This is combo strategies for get a cumulative signal.
First strategy
This System was created from the Book "How I Tripled My Money In The
Futures Market" by Ulf Jensen, Page 183. This is reverse type of strategies.
The strategy buys at market, if close price is higher than the previous close
during 2 days and the meaning of 9-days Stochastic Slow Oscillator is lower than 50.
The strategy sells at market, if close price is lower than the previous close price
during 2 days and the meaning of 9-days Stochastic Fast Oscillator is higher than 50.
Second strategy
Developed by Dr Alexander Elder, the Elder-ray indicator measures buying
and selling pressure in the market. The Elder-ray is often used as part
of the Triple Screen trading system but may also be used on its own.
Dr Elder uses a 13-day exponential moving average (EMA) to indicate the
market consensus of value. Bull Power measures the ability of buyers to
drive prices above the consensus of value. Bear Power reflects the ability
of sellers to drive prices below the average consensus of value.
Bull Power is calculated by subtracting the 13-day EMA from the day's High.
Bear power subtracts the 13-day EMA from the day's Low.
You can use in the xPrice any series: Open, High, Low, Close, HL2, HLC3, OHLC4 and ect...
WARNING:
- For purpose educate only
- This script to change bars colors.

Pivot Point V2 Backtest Pivot points simply took the high, low, and closing price from the previous period and
divided by 3 to find the pivot. From this pivot, traders would then base their
calculations for three support, and three resistance levels. The calculation for the most
basic flavor of pivot points, known as ‘floor-trader pivots’, along with their support and
resistance levels.
WARNING:
- For purpose educate only
- This script to change bars colors.

TradeSense Breakout Strategy v1TradeSense is a Renko brick breakout trading system for short-term or intraday trade. It is also a trend following strategy using a confluence of multiple MA's to spot the underlying trend. Exit and Stop Loss is based on dynamic ATR to predict possible target based on ticker's real time volatility.
So far this has been back-tested on major cyrptos, and the same concept is applicable to other asset types. It is more suitable for lower timeframes (such as the 30m, 15m, and 5m) though you may try adjusting the parameters for higher timeframes.
Feel free to backtest it and comment below!
Optimum parameters:
BTCUSD-15m
- Noise Filter: 1
- ATRLength : 15
- SL coefficient : 2.0
- TP coefficient : 1.5
ETHUSD-15m
- Noise Filter: 7
- ATRLength : 16
- SL coefficient : 2.0
- TP coefficient : 1.5

Combo Backtest 123 Reversal & Elder Ray (Bear Power) This is combo strategies for get a cumulative signal.
First strategy
This System was created from the Book "How I Tripled My Money In The
Futures Market" by Ulf Jensen, Page 183. This is reverse type of strategies.
The strategy buys at market, if close price is higher than the previous close
during 2 days and the meaning of 9-days Stochastic Slow Oscillator is lower than 50.
The strategy sells at market, if close price is lower than the previous close price
during 2 days and the meaning of 9-days Stochastic Fast Oscillator is higher than 50.
Second strategy
Developed by Dr Alexander Elder, the Elder-ray indicator measures buying
and selling pressure in the market. The Elder-ray is often used as part
of the Triple Screen trading system but may also be used on its own.
Dr Elder uses a 13-day exponential moving average (EMA) to indicate the
market consensus of value. Bull Power measures the ability of buyers to
drive prices above the consensus of value. Bear Power reflects the ability
of sellers to drive prices below the average consensus of value.
Bull Power is calculated by subtracting the 13-day EMA from the day's High.
Bear power subtracts the 13-day EMA from the day's Low.
You can use in the xPrice any series: Open, High, Low, Close, HL2, HLC3, OHLC4 and ect...
WARNING:
- For purpose educate only
- This script to change bars colors.

Hull Suite StrategyConverted the hull suite into a strategy script for easy backtesting and added ability to specify a time periods to backtest over.
[FN] Session Range & Date Range For BacktestingThis has been done before in different ways, however, my goal is to publish a single, simplified copy/paste version of the idea so you can quickly and easily incorporate it into your strategy backtesting.
You can designate weekdays, weekdays + weekends for 24/7 markets, and also session range.
So, you trade bitcoin? It works. CME futures? It works. You are a discretionary trader so the only signals that matter are the ones that happen when you're awake? It works. Copy and paste.
The goal is that its that easy. You'll have to let me know if it is. glhf everyone.
If I'm not mistaken, you should be able to copy/paste this directly into your strategy script (Paste it in before your entry declarations). Just leave out the last 2 lines where the bgcolor() is declared... unless you want the background color lit up, that's up to you. It's just for demonstration purposes in this script.
After you've pasted it in, then in your strategy.entry() function you are adding: to the strategy.entry() function.
e.g:
strategy.entry("Long", strategy.long, qty=1, when = ENTRY_SIGNAL and signal_backtest())
Shoutouts to @zenandtheartoftrading and @allanster for providing the basis of this code that I put together here. We stand on the shoulders of giants.

Camarilla Pivot Points V2 Backtest Camarilla pivot point formula is the refined form of existing classic pivot point formula.
The Camarilla method was developed by Nick Stott who was a very successful bond trader.
What makes it better is the use of Fibonacci numbers in calculation of levels.
Camarilla equations are used to calculate intraday support and resistance levels using
the previous days volatility spread. Camarilla equations take previous day’s high, low and
close as input and generates 8 levels of intraday support and resistance based on pivot points.
There are 4 levels above pivot point and 4 levels below pivot points. The most important levels
are L3 L4 and H3 H4. H3 and L3 are the levels to go against the trend with stop loss around H4 or L4 .
While L4 and H4 are considered as breakout levels when these levels are breached its time to
trade with the trend.
WARNING:
- For purpose educate only
- This script to change bars colors.

Camarilla Pivot Points Backtest Pivot point studies highlight prices considered to be a likely turning point
when looking at values from a previous period, whether it be daily, weekly,
quarterly or annual. Each pivot point study has its own characteristics on
how these points are calculated.
Red color = Sell
Green color = Buy
WARNING:
- For purpose educate only
- This script to change bars colors.
Hash Ribbons Backtest - Bitcoin Beats YT
Hello Hello Hello and welcome back to Bitcoin Beats!
This is a script written by capriole_charles
Go check out the original!
I have added leverage and stoploss % but also made it a strategy so we can look back at past trades to see patterns and profit.
Personally I feel this is not enough data to trade off as BTC is such a young asset. However I have seen other models similar to this for other assets that hold strong.
Trade safe!
Good bye from bitcoin beats!
Not Meant For The 1H! My Bad! higher timeframes are better!
The "Spring" is the confirmed Miner capitulation period:
The 1st "gray" circle is the start of Capitulation (1 month Hash Rate crosses UNDER 2 month Hash Rate)
Last "green" circle is the end of Capitulation (1 month Hash Rate crosses OVER 2 month Hash Rate)
The "greener" the spring gets (up until blue) represents Hash Rate recovery (it is increasing)
The "blue" circle is the first instance of positive momentum following recovery of Hash Rate (1m HR > 2m HR). This is historically a rewarding place to buy with limited downside.
Combo Backtest 123 Reversal & Elder Ray (Bear Power) This is combo strategies for get a cumulative signal.
First strategy
This System was created from the Book "How I Tripled My Money In The
Futures Market" by Ulf Jensen, Page 183. This is reverse type of strategies.
The strategy buys at market, if close price is higher than the previous close
during 2 days and the meaning of 9-days Stochastic Slow Oscillator is lower than 50.
The strategy sells at market, if close price is lower than the previous close price
during 2 days and the meaning of 9-days Stochastic Fast Oscillator is higher than 50.
Second strategy
Developed by Dr Alexander Elder, the Elder-ray indicator measures buying
and selling pressure in the market. The Elder-ray is often used as part
of the Triple Screen trading system but may also be used on its own.
Dr Elder uses a 13-day exponential moving average (EMA) to indicate the
market consensus of value. Bear Power measures the ability of sellers to
drive prices below the consensus of value. Bear Power reflects the ability
of sellers to drive prices below the average consensus of value.
Bull Power is calculated by subtracting the 13-day EMA from the day's High.
Bear power subtracts the 13-day EMA from the day's Low.
You can use in the xPrice any series: Open, High, Low, Close, HL2, HLC3, OHLC4 and ect...
WARNING:
- For purpose educate only
- This script to change bars colors.
Combo Backtest 123 Reversal & ECO Strategy This is combo strategies for get a cumulative signal.
First strategy
This System was created from the Book "How I Tripled My Money In The
Futures Market" by Ulf Jensen, Page 183. This is reverse type of strategies.
The strategy buys at market, if close price is higher than the previous close
during 2 days and the meaning of 9-days Stochastic Slow Oscillator is lower than 50.
The strategy sells at market, if close price is lower than the previous close price
during 2 days and the meaning of 9-days Stochastic Fast Oscillator is higher than 50.
Second strategy
We call this one the ECO for short, but it will be listed on the indicator list
at W. Blau’s Ergodic Candlestick Oscillator. The ECO is a momentum indicator.
It is based on candlestick bars, and takes into account the size and direction
of the candlestick "body". We have found it to be a very good momentum indicator,
and especially smooth, because it is unaffected by gaps in price, unlike many other
momentum indicators.
We like to use this indicator as an additional trend confirmation tool, or as an
alternate trend definition tool, in place of a weekly indicator. The simplest way
of using the indicator is simply to define the trend based on which side of the "0"
line the indicator is located on. If the indicator is above "0", then the trend is up.
If the indicator is below "0" then the trend is down. You can add an additional
qualifier by noting the "slope" of the indicator, and the crossing points of the slow
and fast lines. Some like to use the slope alone to define trend direction. If the
lines are sloping upward, the trend is up. Alternately, if the lines are sloping
downward, the trend is down. In this view, the point where the lines "cross" is the
point where the trend changes.
When the ECO is below the "0" line, the trend is down, and we are qualified only to
sell on new short signals from the Hi-Lo Activator. In other words, when the ECO is
above 0, we are not allowed to take short signals, and when the ECO is below 0, we
are not allowed to take long signals.
WARNING:
- For purpose educate only
- This script to change bars colors.

Cyato Grid Basic Buy & Sell [BACKTEST]Private indicator
This Grid bot strategy creates buy orders when the price goes down one level or more, and sell order when the price goes up one level or more.
To avoid useless trades, the lastest traded level is disabled until another level is crossed.
To create the grid, one upper level and one lower level is calculated. Those 2 levels are either given by the user using "MANUAL" mode or automatically calculated by an AI. The space between these two levels are then divided equally into several steps, creating the grid. The number of steps is chosen by the user, from 3 to 20.
HOW IT WORKS
This is the Backtest version meaning this is the one you should use with the Strategy Tester (more below).
Select either "MANUAL" or "AI" mode.
When using "MANUAL", you have to configure an upper level and a lower level.
When using "AI", the upper and lower level are automatically calculated from last 7 days high/low plus a 3% deviation. You can configure the timeframe and the deviation.
Select the grid quantity, from 3 to 20.
Example with 3:
Example with 10:
Example with 20:
You can choose between "Once Per Bar Close" or "Once Per Bar" alert type.
"Once Per Bar Close" will wait candle close to confirm a trade.
"Once Per Bar" will trigger a trade if the price crossed a step anytime inside a candle. Note that the backtest will still use bar close price in its calculation.
BACKTESTING
The strategy will buy 1 contract when a BUY signal appears and sell 1 contract when a SELL signal appears.
Here 1 contract = 1 BTC
The strategy can buy up to 20 contracts. Pyramiding is enabled.
The Backtest info panel is here to show how many trades are open in the backtest.
I know very well that a backtest has no value if several trades are left open. That is why I coded a feature to close all open trades at once on the last candle. This feature can be turned on and off.
To get this indicator, use the link in my signature below, thanks!

Combo Backtest 123 Reversal & Ease of Movement (EOM) This is combo strategies for get a cumulative signal.
First strategy
This System was created from the Book "How I Tripled My Money In The
Futures Market" by Ulf Jensen, Page 183. This is reverse type of strategies.
The strategy buys at market, if close price is higher than the previous close
during 2 days and the meaning of 9-days Stochastic Slow Oscillator is lower than 50.
The strategy sells at market, if close price is lower than the previous close price
during 2 days and the meaning of 9-days Stochastic Fast Oscillator is higher than 50.
Second strategy
This indicator gauges the magnitude of price and volume movement.
The indicator returns both positive and negative values where a
positive value means the market has moved up from yesterday's value
and a negative value means the market has moved down. A large positive
or large negative value indicates a large move in price and/or lighter
volume. A small positive or small negative value indicates a small move
in price and/or heavier volume.
A positive or negative numeric value. A positive value means the market
has moved up from yesterday's value, whereas, a negative value means the
market has moved down.
WARNING:
- For purpose educate only
- This script to change bars colors.

Why is it ok to backtest on TradingView from now on!TradingView backtester has bad reputation. For a good reason - it was producing wrong results, and it was clear at first sight how bad they were.
But this has changed. Along with many other improvements in its PineScript coding capabilities, TradingView fixed important bug, which was the main reason for miscalculations. TradingView didn't really speak out about this fix, so let me try :)
Have a look at this short code of a swing trading strategy (PLEASE DON'T FOCUS ON BACKTEST RESULTS ATTACHED HERE - THEY DO NOT MATTER). Sometimes entry condition happens together with closing condition for the already ongoing trade. Example: the condition to close Long entry is the same as a condition to enter Short. And when these two aligned, not only a Long was closed and Short was entered (as intended), but also a second Short was entered, too!!! What's even worse, that second short was not controlled with closing conditions inside strategy.exit() function and it very often lead to losses exceeding whatever was declared in "loss=" parameter. This could not have worked well...
But HOORAY!!! - it has been fixed and won't happen anymore. So together with other improvements - TradingView's backtester and PineScript is now ok to work with on standard candlesticks :)
Yep, no need to code strategies and backtest them on other platforms anymore.
----------------
Having said the above, there are still some pitfalls remaining, which you need to be aware of and avoid:
Don't backtest on HeikenAshi, Renko, Kagi candlesticks. They were not invented with backtesting in mind. There are still using wrong price levels for entries and therefore producing always too good backtesting results. Only standard candlesticks are reliable to backtest on.
Don't use Trailing Stop in your code. TradingView operates only on closed candlesticks, not on tick data and because of that, backtester will always assume price has first reached its favourable extreme (so 'high' when you are in Long trade and 'low' when you are in Short trade) before it starts to pull back. Which is rarely the truth in reality. Therefore strategies using Trailing Stop are also producing too good backtesting results. It is especially well visible on higher timeframe strategies - for some reason your strategy manages to make gains on those huge, fat candlesticks :) But that's not reality.
"when=" inside strategy.exit() does not work as you would intuitively expect. If you want to have logical condition to close your trade (for example - crossover(rsi(close,14),20)) you need to place it inside strategy.close() function. And leave StopLoss + TakeProfit conditions inside strategy.exit() function. Just as in attached code.
If you're working with pyramiding, add "process_orders_on_close=ANY" to your strategy() script header. Default setting ("=FIFO") will first close the trade, which was opened first, not the one which was hit by Stop-Loss condidtion.
----------------
That's it, I guess :) If you are noticing other issues with backtester and would like to share, let everyone know in comments. If the issue is indeed a bug, there is a chance TradingView dev team will hear your voice and take it into account when working on other improvements. Just like they heard about the bug I described above.
P.S. I know for a fact that more improvements in the backtesting area are coming. Some will change the game even for non-coding traders. If you want to be notified quickly and with my comment - gimme "follow".

Combo Backtest 123 Reversal & DSS Bressert This is combo strategies for get a cumulative signal.
First strategy
This System was created from the Book "How I Tripled My Money In The
Futures Market" by Ulf Jensen, Page 183. This is reverse type of strategies.
The strategy buys at market, if close price is higher than the previous close
during 2 days and the meaning of 9-days Stochastic Slow Oscillator is lower than 50.
The strategy sells at market, if close price is lower than the previous close price
during 2 days and the meaning of 9-days Stochastic Fast Oscillator is higher than 50.
Second strategy
Double Smoothed Stochastics (DSS) is designed by William Blaw.
It attempts to combine moving average methods with oscillator principles.
WARNING:
- For purpose educate only
- This script to change bars colors.

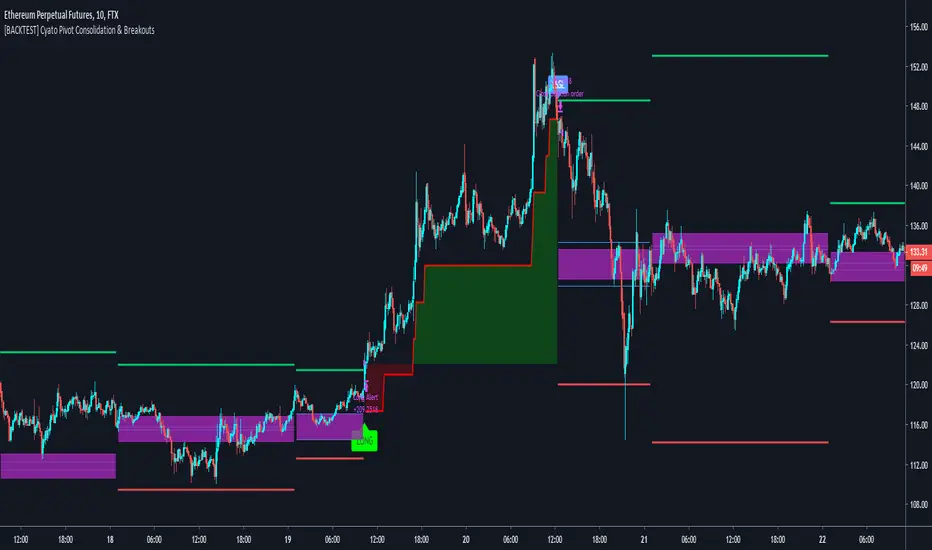
Cyatophilum Pivot Consolidation & Breakouts [BACKTEST]Intraday Strategy built on Pivot Points Standard and Pivot Range.
The idea is to wait for a consolidation period AND a breakout. This really strong condition allows to set a 1/1 Risk/Reward ratio.
Starting from there we secure the profits with a Trailing Stop loss and/or Take Profit system integrated in the script.
This is the Backtest version and you can see the results below. Default settings work great on the 15m chart.
You can change the timeframe of the pivot points as well as the consolidation band in the settings. The SL/TP system is also configurable. This script includes a DCA feature.
To get the indicator, please use the link below, thanks!