Internals Elite NYSE [Beta]Overview:
This indicator is designed to provide traders with a quick overview of key market internals and metrics in a single, easy-to-read table displayed directly on the chart. It incorporates a variety of metrics that help gauge market sentiment, momentum, and overall market conditions.
The table dynamically updates in real-time and uses color-coding to highlight significant changes or thresholds, allowing traders to quickly interpret the data and make informed trading decisions.
Features:
Market Internals:
TICK: Measures the difference between the number of stocks ticking up versus those ticking down on the NYSE. Green or red background indicates if it crosses a user-defined threshold.
Advance/Decline (ADD): Shows the net number of advancing versus declining stocks on the NYSE. Color-coded to show positive, negative, or neutral conditions.
Volatility Metrics:
VIX Change (%): Displays the percentage change in the Volatility Index (VIX), a key gauge of market fear or complacency. Color-coded for direction.
VIX Price: Displays the current VIX price with thresholds to indicate low, medium, or high volatility.
Other Market Metrics:
DXY Change (%): Percentage change in the US Dollar Index (DXY), indicating dollar strength or weakness.
VWAP Deviation (%): Percentage of stocks above VWAP (Volume Weighted Average Price), helping traders assess intraday buying and selling pressure.
Asset-Specific Metrics:
BTCUSD Change (%): Percentage change in Bitcoin (BTC) price, useful for monitoring cryptocurrency sentiment.
SPY Change (%): Percentage change in the S&P 500 ETF (SPY), a proxy for the overall stock market.
Current Ticker Change (%): Percentage change in the currently selected ticker on the chart.
US10Y Change (%): Percentage change in the yield of the 10-Year US Treasury Note (TVC:US10Y), an important macroeconomic indicator.
Customizable Appearance:
Adjustable text size to suit your chart layout.
User-defined thresholds for key metrics (e.g., TICK, ADD, VWAP, VIX).
Dynamic Table Placement:
You can position the table anywhere on the chart: top-right, top-left, bottom-right, bottom-left, middle-right, or middle-left.
How to Use:
Add the Indicator to Your Chart:
Apply the indicator to your chart from the Pine Script editor in TradingView.
Customize the Inputs:
Adjust the thresholds for TICK, ADD, VWAP, and VIX according to your trading style.
Enable or disable the metrics you want to see in the table by toggling the display options for each metric (e.g., Show TICK, Show BTC, Show SPY).
Set the table placement to your preferred position on the chart.
Interpret the Table:
Look for color-coded cells to quickly identify significant changes or breaches of thresholds.
Positive values are typically shown in green, negative values in red, and neutral/insignificant changes in gray.
Use metrics like TICK and ADD to gauge market breadth and momentum.
Refer to VWAP deviation to assess intraday buying or selling pressure.
Monitor the VIX and US10Y changes to stay aware of macroeconomic and volatility shifts.
Incorporate Into Your Strategy:
Use the indicator alongside technical analysis to confirm setups or identify areas of caution.
Keep an eye on correlated metrics (e.g., VIX and SPY) for broader market context.
Use BTCUSD or DXY as additional indicators of risk-on/risk-off sentiment.
Ideal Users:
Day Traders: Quickly gauge intraday market conditions and momentum.
Swing Traders: Identify broader sentiment shifts using metrics like ADD, DXY, and US10Y.
Macro Investors: Stay updated on key macroeconomic indicators like the 10-Year Treasury yield (US10Y) and the US Dollar Index (DXY).
This indicator serves as a comprehensive tool for understanding market conditions at a glance, enabling traders to act decisively based on the latest data.
Chỉ báo Độ rộng

Prior Day High and Low RaysPrior Day High and Low Rays
This custom TradingView indicator projects rays from the prior day's high and low prices, helping you visualize key levels of support and resistance from the previous trading day. The rays extend to the right, continuing from the prior day's high and low throughout the current trading day.
Features:
Displays a ray starting at the prior day's high price.
Displays a ray starting at the prior day's low price.
Rays extend to the right and are only plotted for the immediate prior day.
Customizable ray color and width through the indicator settings.
Use Case:
Track important price levels from the previous day that can act as support or resistance.
Customize the appearance of the rays to match your chart's style and preferences.
This tool is designed for traders who want to incorporate prior day price action into their analysis and maintain a clean, customized chart display.

Buy/Sell Signals for CM_Williams_Vix_FixThis script in Pine Script is designed to create an indicator that generates buy and sell signals based on the Williams VIX Fix (WVF) indicator. Here’s a brief explanation of how this script works:
Main Components:
Williams VIX Fix (WVF) – This volatility indicator is calculated using the formula:
WVF
=
(
highest(close, pd)
−
low
highest(close, pd)
)
×
100
WVF=(
highest(close, pd)
highest(close, pd)−low
)×100
where highest(close, pd) represents the highest closing price over the period pd, and low represents the lowest price over the same period.
Bollinger Bands are used to determine levels of overbought and oversold conditions. They are constructed around the moving average (SMA) of the WVF value using standard deviation (SD).
Ranges based on percentiles help identify extreme levels of WVF values to spot entry and exit points.
Buy and sell signals are generated when the WVF crosses the Bollinger Bands lines or reaches the ranges based on percentiles.
Adjustable Parameters:
LookBack Period Standard Deviation High (pd): The lookback period for calculating the highest closing price.
Bolinger Band Length (bbl): The length of the period for constructing the Bollinger Bands.
Bollinger Band Standard Devaition Up (mult): The multiplier for the standard deviation used for the upper Bollinger Band.
Look Back Period Percentile High (lb): The lookback period for calculating maximum and minimum WVF values.
Highest Percentile (ph): The percentile threshold for determining the high level.
Lowest Percentile (pl): The percentile threshold for determining the low level.
Show High Range (hp): Option to display the range based on percentiles.
Show Standard Deviation Line (sd): Option to display the standard deviation line.
Signals:
Buy Signal: Generated when the WVF crosses above the lower Bollinger Band or falls below the lower boundary of the percentile-based range.
Sell Signal: Generated when the WVF crosses below the upper Bollinger Band or rises above the upper boundary of the percentile-based range.
These signals are displayed as triangles below or above the candles respectively.
Application:
The script can be used by traders to analyze market conditions and make buying or selling decisions based on volatility and price behavior.

Dashboard MTF profile volume Indicator Description
This indicator, titled "Swing Points and Liquidity & Profile Volume," combines multiple features to provide a comprehensive market analysis:
Volume Profile: Displays buy and sell volumes across multiple timeframes (1 minute, 5 minutes, 15 minutes, 1 hour, 4 hours, 1 day).
Volume Moving Averages: Plots two moving averages (short and long) to analyze volume trends.
Dashboard: A summary dashboard shows buy and sell volumes for each timeframe, with distinct colors for better visualization.
Swing Points: Identifies liquidity levels and swing points to help pinpoint key entry and exit zones.
How to Use
1. Indicator Installation
Go to TradingView.
Open the Pine Script Editor.
Copy and paste the provided code.
Click on "Add to Chart."
2. Indicator Settings
The indicator offers several customizable parameters:
Display Volume (1 minute, 5 minutes, 15 minutes, 1 hour, 4 hours, 1 day): Enable or disable volume display for each timeframe.
Short Moving Average Length (MA): Set the short moving average period (default: 5).
Long Moving Average Length (MA): Set the long moving average period (default: 14).
Dashboard Position: Choose where to display the dashboard (bottom-right, bottom-left, top-right, top-left).
Text Color: Customize the text color in the dashboard.
Text Size: Choose text size (small, normal, large).
3. Using the Indicator
Volume Analysis
The dashboard displays buy (Buy Volume) and sell (Sell Volume) volumes for each timeframe.
Buy Volume: Volume of trades where the closing price is higher than the opening price (aggressive buying).
Sell Volume: Volume of trades where the closing price is equal to or lower than the opening price (aggressive selling).
Volumes are displayed in real-time and update with each new candle.
Volume Moving Averages
Two moving averages are plotted on the chart:
MA Volume (Short): Short moving average (blue) to identify short-term volume trends.
MA Volume (Long): Long moving average (red) to identify long-term volume trends.
Use these moving averages to spot accumulation or distribution periods.
Swing Points and Liquidity
Swing points are identified based on price levels where volumes are highest.
These levels can act as support/resistance zones or liquidity areas to plan entries and exits.
Usage Guidelines
1. Entering a Position
Buy (Long):
When Buy Volume is significantly higher than Sell Volume across multiple timeframes.
When the short moving average (blue) crosses above the long moving average (red).
Sell (Short):
When Sell Volume is significantly higher than Buy Volume across multiple timeframes.
When the short moving average (blue) crosses below the long moving average (red).
2. Exiting a Position
Use liquidity levels (swing points) to set profit targets or stop-loss levels.
Monitor volume changes to anticipate trend reversals.
3. Risk Management
Use stop-loss orders to limit losses.
Avoid trading during low-volume periods to reduce false signals.
Compliance with Trading View Guidelines
Intellectual Property:
The code is provided for educational and personal use. You may modify and use it but cannot resell or distribute it as your own work.
Responsible Use:
Trading View encourages responsible use of indicators. Test the indicator on a demo account before using it in live trading.
Transparency:
The code is fully transparent and can be reviewed in the Pine Script Editor. You may modify it to suit your needs.
Practical Examples
Scenario 1: Bullish Trend
Buy Volume is high on 1-hour and 4-hour time frames.
The short moving average (blue) is above the long moving average (red).
Action: Open a long position (Buy) and set a stop-loss below the last swing low.
Scenario 2: Bearish Trend
Sell Volume is high on 1-hour and 4-hour time frames.
The short moving average (blue) is below the long moving average (red).
Action: Open a short position (Sell) and set a stop-loss above the last swing high.

P/L CalculatorDescription of the P/L Calculator Indicator
The P/L Calculator is a dynamic TradingView indicator designed to provide traders with real-time insights into profit and loss metrics for their trades. It visualizes key levels such as entry price, profit target, and stop-loss, while also calculating percentage differences and net profit or loss, factoring in fees.
Features:
Customizable Input Parameters:
Entry Price: Define the starting price of the trade.
Profit and Stop-Loss Levels (%): Set percentage thresholds for targets and risk levels.
USDT Amount: Specify the trade size for precise calculations.
Trade Type: Choose between "Long" or "Short" positions.
Visual Representation:
Entry Price, Profit Target, and Stop-Loss levels are plotted as horizontal lines on the chart.
Line styles, colors, and thicknesses are fully customizable for better visibility.
Real-Time Metrics:
Percentage difference between the live price and the entry price is calculated dynamically.
Profit/Loss (P/L) and fees are computed in real time to display net profit or loss.
Alerts:
Alerts are triggered when:
The live price hits the profit target.
The live price crosses the stop-loss level.
The price reaches the specified entry level.
A user-defined percentage difference is reached.
Labels and Annotations:
Displays percentage difference, P/L, and fee information in a clear label near the live price.
Custom Fee Integration:
Allows input of trading fees (%), enabling accurate net profit or loss calculations.
Price Scale Visualization:
Displays the percentage difference on the price scale for enhanced context.
Use Case:
The P/L Calculator is ideal for traders who want to monitor their trades' performance and make informed decisions without manually calculating metrics. Its visual cues and alerts ensure you stay updated on critical levels and price movements.
This indicator supports a wide range of trading styles, including swing trading, scalping, and position trading, making it a versatile tool for anyone in the market.

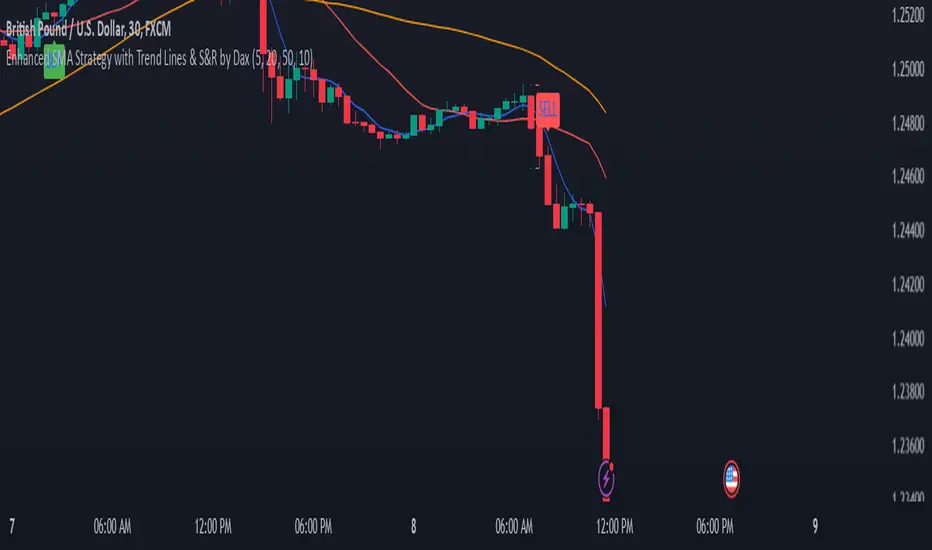
Enhanced SMA Strategy with Trend Lines & S&R by DaxThe Enhanced SMA Strategy with Trend Lines & Support/Resistance (S&R) by Dax indicator is a technical analysis tool designed to improve trading decisions by combining the simplicity of the Simple Moving Average (SMA) with the insight provided by trend lines and support/resistance levels. This hybrid approach aims to create a more robust and reliable trading strategy.
Key Components:
Simple Moving Average (SMA):
SMA is a basic trend-following indicator that calculates the average of a set of price data over a specified period. It helps identify the direction of the market, such as whether an asset is in an uptrend or downtrend.
The Enhanced SMA Strategy may use multiple SMAs, such as short-term (e.g., 20-period) and long-term (e.g., 50-period), to detect crossovers that signal buy or sell opportunities. For example, a bullish crossover occurs when a short-term SMA crosses above a long-term SMA, indicating a potential buying signal, while a bearish crossover signals a potential sell.
Trend Lines:
Trend lines are drawn on the price chart to visually identify the direction of the market, acting as dynamic support and resistance levels. A trend line is drawn by connecting two or more price points that demonstrate the overall price movement.
Trend lines can help traders see potential breakout or breakdown points. A price breaking above a downtrend line or below an uptrend line often signals a trend reversal.
Support and Resistance (S&R):
Support levels are price levels where an asset tends to find buying interest and stop falling, while Resistance levels are points where selling pressure emerges and prevent the price from rising further.
These levels are critical in determining where price reversals or consolidations are likely to occur. Enhanced S&R indicators can automatically identify these levels and draw horizontal lines at these critical points on the chart.
Combining S&R with SMA can help traders decide whether a breakout or bounce is likely at these levels, increasing the odds of a successful trade.
How It Works:
Trend Identification: The SMA is used to determine the trend direction. A rising SMA indicates an uptrend, while a falling SMA suggests a downtrend.
Signal Generation: The strategy often uses a combination of SMA crossovers (bullish or bearish) along with the confirmation of price action near trend lines and support/resistance levels. For example:
If a price breaks above resistance and the short-term SMA crosses above the long-term SMA, a buy signal is confirmed.
Conversely, if the price breaks below support and the short-term SMA crosses below the long-term SMA, a sell signal is given.
Dynamic Support/Resistance: Trend lines are drawn automatically or manually to spot areas where price might reverse. The Enhanced SMA Strategy checks if the price is close to these levels, providing a more precise entry/exit point based on the broader market context.
Advantages of the Enhanced SMA Strategy with Trend Lines & S&R:
Improved Accuracy: By combining trend-following (SMA) with key levels like trend lines and S&R, the strategy filters out false signals, leading to more reliable trade setups.
Trend Confirmation: The use of trend lines and S&R confirms the broader market context, reducing the risk of trading against the trend or entering at weak price points.
Flexible: This strategy can be applied to various timeframes, from short-term day trading to longer-term swing trading.
Visual Clarity: The combination of trend lines, S&R, and moving averages provides a clear and visually intuitive strategy for identifying key price levels and trend shifts.
How to Use It:
Draw Trend Lines: Identify the most recent price peaks and troughs to draw trend lines, marking the potential resistance and support levels.
Use SMAs: Apply two different-period SMAs to detect the trend (e.g., 20-period and 50-period). Pay attention to crossovers for buy/sell signals.
Watch for Breakouts or Reversals: Monitor how the price behaves at support or resistance levels and the trend lines. A price move beyond these levels, accompanied by a confirming SMA crossover, can signal a strong trade opportunity.
Conclusion:
The Enhanced SMA Strategy with Trend Lines & S&R by Dax is a powerful, multi-layered approach to technical analysis. It enhances the basic SMA strategy by incorporating additional tools like trend lines and support/resistance levels, which help traders make more informed decisions with higher accuracy. This method is suitable for both novice and experienced traders, offering clear trade signals while reducing the risk of false entries.
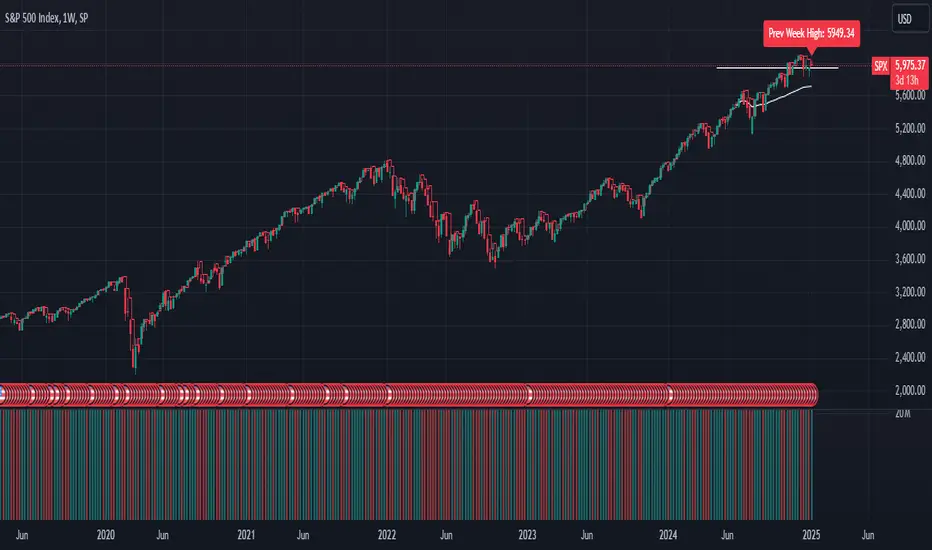
GL_Prev Week HighThe GL_Prev Week High Indicator is a powerful tool designed to enhance your trading analysis by displaying the previous week's high price directly on your chart. With clear and customizable visuals, this indicator helps traders quickly identify critical price levels, enabling more informed decision-making.
Key Features:
Previous Week's High Line:
Displays the previous week's high as a red line on your chart for easy reference.
Customizable Horizontal Line:
Includes a white horizontal line for enhanced clarity, with adjustable length, color, and width settings.
All-Time High Tracking:
Automatically tracks the all-time high from the chart's history and places a dynamic label above it.
Real-Time Updates:
The indicator updates in real-time to ensure accuracy as new bars are added.
User Inputs for Personalization:
Adjust the left and right span of the horizontal line.
Customize line width and color to suit your preferences.
Use Case:
This indicator is ideal for traders looking to integrate the previous week's high as a key support or resistance level in their trading strategy. Whether you are analyzing trends, identifying breakout zones, or planning entry/exit points, this tool provides valuable insights directly on the chart.
How to Use:
Add the indicator to your chart.
Customize the settings (line length, width, and color) through the input panel to match your preferences.
Use the red line to track the previous week's high and the label to monitor all-time highs effortlessly.
License:
This script is shared under the Mozilla Public License 2.0. Feel free to use and adapt the script as per the license terms.
HTF Hi-Lo Zones [CHE]HTF Hi-Lo Zones Indicator
The HTF Hi-Lo Zones Indicator is a Pine Script tool designed to highlight important high and low values from a selected higher timeframe. It provides traders with clear visual zones where price activity has reached significant points, helping in decision-making by identifying potential support and resistance levels. This indicator is customizable, allowing users to select the resolution type, control the visualization of session ranges, and even display detailed information about the chosen timeframe.
Key Functionalities
1. Timeframe Resolution Selection:
- The indicator offers three modes to determine the resolution:
- Automatic: Dynamically calculates the higher timeframe based on the current chart's resolution.
- Multiplier: Allows users to apply a multiplier to the current chart's timeframe.
- Manual: Enables manual input for custom resolution settings.
- Each resolution type ensures flexibility to suit different trading styles and strategies.
2. Data Fetching for High and Low Values:
- The indicator retrieves the current high and low values for the selected higher timeframe using `request.security`.
- It also calculates the lowest and highest values over a configurable lookback period, providing insights into significant price movements within the chosen timeframe.
3. Session High and Low Detection:
- The indicator detects whether the current value represents a new session high or low by comparing the highest and lowest values with the current data.
- This is crucial for identifying breakouts or significant turning points during a session.
4. Visual Representation:
- When a new session high or low is detected:
- Range Zones: A colored box marks the session's high-to-low range.
- Labels: Optional labels indicate "New High" or "New Low" for clarity.
- Users can customize colors, transparency, and whether range outlines or labels should be displayed.
5. Information Box:
- An optional dashboard displays details about the chosen timeframe resolution and current session activity.
- The box's size, position, and colors are fully customizable.
6. Session Tracking:
- Tracks session boundaries, updating the visualization dynamically as the session progresses.
- Displays session-specific maximum and minimum values if enabled.
7. Additional Features:
- Configurable dividers for session or daily boundaries.
- Transparency and styling options for the displayed zones.
- A dashboard for advanced visualization and information overlay.
Key Code Sections Explained
1. Resolution Determination:
- Depending on the user's input (Auto, Multiplier, or Manual), the script determines the appropriate timeframe resolution for higher timeframe analysis.
- The resolution adapts dynamically based on intraday, daily, or higher-period charts.
2. Fetching Security Data:
- Using the `getSecurityDataFunction`, the script fetches high and low values for the chosen timeframe, including historical and real-time data management to avoid repainting issues.
3. Session High/Low Logic:
- By comparing the highest and lowest values over a lookback period, the script identifies whether the current value is a new session high or low, updating session boundaries and initiating visual indicators.
4. Visualization:
- The script creates visual representations using `box.new` for range zones and `label.new` for session labels.
- These elements update dynamically to reflect the most recent data.
5. Customization Options:
- Users can configure the appearance, behavior, and displayed data through multiple input options, ensuring adaptability to individual trading preferences.
This indicator is a robust tool for tracking higher timeframe activity, offering a blend of automation, customization, and visual clarity to enhance trading strategies.
Disclaimer
The content provided, including all code and materials, is strictly for educational and informational purposes only. It is not intended as, and should not be interpreted as, financial advice, a recommendation to buy or sell any financial instrument, or an offer of any financial product or service. All strategies, tools, and examples discussed are provided for illustrative purposes to demonstrate coding techniques and the functionality of Pine Script within a trading context.
Any results from strategies or tools provided are hypothetical, and past performance is not indicative of future results. Trading and investing involve high risk, including the potential loss of principal, and may not be suitable for all individuals. Before making any trading decisions, please consult with a qualified financial professional to understand the risks involved.
By using this script, you acknowledge and agree that any trading decisions are made solely at your discretion and risk.
Best regards and happy trading
Chervolino

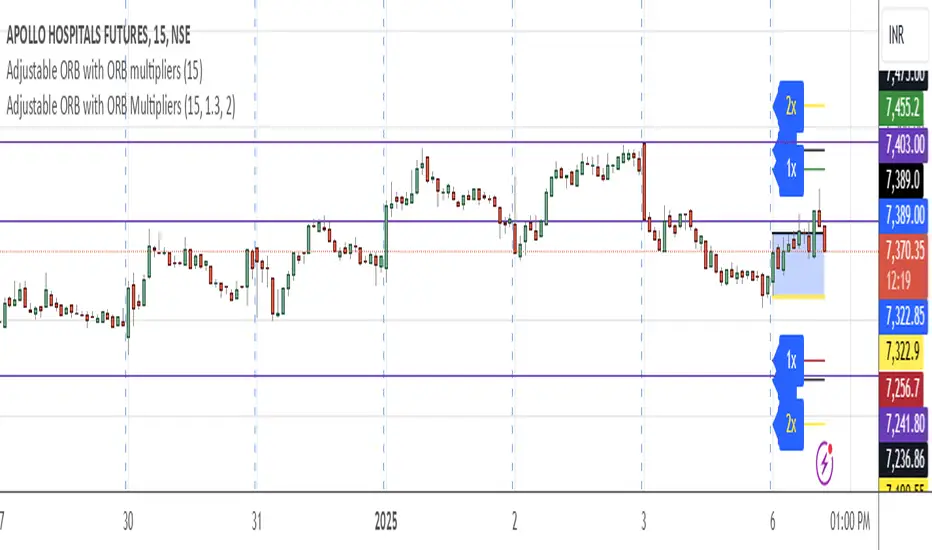
Adjustable ORB with ORB Multipliers 1x or 2x by dhaval chhayaniKey Features:
Adjustable Timeframe:
The ORB is calculated using a user-defined timeframe, which defaults to 15 minutes.
Dynamic High/Low Levels:
Identifies the high and low of the first bar of the specified timeframe for each trading day.
Resets these levels at the start of each new day.
Multipliers for Breakout Levels:
Calculates breakout levels using 1.3x and 2x the ORB range, both above and below the opening range.
Displays these levels on the chart with user-controlled visibility.
Labels for Breakout Levels:
Adds labels (1x, 2x) at the breakout levels for better visualization.
Dynamically updates or removes labels based on current conditions.
Visual Representation:
The opening range (high and low) is plotted with blue lines and filled with a shaded area for clarity.
Breakout levels are plotted in white and yellow, representing the respective multipliers.
Day-Specific Logic:
Ensures the indicator only operates for the current day and clears data for previous or upcoming days.
OBV TSI IndicatorThe OBV TSI Indicator combines two powerful technical analysis tools: the On-Balance Volume (OBV) and the True Strength Index (TSI). This hybrid approach provides insights into both volume dynamics and momentum, helping traders identify potential trend reversals, breakouts, or continuations with greater accuracy.
The OBV TSI Indicator tracks cumulative volume shifts via OBV and integrates the TSI for momentum analysis. It offers customizable moving average options for further smoothing. Visual trendlines, pivot points, and signal markers enhance clarity.
The OBV tracks volume flow by summing volumes based on price changes. Positive volume is added when prices rise, and negative volume is subtracted when prices fall. The result is smoothed to detect meaningful trends in volume. A volume spread is derived from the difference between the smoothed OBV and cumulative volume. This is then adjusted by the price deviation to generate the shadow spread, which highlights critical volume-driven price levels.
The shadow spread is added to either the high or low price, depending on its sign, producing a refined OBV output. This serves as the main source for the subsequent TSI calculation. The TSI is a momentum oscillator calculated using double-smoothed price changes. It provides an accurate measure of trend strength and direction.
Various moving average options, such as EMA, DEMA, or TEMA, are applied to the smoothed OBV for additional trend filtering. Users can select their preferred type and length to suit their trading strategy. Trendlines are plotted to visualize the overall direction. When a significant change in trend is detected, up or down arrows indicate potential buy or sell signals. The script identifies key pivot points based on the highest and lowest levels within a defined period. These pivots help pinpoint reversal zones.
The indicator offers customization options, allowing users to adjust the OBV length for smoothing, choose from various moving average types, and fine-tune the short, long, and signal periods for TSI. Additionally, users can toggle visibility for trendlines, signals, and pivots to suit their preferences.
This indicator is ideal for practical use cases such as spotting potential trend reversals by observing TSI crossovers and pivot levels, anticipating breakouts from key price levels using the shadow spread, and validating trends by aligning TSI signals with OBV and moving averages.
The OBV TSI Indicator is a versatile tool designed to enhance decision-making in trading by combining volume and momentum analysis. Its flexibility and visual aids make it suitable for traders of all experience levels. By leveraging its insights, you can confidently navigate market trends and improve your trading outcomes.

Economic RegimeThis indicator, "Economic Regime" , provides a comprehensive analysis of market conditions by combining multiple asset classes and financial metrics. It uses normalized scores and trend analysis to classify the current economic regime into one of four categories: Goldilocks, Reflation, Inflation, or Deflation. The classification is based on inputs like S&P 500 performance, bond yields, commodity prices, volatility indices, and sector ETFs. Additionally, it plots key financial spreads, including the yield spread (10Y-2Y) and credit spread (HYG-LQD), to offer deeper insights into liquidity and market sentiment. The background color dynamically reflects the identified economic regime, facilitating quick visual interpretation.

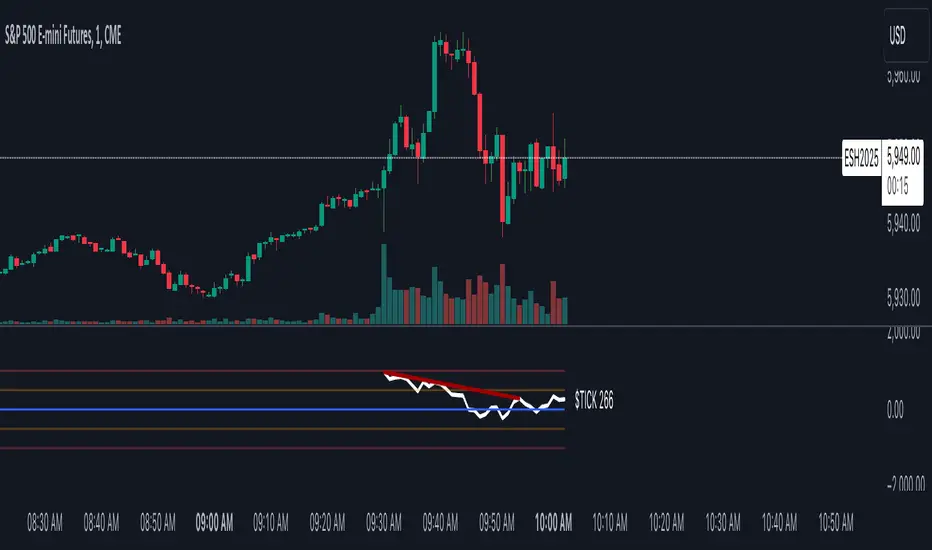
TICK Charting & DivergencesOverview
The TICK index measures the number of NYSE stocks making an uptick versus a downtick. This indicator identifies divergences between price action and TICK readings, potentially signaling trend reversals.
Key Features
Real-time TICK monitoring during market hours (9:30 AM - 4:00 PM ET)
Customizable smoothing factor for TICK values
Regular and hidden divergences detection
Reference lines at ±500 and ±1000 levels
Current TICK value display
TICK Internals Interpretation
Above +1000: Strong buying pressure, potential exhaustion
Above +500: Moderate buying pressure
Below -500: Moderate selling pressure
Below -1000: Strong selling pressure, potential exhaustion
Best Practices
Use in conjunction with support/resistance levels, market trend direction, and time of day.
Higher probability setups with multiple timeframe confirmation, divergence at key price levels, and extreme TICK readings (±1000).
Settings Optimization
Smoothing Factor: 1-3 (lower for faster signals)
Pivot Lookback: 5-10 bars (adjust based on timeframe)
Range: 5-60 bars (wider for longer-term signals)
Warning Signs
Multiple failed divergences
Choppy price action
Low volume periods
Major news events pending
Remember: TICK divergences are not guaranteed signals. Always use proper risk management and combine with other technical analysis tools.
MA Distance with StdDev BandsThis Pine Script indicator calculates and visualizes the percentage deviation from a moving average with dynamic standard deviation bands. Here's what it does:
Key Features
Calculates the percentage difference between current price and a user-selected moving average (SMA, EMA, or VWMA)
Computes standard deviation bands using the entire historical dataset
Displays dynamic color changes based on price movement and band positions
Visual Components
Main line: Shows percentage deviation from the moving average
Dashed bands: Upper and lower standard deviation boundaries
Zero line: Reference for neutral position
Color signals:
Red: Price outside standard deviation bands
Green: Above MA and rising
Orange: Below MA but rising
Blue: Other conditions

Binary Options Pro Helper By Himanshu AgnihotryThe Binary Options Pro Helper is a custom indicator designed specifically for one-minute binary options trading. This tool combines technical analysis methods like moving averages, RSI, Bollinger Bands, and pattern recognition to provide precise Buy and Sell signals. It also includes a time-based filter to ensure trades are executed only during optimal market conditions.
Features:
Moving Averages (EMA):
Uses short-term (7-period) and long-term (21-period) EMA crossovers for trend detection.
RSI-Based Signals:
Identifies overbought/oversold conditions for entry points.
Bollinger Bands:
Highlights market volatility and potential reversal zones.
Chart Pattern Recognition:
Detects double tops (sell signals) and double bottoms (buy signals).
Time-Based Filter:
Trades only within specified hours (e.g., 9:30 AM to 11:30 AM) to avoid unnecessary noise.
Visual Signals:
Plots buy and sell markers directly on the chart for ease of use.
How to Use:
Setup:
Add this script to your TradingView chart and select a 1-minute timeframe.
Signal Interpretation:
Buy Signal: Triggered when EMA crossover occurs, RSI is oversold (<30), and a double bottom pattern is detected.
Sell Signal: Triggered when EMA crossover occurs, RSI is overbought (>70), and a double top pattern is detected.
Timing:
Ensure trades are executed only during the specified time window for better accuracy.
Best Practices:
Use this indicator alongside fundamental analysis or market sentiment.
Test it thoroughly with historical data (backtesting) and in a demo account before live trading.
Adjust parameters (e.g., EMA periods, RSI thresholds) based on your trading style.

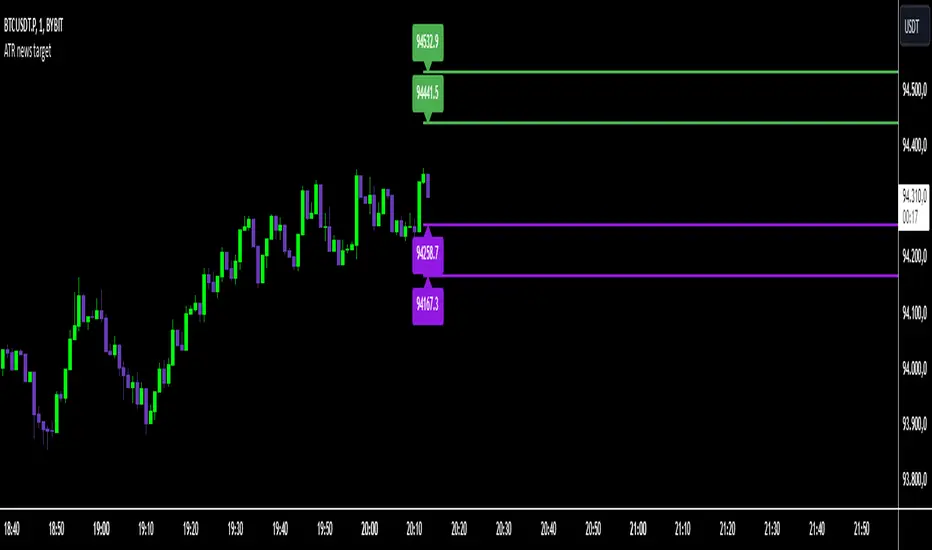
ATR news targetThis indicator is based on the calculation of the ATR and the use of multipliers to define specific price levels. It is crucial that it is fixed to the price axis.
During periods of high volatility, such as during the release of macroeconomic data, it is essential to understand the magnitude of price movements.
By multiplying the ATR (customizable period) by specific multipliers (customizable variables), exit targets (stop loss and take profit) are determined based on the current volatility, ensuring greater adaptability to the market.
The directionality will be determined by the news, but thanks to the indicator (calculated on the last closed candle), you will have the ability to precisely determine stop loss, take profit, and retracement points.
Pro Stock Scanner + MACD# Pro Stock Scanner - Advanced Trading System
### Professional Scanning System Combining MACD, Momentum & Technical Analysis
## 🎯 Indicator Purpose
This indicator was developed to identify high-quality trading opportunities by combining:
- Strong positive momentum
- Clear technical trend
- Significant trading volume
- Precise MACD signals
## 💡 Core Mechanics
The indicator is based on three core components:
### 1. Advanced MACD Analysis (40%)
- MACD line crossover tracking
- Momentum strength measurement
- Positive/negative divergence detection
- Score range: 0-40 points
### 2. Trend Analysis (40%)
- Moving average relationships (MA20, MA50)
- Primary trend direction
- Current trend strength
- Score range: 0-40 points
### 3. Volume Analysis (20%)
- Comparison with 20-day average volume
- Volume breakout detection
- Score range: 0-20 points
## 📊 Scoring System
Total score (0-100) composition:
```
Total Score = MACD Score (40%) + Trend Score (40%) + Volume Score (20%)
```
### Score Interpretation:
- 80-100: Strong Buy Signal 🔥
- 65-79: Developing Bullish Trend ⬆️
- 50-64: Neutral ↔️
- 0-49: Technical Weakness ⬇️
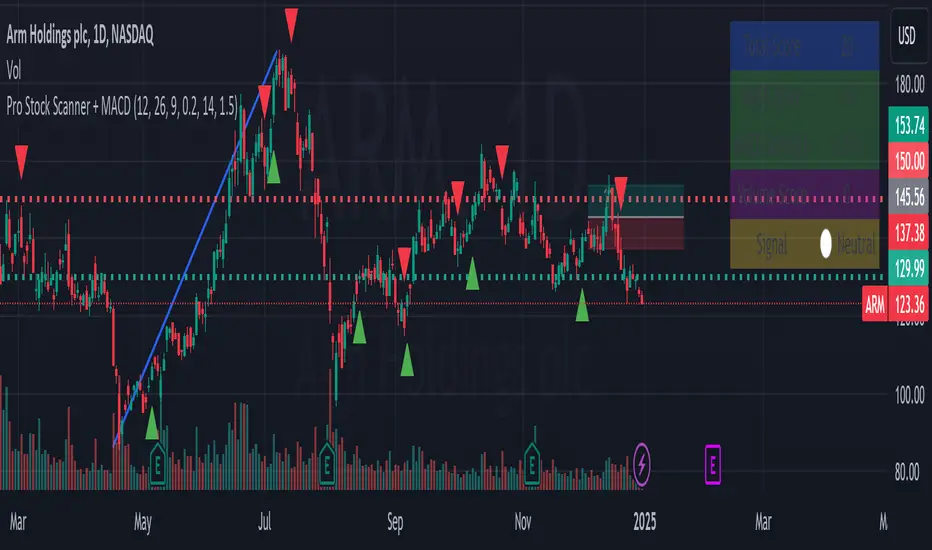
## 📈 Chart Markers
1. **Large Blue Triangle**
- High score (80+)
- Positive MACD
- Bullish MACD crossover
2. **Small Triangles**
- Green: Bullish MACD crossover
- Red: Bearish MACD crossover
## 🎛️ Customizable Parameters
```
MACD Settings:
- Fast Length: 12
- Slow Length: 26
- Signal Length: 9
- Strength Threshold: 0.2%
Volume Settings:
- Threshold: 1.5x average
```
## 📱 Information Panel
Real-time display of:
1. Total Score
2. MACD Score
3. MACD Strength
4. Volume Score
5. Summary Signal
## ⚙️ Optimization Guidelines
Recommended adjustments:
1. **Bull Market**
- Decrease MACD sensitivity
- Increase volume threshold
- Focus on trend strength
2. **Bear Market**
- Increase MACD sensitivity
- Stricter trend conditions
- Higher score requirements
## 🎯 Recommended Trading Strategy
### Phase 1: Initial Scan
1. Look for 80+ total score
2. Verify sufficient trading volume
3. Confirm bullish MACD crossover
### Phase 2: Validation
1. Check long-term trend
2. Identify nearby resistance levels
3. Review earnings calendar
### Phase 3: Position Management
1. Set clear stop-loss
2. Define realistic profit targets
3. Monitor score changes
## ⚠️ Important Notes
1. This indicator is a supplementary tool
2. Combine with fundamental analysis
3. Strict risk management is essential
4. Not recommended for automated trading
## 📈 Usage Examples
Examples included:
1. Successful buy signal
2. Trend reversal identification
3. False signal analysis and lessons learned
## 🔄 Future Updates
1. RSI integration
2. Advanced alerts
3. Auto-optimization features
## 🎯 Key Benefits
1. Clear scoring system
2. Multiple confirmation layers
3. Real-time market feedback
4. Customizable parameters
## 🚀 Getting Started
1. Add indicator to chart
2. Adjust parameters if needed
3. Monitor information panel
4. Wait for strong signals (80+ score)
## 📊 Performance Metrics
- Success rate: Monitor and track
- Best performing in trending markets
- Optimal for swing trading
- Most effective on daily timeframe
## 🛠️ Technical Details
```pine
// Core components
1. MACD calculation
2. Volume analysis
3. Trend confirmation
4. Score computation
```
## 💡 Pro Tips
1. Use multiple timeframes
2. Combine with support/resistance
3. Monitor sector trends
4. Consider market conditions
## 🤝 Support
Feedback and improvement suggestions welcome!
## 📜 License
MIT License - Free to use and modify
## 📚 Additional Resources
- Recommended timeframes: Daily, 4H
- Best performing markets: Stocks, ETFs
- Optimal market conditions: Trending markets
- Risk management guidelines included
## 🔍 Final Notes
Remember:
- No indicator is 100% accurate
- Always use proper position sizing
- Combine with other analysis tools
- Practice proper risk management
// @version=5
// @description Pro Stock Scanner - Advanced trading system combining MACD, momentum and volume analysis
// @author AviPro
// @license MIT
//
// This indicator helps identify high-quality trading opportunities by analyzing:
// 1. MACD momentum and crossovers
// 2. Trend strength and direction
// 3. Volume patterns and breakouts
//
// The system provides:
// - Total score (0-100)
// - Visual signals on chart
// - Information panel with key metrics
// - Customizable parameters
//
// IMPORTANT: This indicator is for educational and informational purposes only.
// Always conduct your own analysis and use proper risk management.
//
// If you find this indicator helpful, please consider leaving a like and comment!
// Feedback and suggestions for improvement are always welcome.
GapAura: Dynamic Gap [AstroHub]GapAura is a powerful indicator designed to analyze and visualize price gaps on your charts. It focuses on the key levels created by gaps between the open of the current day and the close of the previous day. The indicator connects these gap levels with trend-like lines, allowing traders to easily identify significant price movements and potential turning points in the market.
GapCloud automatically differentiates between upward and downward gaps, helping traders visualize important support and resistance levels that emerge following these gaps. The lines representing these gaps behave like trend lines, providing clear and actionable insights for market analysis. Unlike traditional gap indicators, GapCloud offers a dynamic approach to gap visualization, making it easier for traders to assess the impact of price gaps on future market movement.
How to Use:
Gap Up: When the open of the current day is higher than the close of the previous day, GapCloud draws a line connecting these two levels. This visualizes the gap upward and helps identify the trend direction, as well as potential support zones.
Gap Down: When the open of the current day is lower than the close of the previous day, the indicator draws a line that connects these levels, showing a downward gap. This can highlight potential resistance levels.
The lines for each gap are connected to form continuous trend-like levels, giving traders a clear picture of market structure. These lines can also be used to identify areas of strong support or resistance, and potential turning points where the price may reverse or continue in the same direction.
What Makes This Indicator Unique:
GapCloud stands out by transforming gaps into trend-like lines, offering more than just a simple visualization of the gap itself. By connecting the open and close levels of the current and previous day, it allows traders to see how these price differences can act as significant support or resistance levels. These lines help traders spot market trends and potential reversals more clearly, giving them an edge in making more informed trading decisions.
The ability to visualize gaps as trend lines gives traders a unique advantage in understanding market behavior. Gaps are not just seen as isolated events; they are integrated into the overall market structure and can provide critical insights into the potential price direction.
In addition to this, GapCloud offers a high degree of customization. Users can adjust the thickness, style, and color of the gap lines to fit their trading preferences and style. This makes the indicator adaptable to various types of trading strategies, from short-term to long-term analysis.
Key Features:
Identifies and visualizes gaps between the open of the current day and the close of the previous day.
Converts gap levels into trend-like lines, providing clarity and actionable insights for traders.
Helps identify potential support and resistance levels based on gap locations.
Fully customizable settings, including line thickness, style, and color, to suit individual trading preferences.
Provides a dynamic approach to gap analysis, helping traders forecast market direction and potential reversals with greater accuracy.
GapCloud is an essential tool for any trader looking to enhance their market analysis. By visualizing price gaps as connected trend lines, it simplifies the process of identifying key levels and market structure, giving traders an edge in understanding price movements and making more informed decisions.

OBV Divergence Indicator [TradingFinder] On-Balance Vol Reversal🔵 Introduction
The On-Balance Volume (OBV) indicator, introduced by Joe Granville in 1963, is a powerful technical analysis tool used to measure buying and selling pressure based on trading volume and price.
By aggregating trading volume—adding it on positive days and subtracting it on negative days—OBV creates a cumulative line that reflects market volume pressure, making it valuable for confirming trends, identifying entry and exit points, and forecasting potential price movements.
Divergences between price and OBV often provide significant signals. A bearish divergence occurs when the price forms higher highs while the OBV line forms lower highs. This discrepancy indicates that upward momentum is weakening, increasing the likelihood of a downward trend.
In contrast, a bullish divergence happens when the price makes lower lows, but the OBV line forms higher lows. This suggests increasing buying pressure and the potential for an upward trend reversal.
For instance, if the price is rising but the OBV trendline is falling, it may signal a bearish divergence, warning of a possible price decline. Conversely, if the price is falling while the OBV line is rising, this could signal a bullish divergence, indicating a possible price recovery. These signals are particularly useful for identifying market turning points.
OBV often acts as a leading indicator, moving ahead of price changes. For example, a rising OBV alongside stable or declining prices can signal an impending upward breakout.
Conversely, a declining OBV with rising prices may indicate that the current uptrend is losing strength. Traders using this strategy often consider entering positions at breakout levels while setting stop losses near recent swing highs or lows to manage risk effectively.
This integration highlights how OBV divergences can provide actionable insights for predicting price movements and managing trades efficiently.
Bullish Divergence :
Bearish Divergence :
🔵 How to Use
The OBV indicator, as a cumulative tool, assists analysts in comparing volume and price changes to identify new trends and key levels for entering or exiting trades. Beyond confirming existing trends, it is particularly effective in analyzing positive and negative divergences between price and volume, providing valuable signals for trading decisions.
🟣 Bullish Divergence
A bullish divergence occurs when the price continues its downward or stable trend, but the OBV line starts rising, forming a higher low compared to its previous low. This suggests increasing volume on up days relative to down days and often signals a reversal to the upside.
For instance, if an asset's price stabilizes near a support level but the OBV line shows an upward trend, this divergence could present an opportunity to enter a long position.
🟣 Bearish Divergence
A bearish divergence occurs when the price forms higher highs, but the OBV line declines, creating lower highs compared to previous peaks. This indicates decreasing volume on up days relative to down days and often acts as a warning for a reversal to the downside.
For example, if an asset’s price approaches a resistance level while OBV starts declining, this divergence may signal the beginning of a downtrend and could indicate a good time to exit long trades or enter short positions.
🔵 Setting
Period : The "Period" setting allows you to define the number of bars or intervals for "Periodic" and "EMA" modes. A shorter period captures more short-term movements, while a longer period smooths out the fluctuations and provides a broader view of market trends.
You can enable or disable labels to highlight key levels or divergences and tables to show numerical details like values and divergence types. These options allow for a customized chart display.
🔵 Table
The following table breaks down the main features of the oscillator. It covers four critical categories: Exist, Consecutive, Divergence Quality, and Change Phase Indicator.
Exist : If divergence is detected, a "+" will appear in this row.
Consecutive: Shows the number of consecutive divergences that have formed in a short period.
Divergence Quality : Evaluates the quality of the divergence based on the number of occurrences. One is labeled "Normal," two are "Good," and three or more are considered "Strong."
Change Phase Indicator : If a phase change is detected between two oscillation peaks, this is marked in the table.
🔵 Conclusion
The OBV (On Balance Volume) indicator is a simple yet effective tool in technical analysis that combines volume and price changes to provide a comprehensive view of market buying and selling pressure. By identifying positive and negative divergences, OBV enables analysts to detect early signs of trend reversals and refine their trading strategies.
Divergences in OBV often precede price changes, making it a leading indicator for predicting market movements. Using OBV alongside other technical tools can enhance decision-making accuracy and help traders identify better entry and exit points. However, it is essential to consider the limitations of OBV, such as the potential for signal errors and the impact of sudden news events.
Ultimately, OBV serves as a complementary tool in technical analysis, aiding in trend identification, signal confirmation, and risk management. A thoughtful application of this indicator, in combination with other analytical tools, can create valuable opportunities for profiting in financial markets.

Exponential Avg Body Size Green vs RedDescription :
This indicator calculates and plots the Exponential Moving Average (EMA) of green and red candlestick body sizes, allowing traders to easily visualize market momentum and sentiment shifts. The script includes the following features:
Customizable EMA Period: Users can set the number of candles to calculate the EMA through an input setting, with a default value of 21.
Separate Green and Red Candle Averages: Differentiates between bullish (green) and bearish (red) candlestick movements, plotting them as distinct lines.
Dynamic Range Control: Users can adjust the chart range (e.g., -50 to 50) for better visibility of the plotted lines.
Baseline for Reference: A horizontal baseline at 0 serves as a visual aid for easier interpretation.
Standalone Indicator Pane: The script is designed to display in a separate pane, preventing overlap with the price chart.
Use Case:
This indicator is ideal for traders seeking to analyze the relative strength of bullish versus bearish price movements over a specific period. The separation of green and red averages helps identify trends, potential reversals, or shifts in momentum.

ROC with AveragesMain Idea
This script provides traders with a comprehensive view of market momentum by calculating the Rate of Change (ROC) and categorizing its impact into averages of positive, negative, and total values.
Key Features
Rate of Change (ROC) Calculation: Measures the percentage change in closing prices over a user-defined period.
Categorical Averages:
Positive Average: Average ROC for upward movements.
Negative Average: Average ROC for downward movements.
Total Average: Aggregate average across all movements.
Dynamic Visualization: Plots ROC alongside its categorized averages for better trend analysis.
Benefits
Simplifies the evaluation of market trends by breaking down data into actionable insights.
Helps traders identify the strength of upward or downward movements.
Offers a clear visual representation for quick decision-making.
This structure highlights the purpose and value of the script while aligning with the Minto Pyramid Principle. Let me know if you'd like further refinements!
الفكرة الرئيسية
يوفر هذا السكربت للمتداولين رؤية شاملة لزخم السوق من خلال حساب معدل التغير (ROC) وتصنيفه إلى متوسطات القيم الإيجابية والسلبية والإجمالية.
المميزات الرئيسية
حساب معدل التغير (ROC): يقيس النسبة المئوية للتغير في أسعار الإغلاق خلال فترة محددة يختارها المستخدم.
المتوسطات التصنيفية:
المتوسط الإيجابي: متوسط معدل التغير للحركات الصعودية.
المتوسط السلبي: متوسط معدل التغير للحركات الهبوطية.
المتوسط الإجمالي: متوسط إجمالي يشمل جميع الحركات.
تصور ديناميكي: يعرض معدل التغير إلى جانب المتوسطات المصنفة لتسهيل تحليل الاتجاهات.
الفوائد
يبسط تقييم اتجاهات السوق من خلال تقسيم البيانات إلى رؤى قابلة للتنفيذ.
يساعد المتداولين على تحديد قوة الحركات الصعودية أو الهبوطية.
يقدم تمثيلاً بصرياً واضحاً لاتخاذ قرارات سريعة ودقيقة.

MERCURY-PRO by DrAbhiramSivprasd“MERCURYPRO”
The MERCURYPRO indicator is a custom technical analysis tool designed to provide dynamic trend signals based on a combination of the Chande Momentum Oscillator (CMO) and Standard Deviation (StDev). This indicator helps traders identify trend reversals or continuation based on the behavior of the price and momentum.
Key Features:
• Source Input: The indicator works with any price data, with the default set to close, which represents the closing price of each bar.
• Length Input: A period (default value 9) is used to determine the calculation window for the Chande Momentum Oscillator and Standard Deviation.
• Fixed CMO Length Option: Users can choose whether to use a fixed CMO length of 9 or adjust the length to the user-defined pds value.
• Calculation Method: The indicator allows switching between using the Chande Momentum Oscillator (CMO) or Standard Deviation (StDev) for the momentum calculation.
• Alpha: The smoothing factor used in the calculation of the MERCURYPRO value, which is based on the length of the period input (pds).
Core Calculation:
1. Momentum Calculation: The script calculates the momentum by determining the change in the source price (e.g., close) from one period to the next.
2. Chande Momentum Oscillator (CMO): The positive and negative momentum components are calculated and then summed over the specified period. This value is normalized to a percentage to determine the momentum strength.
3. K Value Calculation: The script selects either the CMO or Standard Deviation (depending on the user setting) to calculate the k value, which represents the dynamic price momentum.
4. MERCURYPRO Line: The final output of the indicator, MERCURYPRO, is computed using a weighted average of the k value and the previous MERCURYPRO value. The line is smoothed using the Alpha parameter.
Plot and Signal Generation:
• Color Coding: The line is color-coded based on the direction of MERCURYPRO:
• Blue: The trend is bullish (MERCURYPRO is rising).
• Maroon: The trend is bearish (MERCURYPRO is falling).
• Default Blue: Neutral or sideways market conditions.
• Plotting: The MERCURYPRO line is plotted with varying colors depending on the trend direction.
Alerts:
• Color Change Alert: The indicator has an alert condition based on when the MERCURYPRO line crosses its previous value. This helps traders stay informed about potential trend reversals or continuation signals.
Use Case:
• Trend Confirmation: Traders can use the MERCURYPRO indicator to identify whether the market is in a strong trend or not.
• Signal for Entries/Exits: The color change and crossovers of the MERCURYPRO line can be used as entry or exit signals, depending on the trader’s strategy.
Overall Purpose:
The MERCURYPRO indicator combines momentum analysis with smoothing techniques to offer a dynamic, responsive tool for identifying market trends and potential reversals. It is particularly useful in conjunction with other technical indicators to provide confirmation for trade setups.
How to Use the MERCURYPRO Indicator:
The MERCURYPRO indicator is designed to help traders identify trend reversals and market conditions. Here are a few ways you can use it:
1. Trend Confirmation (Bullish or Bearish)
• Bullish Trend: When the MERCURYPRO line is colored Blue, it indicates a rising trend, suggesting that the market is bullish.
• Action: You can consider entering long positions when the line turns blue, or holding your existing positions if you’re already long.
• Bearish Trend: When the MERCURYPRO line is colored Maroon, it signals a downward trend, indicating a bearish market.
• Action: You may consider entering short positions or closing any long positions when the line turns maroon.
2. Trend Reversal Alerts
• Color Change: The MERCURYPRO indicator changes color when there’s a trend reversal. The alert condition triggers when the MERCURYPRO crosses above or below its previous value, signaling a potential shift in the trend.
• Action: You can use this alert as a signal to monitor potential entry or exit points for trades. For example, a crossover from maroon to blue could indicate a potential buying opportunity, while a crossover from blue to maroon could suggest a selling opportunity.
3. Use with Other Indicators for Confirmation
• While the MERCURYPRO provides valuable trend insights, it’s often more effective when used in combination with other indicators like RSI (Relative Strength Index), MACD, or moving averages to confirm signals.
• Example: If MERCURYPRO turns blue and RSI is above 50, it may signal a strong bullish trend, enhancing the confidence to enter a long trade.
4. Divergence
• Watch for divergence between the MERCURYPRO line and the price chart:
• Bullish Divergence: If the price makes new lows while MERCURYPRO is showing higher lows, it suggests a potential bullish reversal.
• Bearish Divergence: If the price makes new highs while MERCURYPRO is showing lower highs, it suggests a potential bearish reversal.
Example of Use:
• Example 1: If the MERCURYPRO line changes from maroon to blue, you might enter a long position. After the MERCURYPRO line turns blue, use an alert to monitor the price action. If other indicators (like RSI) also suggest strength, your confidence in the trade will increase.
• Example 2: If the MERCURYPRO line shifts from blue to maroon, it could be a signal to close long positions and consider shorting the market if other conditions align (e.g., moving averages also turn bearish).
Warning for Using the MERCURYPRO Indicator:
1. Lagging Indicator:
• The MERCURYPRO is a lagging indicator, meaning it responds to price changes after they have occurred. This may delay entry and exit signals, and it’s crucial to combine it with other leading indicators to get timely information.
2. False Signals in Range-bound Markets:
• In choppy or sideways markets, the MERCURYPRO line can produce false signals, flipping between blue and maroon frequently without showing a clear trend. It’s important to avoid trading based on these false signals when the market is not trending.
3. Overreliance on One Indicator:
• Relying solely on MERCURYPRO can be risky. Always confirm signals with additional tools like volume analysis, price action, or other indicators to increase the accuracy of your trades.
4. Market Conditions Matter:
• The indicator may work well in trending markets, but in highly volatile or news-driven environments, it may provide misleading signals. Ensure that you take market fundamentals and external news events into consideration before acting on the indicator’s signals.
5. Risk Management:
• As with any technical indicator, MERCURYPRO is not infallible. Always use appropriate risk management techniques such as stop-loss orders to protect your capital. Never risk more than you can afford to lose on a trade.
6. Backtest First:
• Before implementing MERCURYPRO in live trading, make sure to backtest it on historical data. Test the strategy with various market conditions to assess its effectiveness and identify any potential weaknesses.
By considering these guidelines and warnings, you can use the MERCURYPRO indicator more effectively and mitigate potential risks in your trading strategy.

Fair Value Gap DetectorHow this indicator works:
It detects two types of FVGs:
Bullish FVG: Occurs when the low of the current candle is higher than the high of the candle from 2 bars ago (creates an upward gap)
Bearish FVG: Occurs when the high of the current candle is lower than the low of the candle from 2 bars ago (creates a downward gap)
Features:
Allows users to toggle both bullish and bearish FVG detection independently
Customizable colors for both bullish (default green) and bearish (default red) FVGs
Visualizes FVGs using:
Boxes that highlight the gap area (with 80% transparency)
Labels that mark each FVG ("Bull FVG" or "Bear FVG")
Visual representation:
Bullish FVGs are marked with green boxes and downward-pointing labels
Bearish FVGs are marked with red boxes and upward-pointing labels
This indicator can be useful for :
Identifying potential areas where price might return to
Finding potential support and resistance zones
Understanding market structure and momentum shifts

[Linus] VWAO DeviationThe VWAP (Volume Weighted Average Price) Deviation Script is a sophisticated tool designed to help traders analyze the interplay between price and volume. By calculating deviations from the VWAP, it identifies critical support and resistance levels, enabling more informed trading decisions.
This script computes the VWAP based on a selected data source (defaulting to the closing price) and determines deviations above and below it using either the Average Deviation or Standard Deviation method. Users can customize their preference through the script's input settings. These deviations are visually plotted as bands on the chart, offering clear insights into areas where price may revert or break out.
A standout feature of the script is its Cross Count Monitor, which tracks how often the price crosses above the Upper Deviation Level 2 and below the Lower Deviation Level 2 within a user-defined lookback period. This data is displayed in a table at the bottom-right corner of the chart and can be toggled on or off via an input setting.
The Cross Count Monitor provides traders with valuable historical insights into the frequency of price interactions with deviation levels, helping to identify potential trading opportunities based on established price behaviors. This functionality makes the script an indispensable tool for traders seeking to enhance their market analysis and strategy development.
