Volume Delta Candles HTF [TradingFinder] LTF Volume Candles 🔵 Introduction
In financial markets, understanding the concepts of supply and demand and their impact on price movements is of paramount importance. Supply and demand, as fundamental pillars of economics, reflect the interaction between buyers and sellers.
When buyers' strength surpasses that of sellers, demand increases, and prices tend to rise. Conversely, when sellers dominate buyers, supply overtakes demand, causing prices to drop. These interactions play a crucial role in determining market trends, price reversal points, and trading decisions.
Volume Delta Candles offer traders a practical way to visualize trading activity within each candlestick. By integrating data from lower timeframes or live market feeds, these candles eliminate the need for standalone volume indicators.
They present the proportions of buying and selling volume as intuitive colored bars, making it easier to interpret market dynamics at a glance. Additionally, they encapsulate critical metrics like peak delta, lowest delta, and net delta, allowing traders to grasp the market's internal order flow with greater precision.
In financial markets, grasping the interplay between supply and demand and its influence on price movements is crucial for successful trading. These fundamental economic forces reflect the ongoing balance between buyers and sellers in the market.
When buyers exert greater strength than sellers, demand dominates, driving prices upward. Conversely, when sellers take control, supply surpasses demand, and prices decline. Understanding these dynamics is essential for identifying market trends, pinpointing reversal points, and making informed trading decisions.
Volume Delta Candles provide an innovative method for evaluating trading activity within individual candlesticks, offering a simplified view without relying on separate volume indicators. By leveraging lower timeframe or real-time data, this tool visualizes the distribution of buying and selling volumes within a candle through color-coded bars.
This visual representation enables traders to quickly assess market sentiment and understand the forces driving price action. Buyer and seller strength is a critical concept that focuses on the ratio of buying to selling volumes. This ratio not only provides insights into the market's current state but also serves as a leading indicator for detecting potential shifts in trends.
Traders often rely on volume analysis to identify significant supply and demand zones, guiding their entry and exit strategies. Delta Candles translate these complex metrics, such as Maximum Delta, Minimum Delta, and Final Delta, into an easy-to-read visual format using Japanese candlestick structures, making them an invaluable resource for analyzing order flows and market momentum.
By merging the principles of supply and demand with comprehensive volume analysis, tools like the indicator introduced here offer unparalleled clarity into market behavior. This indicator calculates the relative strength of supply and demand for each candlestick by analyzing the ratio of buyers to sellers.
🔵 How to Use
The presented indicator is a powerful tool for analyzing supply and demand strength in financial markets. It helps traders identify the strengths and weaknesses of buyers and sellers and utilize this information for better decision-making.
🟣 Analyzing the Highest Volume Trades on Candles
A unique feature of this indicator is the visualization of price levels with the highest trade volume for each candlestick. These levels are marked as black lines on the candles, indicating prices where most trades occurred. This information is invaluable for identifying key supply and demand zones, which often act as support or resistance levels.
🟣 Trend Confirmation
The indicator enables traders to confirm bullish or bearish trends by observing changes in buyer and seller strength. When buyer strength increases and demand surpasses supply, the likelihood of a bullish trend continuation grows. Conversely, decreasing buyer strength and increasing seller strength may signal a potential bearish trend reversal.
🟣 Adjusting Timeframes and Calculation Methods
Users can customize the indicator's candlestick timeframe to align with their trading strategy. Additionally, they can switch between moving average and current candle modes to achieve more precise market analysis.
This indicator, with its accurate and visual data display, is a practical and reliable tool for market analysts and traders. Using it can help traders make better decisions and identify optimal entry and exit points.
🔵 Settings
Lower Time Frame Volume : This setting determines which timeframe the indicator should use to identify the price levels with the highest trade volume. These levels, displayed as black lines on the candlesticks, indicate prices where the most trades occurred.
It is recommended that users align this timeframe with their primary chart’s timeframe.
As a general rule :
If the main chart’s timeframe is low (e.g., 1-minute or 5-minute), it is better to keep this setting at a similarly low timeframe.
As the main chart’s timeframe increases (e.g., daily or weekly), it is advisable to set this parameter to a higher timeframe for more aligned data analysis.
Cumulative Mode :
Current Candle : Strength is calculated only for the current candlestick.
EMA (Exponential Moving Average) : The strength is calculated using an exponential moving average, suitable for identifying longer-term trends.
Calculation Period : The default period for the exponential moving average (EMA) is set to 21. Users can modify this value for more precise analysis based on their specific requirements.
Ultra Data : This option enables users to view more detailed data from various market sources, such as Forex, Crypto, or Stocks. When activated, the indicator aggregates and displays volume data from multiple sources.
🟣 Table Settings
Show Info Table : This option determines whether the information table is displayed on the chart. When enabled, the table appears in a corner of the chart and provides details about the strength of buyers and sellers.
Table Size : Users can adjust the size of the text within the table to improve readability.
Table Position : This setting defines the table’s placement on the chart.
🔵 Conclusion
The indicator introduced in this article is designed as an advanced tool for analyzing supply and demand dynamics in financial markets. By leveraging buyer and seller strength ratios and visually highlighting price levels with the highest trade volume, it aids traders in identifying key market zones.
Key features, such as adjustable analysis timeframes, customizable calculation methods, and precise volume data display, allow users to tailor their analyses to market conditions.
This indicator is invaluable for analyzing support and resistance levels derived from trade volumes, enabling traders to make more accurate decisions about entering or exiting trades.
By utilizing real market data and displaying the highest trade volume lines directly on the chart, it provides a precise perspective on market behavior. These features make it suitable for both novice and professional traders aiming to enhance their analysis and trading strategies.
With this indicator, traders can gain a better understanding of supply and demand dynamics and operate more intelligently in financial markets. By combining volume data with visual analysis, this tool provides a solid foundation for effective decision-making and improved trading performance. Choosing this indicator is a significant step toward refining analysis and achieving success in complex financial markets.
Chỉ báo Độ rộng

Support and Resistance TrendlinesStrategy:
Support: Identified as the lowest low over a specific period.
Resistance: Identified as the highest high over a specific period.
Dynamic Trendlines: We’ll use the concept of a rolling window to calculate the highest highs and lowest lows over the last n bars (you can adjust the number of bars for more sensitivity).
Explanation:
Lookback Period (length): The number of bars over which we calculate the support and resistance levels. You can adjust this value depending on the timeframe and the sensitivity you want for the trendlines.
Resistance: This is the highest high over the length of bars. We use ta.highest(high, length) to find the highest high within the specified lookback period.
Support: This is the lowest low over the length of bars. We use ta.lowest(low, length) to find the lowest low within the specified lookback period.
Plotting the Lines:
We plot the support and resistance as horizontal lines on the chart using plot().
Additionally, we create dynamic trendlines that update automatically with each new bar. The line.new function creates lines that can be modified dynamically as new price data comes in.
Line Persistence:
The line functions are used to create horizontal lines that persist across bars. The trendlines adjust their position as the bars move forward.
How It Works:
This indicator will automatically detect the highest and lowest prices over the last n bars and draw support (green line) and resistance (red line) levels on the chart.
The trendlines will adjust as the market evolves and provide visual reference points for potential areas of price reversal.
How to Use This Script:
Copy and paste the Pine Script code into the Pine Script Editor on TradingView.
Save the script, and then add it to your chart.
Adjust the Lookback Period input to suit your trading strategy and timeframe.
The support and resistance levels will be drawn dynamically, and the lines will update as new bars form.
Customizations:
You can modify the number of bars (length) used to calculate support and resistance, depending on the timeframes you're interested in.
If you need more advanced trendline drawing (such as drawing trendlines between significant high/low points or automatic adjustment to more complex patterns), you might need to implement more advanced logic using peaks and valleys or price action patterns.
Let me know if you need any further adjustments!

Alert Kabi Family Unlimited Alarm indicator for any time frame and any type of currency, stock and index
اندییکاتور آلارم نامحدود برای هر تایم فریم و هر شاخص و ارز و سهام
Settings :
1- Before starting, clear all alarms in the trading view alarm section
2- Specify your alarm areas and currency pairs in the indicator settings section
3- Go to the trading view alarm section, click create alert, select the name of the indicator and click OK
4- Good Luck
T e L : @Ar3781
1- قبل از شروع تمام آلارم های تریدینگ ویو را پاک کنید
2- در قسمت تنظیمات اندیکاتور نواحی آلارم و جفت ارز خود را مشخص کنید
3- به قسمت الارم تریدینگ ویو رفته ایجاد هشدار را زده و اسم اندیکاتور را انتخاب کنید و اوکی کنید
4- مـــــــوفق بــــــاشـید

Custom RSI & MACD Momentum Entry SignalsIndicator Explanation: Custom RSI & MACD Momentum Entry Signals
Introduction
The "Custom RSI & MACD Momentum Entry Signals" indicator combines the Relative Strength Index (RSI) and the Moving Average Convergence Divergence (MACD) to generate precise long and short entry signals. This indicator offers a powerful combination of overbought/oversold zones, momentum analysis, and RSI-EMA crossovers to assist traders in making better decisions.
How the Indicator Works
1. RSI Calculation and EMA
The RSI is calculated based on the closing price with an adjustable period (default: 14).
An Exponential Moving Average (EMA) of the RSI (default: 9) is plotted to identify RSI trend changes.
When the RSI crosses its EMA upwards, it signals a bullish impulse. Conversely, a downward cross indicates a bearish impulse.
2. MACD Calculation and Momentum Shifts
The MACD line is derived from the difference between a fast EMA (default: 12) and a slow EMA (default: 26).
The Signal line is the EMA of the MACD line (default: 9).
The MACD histogram represents the difference between the MACD line and the Signal line.
Momentum shifts are detected as follows:
Weakening Bearish: Histogram is negative but increasing (less bearish pressure).
Strengthening Bullish: Histogram is positive and rising.
Weakening Bullish: Histogram is positive but decreasing.
Strengthening Bearish: Histogram is negative and falling.
Signal Generation
Long Signals
A Long signal is triggered when all of the following conditions are met:
The RSI was previously below 30 (oversold condition).
MACD momentum shifts from "strengthening bearish" to "weakening bearish" or turns bullish.
The RSI crosses its EMA upwards.
A green upward arrow is displayed below the bar, and the background is lightly shaded green for additional visualization.
Short Signals
A Short signal is triggered when all of the following conditions are met:
The RSI was previously above 70 (overbought condition).
MACD momentum shifts from "strengthening bullish" to "weakening bullish" or turns bearish.
The RSI crosses its EMA downwards.
A red downward arrow is displayed above the bar, and the background is lightly shaded red for additional visualization.
Visual Elements
RSI and EMA:
The RSI is shown in purple.
The RSI EMA is shown in blue.
Horizontal lines at 30 (oversold) and 70 (overbought) provide additional context.
MACD:
The MACD line is displayed in blue.
The Signal line is displayed in orange.
The zero line is added for easier interpretation.
Signals:
Green arrows: Long signals.
Red arrows: Short signals.
Background color: Light green for long conditions, light red for short conditions.
Use Cases
This indicator is ideal for:
Trend Followers: Combining RSI and MACD allows traders to identify entry points during impulsive trend shifts.
Swing Traders: Long and short signals can be used at reversal points to capture short-term price movements.
Momentum Traders: By considering MACD momentum, the indicator provides additional confidence in signal generation.
Customizable Settings
The indicator provides flexible input options:
RSI Period (default: 14)
RSI EMA Period (default: 9)
MACD Parameters: Fast, slow, and signal EMAs can be adjusted.
Conclusion
The Custom RSI & MACD Momentum Entry Signals indicator is a powerful tool for traders looking to combine RSI and MACD to identify high-probability entry signals. With clear visualization and precise signal generation, traders can make decisions more efficiently and capitalize on market movements.

Cryptocurrency SentimentOverview
This script focuses on calculating and visualizing the sentiment difference between LONG positions and SHORT positions for a selected cryptocurrency pair on the Bitfinex exchange. It provides a clean and clear visual representation of the sentiment, helping traders analyze market behavior.
Key Features
Dynamic Symbol Selection:
The script automatically detects the cryptocurrency symbol from the chart (syminfo.basecurrency) and dynamically constructs the LONGS and SHORTS ticker symbols.
Works seamlessly for pairs like BTCUSD, ETHUSD, and others available on Bitfinex.
Sentiment Calculation:
The sentiment difference is calculated as:
Sentiment Difference=−1×(100− SHORTS/LONGS ×100)
LONGS : The total number of long positions.
SHORTS : The total number of short positions.
If SHORTS is 0, the value is safely skipped to avoid division errors.
Color Coding:
The script visually highlights the sentiment difference:
Green Line: Indicates that LONG positions are dominant (bullish sentiment).
Red Line: Indicates that SHORT positions are dominant (bearish sentiment).
Zero Reference Line:
A gray horizontal line at 0 helps users quickly identify the transition between bullish (above zero) and bearish (below zero) sentiment.
How It Works
Fetching Data:
The script uses request.security to fetch LONGS and SHORTS data at the current chart timeframe (timeframe.period) for the dynamically generated Bitfinex tickers.
Handling Data:
Missing or invalid data (NaN) is filtered out to prevent errors.
Extreme spikes or irregular values are safely avoided.
Visualization:
The sentiment difference is plotted with dynamic color coding:
Green when LONGS > SHORTS (bullish sentiment).
Red when SHORTS > LONGS (bearish sentiment).
Benefits
Market Sentiment Insight: Helps traders quickly identify if the market is leaning towards bullish or bearish sentiment based on actual LONG and SHORT position data.
Dynamic and Adaptive: Automatically adjusts to the selected cryptocurrency symbol on the chart.
Clean Visualization: Focuses solely on sentiment difference with color-coded signals, making it easy to interpret.
Best Use Cases
Trend Confirmation: Use the sentiment difference to confirm trends during bullish or bearish moves.
Market Reversals: Identify potential reversals when sentiment shifts from positive (green) to negative (red) or vice versa.
Sentiment Monitoring: Monitor the overall market bias for cryptocurrencies like BTC, ETH, XRP, etc., in real-time.
Sample Chart Output
Above Zero → Green Line: Bullish sentiment dominates.
Below Zero → Red Line: Bearish sentiment dominates.
Zero Line → Transition point for shifts in sentiment.

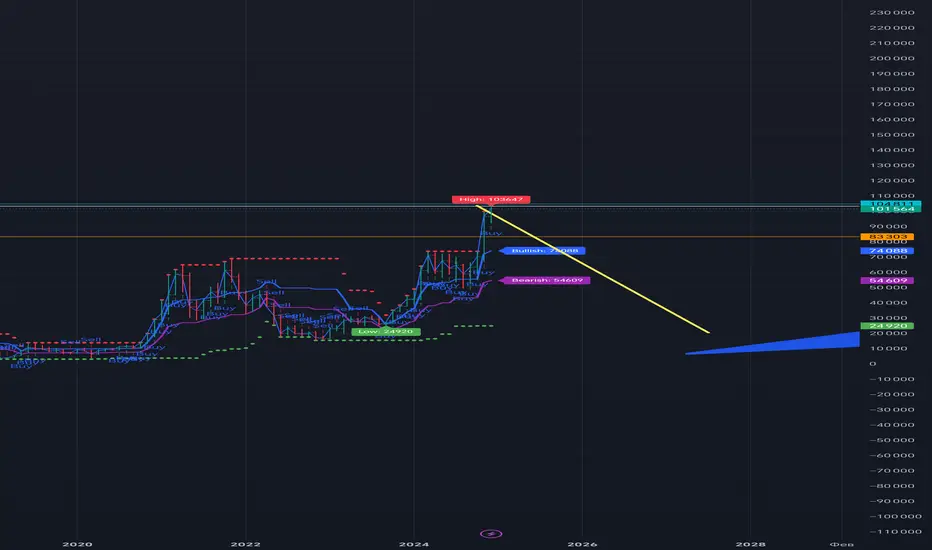
Shark Price & Bar Prediction
### Description for TradingView
**Shark Price & Bar Prediction Indicator**
The "Shark Price & Bar Prediction" indicator is designed to provide traders with insights into potential price movements based on local extremes in price action. Utilizing Volume Spread Analysis (VSA), this script identifies key price levels and generates predictive targets for bullish and bearish trends.
#### Features:
- **Local Extremes Detection**: Automatically finds the highest and lowest points within a specified prediction period.
- **Price Prediction**: Calculates potential bullish and bearish targets using Fibonacci levels.
- **Visual Signals**: Displays buy and sell signals directly on the chart, making it easy to identify entry points.
- **Customizable Settings**: Users can adjust the prediction period and confidence threshold to suit their trading style.
### How to Use:
1. **Settings**: Adjust the following inputs according to your preferences:
- **Prediction Period**: Set the number of bars to look back for local extremes.
- **Confidence Threshold**: Define the confidence level for predicting price targets.
- **Show Additional Labels**: Toggle additional labels for more detailed information on the chart.
2. **Interpreting Signals**:
- **Buy Signal**: When the closing price exceeds the bullish target, an upward arrow will appear below the bar, indicating a potential buying opportunity.
- **Sell Signal**: When the closing price falls below the bearish target, a downward arrow will appear above the bar, suggesting a potential selling opportunity.
3. **Visual Indicators**:
- The highest point is marked with a 🔴 **red circle**, while the lowest point is marked with a 🟢 **green circle**.
- Bullish targets are represented by a 🔵 **blue line**, and bearish targets are represented by a 🟣 **purple line**.
### Объяснение на русском
**Индикатор Прогнозирования Цены и Баров Shark**
Индикатор "Shark Price & Bar Prediction" предназначен для предоставления трейдерам информации о потенциальных ценовых движениях на основе локальных экстремумов в ценовом действии. Используя анализ объема и спреда (VSA), этот скрипт определяет ключевые уровни цен и генерирует прогнозные цели для бычьих и медвежьих трендов.
#### Особенности:
- **Обнаружение Локальных Экстремумов**: Автоматически находит максимальные и минимальные точки в заданный период прогнозирования.
- **Прогнозирование Цены**: Вычисляет потенциальные бычьи и медвежьи цели с использованием уровней Фибоначчи.
- **Визуальные Сигналы**: Отображает сигналы покупки и продажи непосредственно на графике, что облегчает определение точек входа.
- **Настраиваемые Параметры**: Пользователи могут регулировать период прогнозирования и уровень уверенности в соответствии со своим стилем торговли.
### Как использовать:
1. **Настройки**: Отрегулируйте следующие параметры в соответствии с вашими предпочтениями:
- **Период Прогнозирования**: Установите количество баров для поиска локальных экстремумов.
- **Порог Уверенности**: Определите уровень уверенности для прогнозирования ценовых целей.
- **Показать Дополнительные Метки**: Включите дополнительные метки для более детальной информации на графике.
2. **Интерпретация Сигналов**:
- **Сигнал Покупки**: Когда цена закрытия превышает бычью цель, под баром появится стрелка вверх, указывающая на потенциальную возможность покупки.
- **Сигнал Продажи**: Когда цена закрытия падает ниже медвежьей цели, над баром появится стрелка вниз, предлагающая потенциальную возможность продажи.
3. **Визуальные Индикаторы**:
- Максимальная точка обозначена 🔴 **красным кругом**, а минимальная точка — 🟢 **зеленым кругом**.
- Бычьи цели представлены 🔵 **синей линией**, а медвежьи цели — 🟣 **пурпурной линией**.
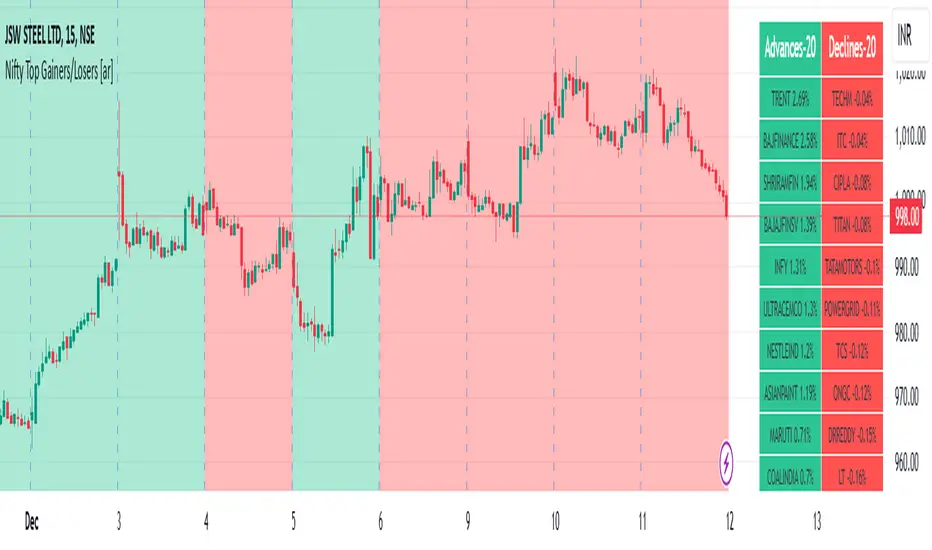
Nifty Top Gainers/Losers [ar]Nifty Top Gainers/Losers - Real-time Market Performance Tracker
A powerful indicator that monitors and displays real-time performance of 40 major Nifty stocks in a clean, organized table format. Perfect for traders seeking instant market breadth insights.
Key Features:
• Dynamic advances/declines counter at the top
• Real-time percentage change calculations
• Color-coded display (green for gainers, red for losers)
• Customizable reference points (Previous Day Close/Today's Open)
• Optional background color based on market breadth
• Flexible top gainers/losers limit setting
Customization Options:
- Adjust colors for gainers and losers
- Set transparency for background
- Modify the number of top performers to display
- Add/remove symbols from the watchlist
- Choose calculation reference (Previous Day Close/Today's Open)
Ideal for:
- Day traders monitoring market momentum
- Investors tracking sector rotation
- Analysts studying market breadth
- Portfolio managers seeking quick market overview
This indicator helps identify market leaders and laggards at a glance, making it an essential tool for informed trading decisions.
Hilega-Milega-RSI-EMA-WMA indicator designed by NKThis indicator is works on RSI, Price and volume to give leading Indicator to Buy or Sell.
This indicator works on all financial markets
Hilega-Milega-RSI-EMA-WMA indicator designed by Nitish Sir
For intraday trade, enter with 15 mins chart.
For positional trade, enter with 1-hour chart.
For Investment this system can be used with daily/weekly/monthly chart.
• RED line is for Volume.
• Green line is for the Price.
• Black line is for the RSI (9).
SELL Trade
1. When Volume (RED line) is above/crossed above Price (Green line) and Strength (Black line), then stock price will go down. This means we will SELL.
2. When there is a GAP in the RED line and the Green line till the time price will go down.
Exit criteria
Whenever Red line exit the shaded area of Oversold zone OR Red line cross over the Green and black line then we will exit.
In case of the SELL trade, after the entry we will monitor the trade in 5 min chart, if the candle is closed above the VWAP then exit.
If the price is crossed the 50 SMA then we will exit trade.
BUY Trade
1. When Volume (RED line) is below/crossed below Price (Green line) and Strength (Black line), then stock price will go up. This means we will BUY.
2. When there is a GAP in the RED line and the Green line till the time price will go down.
Exit criteria
Whenever Red line exit the shaded area of Overbought zone OR Red line cross over the Green and black line then we will exit.
In case of the Buy trade, after the entry we will monitor the trade candle is closed below the VWAP then exit.
If the price is crossed the 50 SMA then we will exit trade.

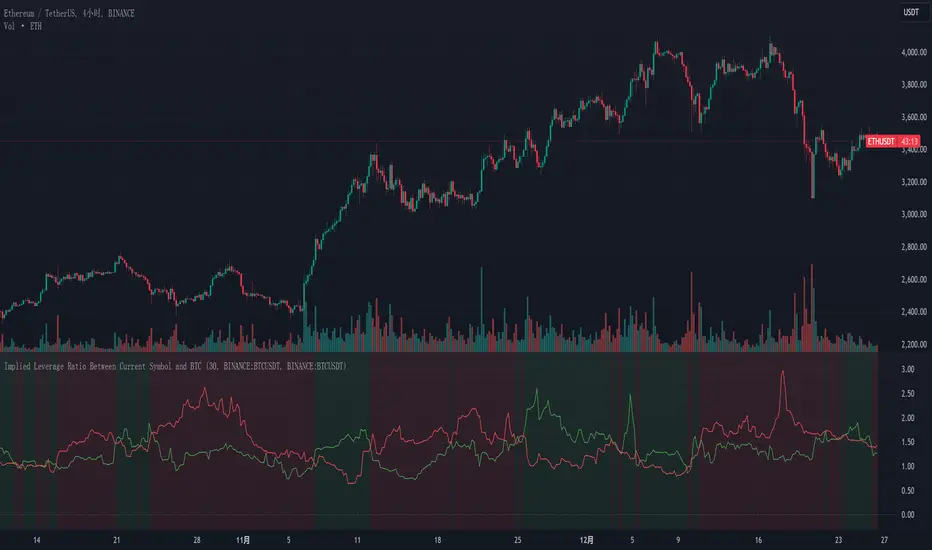
Implied Leverage Ratio Between Current Symbol and BTCThis script calculates and visualizes the implied leverage ratio between the current symbol and Bitcoin (BTC). The implied leverage ratio is computed by comparing the cumulative price changes of the two symbols over a defined number of candles. The results provide insights into how the current symbol performs relative to BTC in terms of bullish (upward) and bearish (downward) movements.
Features
Cumulative Up and Down Ratios:
The script calculates the cumulative price increase (up) and decrease (down) ratios for both the current symbol and BTC. These ratios are based on the percentage changes relative to each candle's opening price.
Implied Leverage Ratio:
For bullish movements, the cumulative up ratio of the current symbol is divided by BTC's cumulative up ratio.
For bearish movements, the cumulative down ratio of the current symbol is divided by BTC's cumulative down ratio.
These values reflect the implied leverage of the current symbol relative to BTC in both directions.
Customizable Comparison Symbol:
By default, the script compares the current symbol to BINANCE:BTCUSDT. However, you can specify any other symbol to tailor the analysis.
Interactive Visualization:
Green Line: Represents the ratio of cumulative up movements (current symbol vs. BTC).
Red Line: Represents the ratio of cumulative down movements (current symbol vs. BTC).
A horizontal zero line is included for reference, ensuring the chart always starts from zero.
How to Use
Add this script to your chart from the Pine Editor or the public library.
Customize the number of candles (t) to define the period over which cumulative changes are calculated.
If desired, replace the comparison symbol with another asset in the input settings.
Analyze the green and red lines to identify relative strength and implied leverage trends.
Who Can Benefit
Traders and Analysts: Gain insights into the relative performance of altcoins, stocks, or other instruments against BTC.
Leverage Seekers: Identify assets with higher or lower implied leverage compared to Bitcoin.
Market Comparisons: Understand how various assets react to market movements relative to BTC.
This tool is particularly useful for identifying potential outperformers or underperformers relative to Bitcoin and can guide strategic decisions in trading pairs or market analysis.
Murad Picks Target MCThe Murad Picks Target Market Cap Indicator is a custom TradingView tool designed for crypto traders and enthusiasts tracking tokens in the Murad Picks list. This indicator dynamically calculates and visualizes the price targets based on Murad Mahmudov's projected market capitalizations, allowing you to gauge each token's growth potential directly on your charts.
Indicator support tokens:
- SPX6900
- GIGA
- MOG
- POPCAT
- APU
- BITCOIN
- RETARDIO
- LOCKIN
Key Features :
Dynamic Target Price Lines:
- Displays horizontal lines representing the price when the token reaches its projected market cap.
- Automatically adjusts for the active chart symbol (e.g., SPX, MOG, APU, etc.).
X Multiplier Calculation:
- Shows how many times the current price must multiply to achieve the target price.
- Perfect for understanding relative growth potential.
Customizable Inputs:
- Easily update target market caps and circulating supply for each token.
- Adjust visuals such as line colors and styles.
Seamless Integration:
- Automatically adapts to the token you’re viewing (e.g., SPX, MOG, APU).
- Clean and visually intuitive, with labels marking targets.

CVD OscillatorCVD Delta Oscillator
A momentum oscillator that measures buying and selling pressure through volume analysis, based on the principle that volume precedes price (cause and effect).
How It Works
Volume Analysis
Measures the force of buying and selling by analyzing how volume interacts with price movement within each bar
When price closes higher in a bar's range with strong volume, this indicates stronger buying pressure
When price closes lower in a bar's range with strong volume, this indicates stronger selling pressure
Momentum Measurement
Uses two EMAs (fast and slow) to smooth the volume delta
The difference between these EMAs creates an oscillator that shows:
Rising values = Buying pressure increasing
Falling values = Selling pressure increasing
Zero line crossovers = Potential shift in control between buyers and sellers
Signal Generation
Divergences
Bullish: Price falls to new lows while buying pressure increases (potential reversal up)
Bearish: Price rises to new highs while selling pressure increases (potential reversal down)
Zero-Line Crossovers
Bullish: Buying pressure overtakes selling pressure
Bearish: Selling pressure overtakes buying pressure
Practical Application
Reading the Indicator
Green columns above zero = Net buying pressure
Red columns below zero = Net selling pressure
Larger columns = Stronger pressure
Divergences and crossovers = Potential turning points
Trading Context
Helps identify when price movement has strong or weak volume support
Shows potential exhaustion points through divergences
Confirms trend changes through zero-line crossovers
Customization
Adjustable EMA periods for different trading styles
Toggle-able visual signals
Automatic alerts for all signals

MktCumTickThis script is a market sentiment indicator that calculates the cumulative TICK (Trade Imbalance Sentiment) for four major markets: NYSE (New York Stock Exchange), NASDAQ (National Association of Securities Dealers Automated Quotations), Dow Jones, and AMEX (American Stock Exchange).
Here's a breakdown of the script:
1. Market data requests: The script requests data for the four markets, including:
- TICK (Trade Imbalance Sentiment) data
- HLC3 (High, Low, Close) data
- ADVN (Advancing issues), DECL (Declining issues), and UNCH (Unchanged issues) data
2. Cumulative TICK calculation: The script calculates the cumulative TICK for each market by dividing the TICK data by the maximum TICK value for each market.
3. Plotting: The script plots the cumulative TICK values for each market as separate lines on the chart.
4. Background color: The script changes the background color of the chart based on the cumulative TICK values. If all four markets have decreasing cumulative TICK values, the background color turns red. If all four markets have increasing cumulative TICK values, the background color turns green.
The purpose of this indicator is to provide a visual representation of market sentiment across multiple markets. By analyzing the cumulative TICK values, traders can gain insights into market trends and make more informed trading decisions.
Some possible uses of this indicator include:
- Identifying market trends and sentiment
- Confirming trade entries and exits
- Monitoring market conditions and adjusting trading strategies accordingly

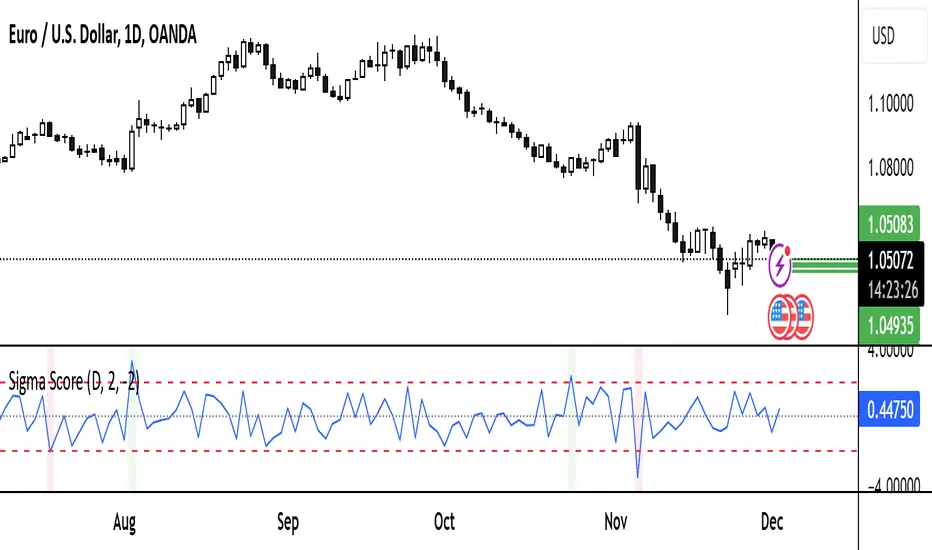
Sigma ScoreFunction and Purpose
The Sigma Score indicator is a tool for analyzing volatility and identifying unusual price movements of a financial instrument over a specified timeframe. It calculates the "Sigma Score," which measures how far the current price change deviates from its historical average in terms of standard deviations. This helps identify potential extremes and unusual market conditions.
Features
Timeframe Control
Users can select the desired timeframe for analysis (e.g., minutes, hours, days). This makes the indicator adaptable to various trading styles:
Supported timeframes: Minutes (M1, M5, M10, M15), Hours (H1, H4, H12), Days (D), Weeks (W), Months (M).
Sigma Score Calculation
The indicator computes the logarithmic return between consecutive price values.
It calculates a simple moving average (SMA) and the standard deviation (StDev) of these returns.
The Sigma Score is derived as the difference between the current return and the average, divided by the standard deviation.
Visual Representation
Sigma Score Plot: The Sigma Score is displayed as a line.
Horizontal Threshold Lines:
A middle line (0) for reference.
Upper and lower threshold lines (default: 2.0 and -2.0) for highlighting extremes.
Background Highlighting:
Green for values above the upper threshold (positive deviations).
Red for values below the lower threshold (negative deviations).
Custom Settings
Timeframe
Select the timeframe for analysis using a dropdown menu (default: D for daily).
Thresholds
Upper Threshold: Default = 2.0 (positive extreme area).
Lower Threshold: Default = -2.0 (negative extreme area).
Both values can be adjusted to modify the indicator's sensitivity.
Use Cases
Identifying Extremes: Values above or below the thresholds can signal unusual market conditions, such as overbought or oversold areas.
Analyzing Market Anomalies: The Sigma Score quantifies how unusual a price movement is based on historical data.
Visual Aid: Threshold lines and background highlighting simplify the interpretation of boundary conditions.
Notes and Limitations
Timeframe Dependency: Results may vary depending on the selected timeframe. Shorter timeframes highlight short-term movements, while longer timeframes capture broader trends.
Volatility Sensitivity: The indicator is sensitive to changes in market volatility. Sudden price swings may produce extreme Sigma values.
Summary
The Sigma Score indicator is a powerful tool for traders and analysts to quickly identify unusual market conditions and make informed decisions. Its flexibility in adjusting timeframes and thresholds makes it a versatile addition to any trading strategy.
Dynamic RSI with Overbought/Oversold LinesDynamic RSI with Overbought/Oversold Lines
This indicator enhances the traditional RSI (Relative Strength Index) by dynamically adjusting the overbought and oversold levels based on the highest and lowest RSI values over a user-defined period. The indicator plots these levels as horizontal lines, allowing traders to visually identify when the market is "overbought" or "oversold."
Features:
Dynamic Overbought/Oversold Levels: Automatically adjusts the overbought and oversold levels based on the highest and lowest RSI values within the defined period, ensuring more accurate signals tailored to the current market conditions.
Customizable RSI Period: Choose your preferred RSI period to suit your trading strategy.
Signal Alerts: Visual signals are displayed when the RSI crosses into the overbought or oversold zone, indicating potential reversal points.
Background Color Alerts: The background changes color when the RSI exceeds overbought or oversold levels, making it easier to spot these important zones at a glance.
Clean and Simple: A minimalist design focusing on the key elements, making it suitable for all traders.
How to Use:
Overbought Zone: When the RSI moves above the overbought line (red), it may indicate that the asset is overbought, signaling a potential price reversal or pullback.
Oversold Zone: When the RSI moves below the oversold line (green), it may indicate that the asset is oversold, signaling a potential price bounce or reversal.
This dynamic RSI indicator is perfect for those looking to capture market extremes and improve their trading decisions. It's especially useful for timeframes like 30-minute and 1-hour charts, where market conditions tend to shift more rapidly.

Volume Index (0-100)Volume Index (0-100) Indicator
The Volume Index (0-100) indicator is a powerful tool designed to help traders understand current volume levels in relation to past activity over a specified period. By normalizing volume data to a scale from 0 to 100, this indicator makes it easy to compare today's volume against recent history and gauge the strength of market movements.
Key Features:
Normalized Volume Index: The indicator indexes volume between 0 and 100, allowing traders to easily determine if the current volume is unusually high or low compared to recent trends.
Colored Visualization: The line graph is colored green for positive volume (increasing activity) and red for negative volume (decreasing activity). This helps traders quickly grasp the market sentiment and volume direction.
User-Defined Lookback Period: Traders can customize the lookback period to best fit their trading strategy, providing flexibility for different market conditions.
How Traders Can Use It:
Identifying Volume Extremes: The Volume Index helps identify periods of unusually high or low volume. Values approaching 100 indicate high volume, while values close to 0 indicate low volume.
Confirmation Tool: During price movements, high volume (near 100) can act as a confirmation signal for the strength of the trend. For instance, a high volume during an uptrend may indicate strong buying interest.
Divergence Analysis: Traders can look for divergences between volume and price. For example, if the price is consolidating while the Volume Index remains high, it could signal an impending breakout.
Volume Alerts: The indicator includes an alert feature when the Volume Index exceeds 80, helping traders stay informed about potential shifts in market volatility.
Support, Resistance, MA, and ADXSummary
This comprehensive script provides traders with a tool that highlights critical levels of support and resistance, detects significant price breakouts with volume confirmation, identifies potential reversals with wick analysis, and plots a moving average that changes color based on trend strength as indicated by the ADX. It is useful for spotting entry and exit points, confirming breakouts, and identifying trend direction and strength.

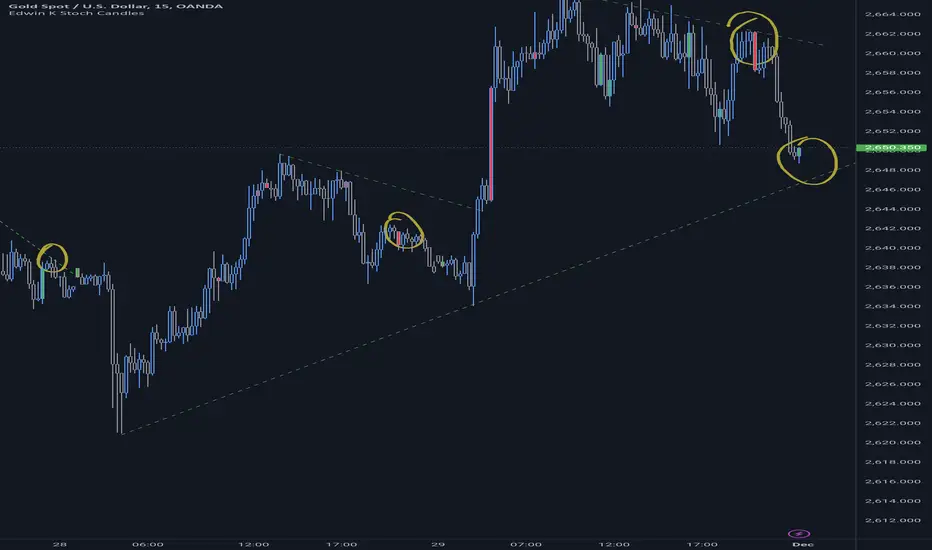
Edwin K Stochastic Candle ColorsThe Stochastic Candle Colors indicator highlights price action using candle colors based on signals from the stochastic oscillator. Here's how to use it:
1. Indicator Purpose
This indicator overlays on your price chart and changes candle colors based on stochastic oscillator signals:
Green candles: Indicate a bullish signal when the %K line crosses above the %D line in an oversold area (below 20).
Red candles: Indicate a bearish signal when the %K line crosses below the %D line in an overbought area (above 80).
2. How to Use the Inputs
K (periodK): The lookback period for calculating the %K line of the stochastic oscillator. A smaller value makes the indicator more sensitive to price changes.
D (periodD): The period for smoothing the %K line to get the %D line. A larger value creates smoother signals but may result in delays.
Smooth (smoothK): The additional smoothing applied to the %K line before calculating the %D line. This helps reduce noise.
3. How to Interpret the Candle Colors
Green Candle:
Occurs when the %K line crosses above the %D line in the oversold zone (below 20).
Signals a potential bullish reversal.
Red Candle:
Occurs when the %K line crosses below the %D line in the overbought zone (above 80).
Signals a potential bearish reversal.
No Color:
No crossover occurs, or the crossover doesn't happen in overbought/oversold zones.
4. Application in Trading
Entry Points:
Buy when you see a green candle and confirm with other indicators or chart patterns.
Sell when you see a red candle and confirm with additional signals.
Trend Context:
Combine this indicator with trend-following tools like moving averages or support/resistance levels to improve accuracy.
Stop Loss/Take Profit:
Use nearby swing highs/lows for stop-loss placement.
Set profit targets based on risk-reward ratios or key levels.
5. Customization
Adjust the input parameters (K, D, and Smooth) to align the indicator's sensitivity with your trading style:
Short-term traders might prefer lower values for quicker signals.
Long-term traders might opt for higher values for smoother, more reliable signals.
6. Limitations
Signals in isolation might not be reliable. Always use this indicator in conjunction with other tools.
Avoid using during low volatility or sideways markets as stochastic oscillators can produce false signals.
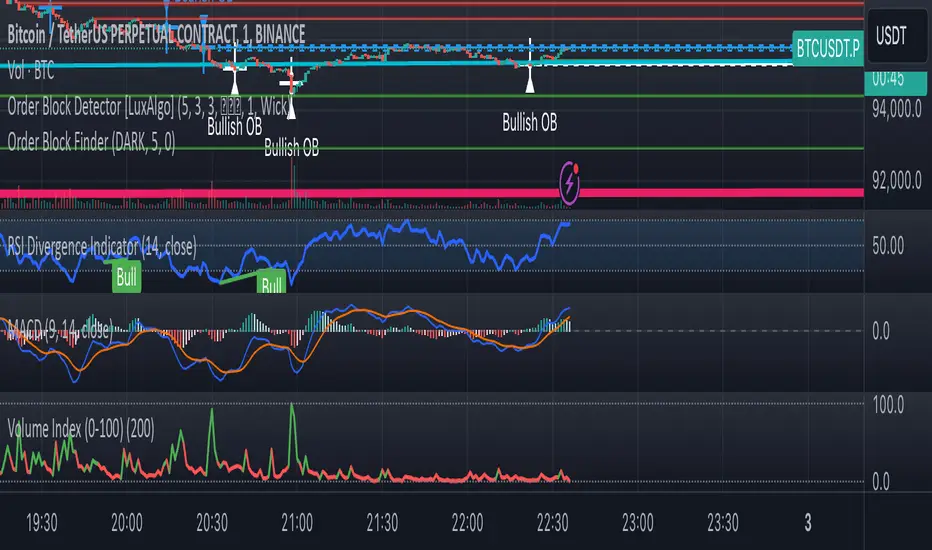
MACD, ADX & RSI -> for altcoins# MACD + ADX + RSI Combined Indicator
## Overview
This advanced technical analysis tool combines three powerful indicators (MACD, ADX, and RSI) into a single view, providing a comprehensive analysis of trend, momentum, and divergence signals. The indicator is designed to help traders identify potential trading opportunities by analyzing multiple aspects of price action simultaneously.
## Components
### 1. MACD (Moving Average Convergence Divergence)
- **Purpose**: Identifies trend direction and momentum
- **Components**:
- Fast EMA (default: 12 periods)
- Slow EMA (default: 26 periods)
- Signal Line (default: 9 periods)
- Histogram showing the difference between MACD and Signal line
- **Visual**:
- Blue line: MACD line
- Orange line: Signal line
- Green/Red histogram: MACD histogram
- **Interpretation**:
- Histogram color changes indicate potential trend shifts
- Crossovers between MACD and Signal lines suggest entry/exit points
### 2. ADX (Average Directional Index)
- **Purpose**: Measures trend strength and direction
- **Components**:
- ADX line (default threshold: 20)
- DI+ (Positive Directional Indicator)
- DI- (Negative Directional Indicator)
- **Visual**:
- Navy blue line: ADX
- Green line: DI+
- Red line: DI-
- **Interpretation**:
- ADX > 20 indicates a strong trend
- DI+ crossing above DI- suggests bullish momentum
- DI- crossing above DI+ suggests bearish momentum
### 3. RSI (Relative Strength Index)
- **Purpose**: Identifies overbought/oversold conditions and divergences
- **Components**:
- RSI line (default: 14 periods)
- Divergence detection
- **Visual**:
- Purple line: RSI
- Horizontal lines at 70 (overbought) and 30 (oversold)
- Divergence labels ("Bull" and "Bear")
- **Interpretation**:
- RSI > 70: Potentially overbought
- RSI < 30: Potentially oversold
- Bullish/Bearish divergences indicate potential trend reversals
## Alert System
The indicator includes several automated alerts:
1. **MACD Alerts**:
- Rising to falling histogram transitions
- Falling to rising histogram transitions
2. **RSI Divergence Alerts**:
- Bullish divergence formations
- Bearish divergence formations
3. **ADX Trend Alerts**:
- Strong trend development (ADX crossing threshold)
- DI+ crossing above DI- (bullish)
- DI- crossing above DI+ (bearish)
## Settings Customization
All components can be fine-tuned through the settings panel:
### MACD Settings
- Fast Length
- Slow Length
- Signal Smoothing
- Source
- MA Type options (SMA/EMA)
### ADX Settings
- Length
- Threshold level
### RSI Settings
- RSI Length
- Source
- Divergence calculation toggle
## Usage Guidelines
### Entry Signals
Strong entry signals typically occur when multiple components align:
1. MACD histogram color change
2. ADX showing strong trend (>20)
3. RSI showing divergence or leaving oversold/overbought zones
### Exit Signals
Consider exits when:
1. MACD crosses signal line in opposite direction
2. ADX shows weakening trend
3. RSI reaches extreme levels with divergence
### Risk Management
- Use the indicator as part of a complete trading strategy
- Combine with price action and support/resistance levels
- Consider multiple timeframe analysis for confirmation
- Don't rely solely on any single component
## Technical Notes
- Built for TradingView using Pine Script v5
- Compatible with all timeframes
- Optimized for real-time calculation
- Includes proper error handling and NA value management
- Memory-efficient calculations for smooth performance
## Installation
1. Copy the provided Pine Script code
2. Open TradingView Chart
3. Create New Indicator -> Pine Editor
4. Paste the code and click "Add to Chart"
5. Adjust settings as needed through the indicator settings panel
## Version Information
- Version: 2.0
- Last Updated: November 2024
- Platform: TradingView
- Language: Pine Script v5

US/JP Factor/Sector Performance RankingThis indicator is designed to help you easily understand the strengths and weaknesses of different factors and sectors in the U.S. stock market. It looks at various ETFs, ranks their performance over a specific period (20 days by default), and shows the results visually.
= How the Ranking Works
The best-performing rank is shown as -1, with lower ranks as -2, -3, -4, and so on. This setup makes it easy to see rank order in TradingView’s default view.
If you turn on the “Inverse” setting, ranks will be shown as positive numbers in order (e.g., 1, 2, 3…). In this case, it’s recommended to reverse the TradingView scale for better understanding.
= How the Indicator Reacts to Market Conditions
- Normal Market Conditions
Certain factors or sectors often stay at the top rank. For example, during the rallies at the start of 2024 and in May, the Momentum factor performed well, showing a risk-on market environment.
On the other hand, sectors at the bottom rank also tend to stay in specific positions.
- Market Tops
Capital flows within sectors slow down, and top ranks begin to change frequently. This may suggest a market turning point.
- Bear Markets or High Volatility
Rankings become more chaotic in these conditions. These large changes can help you understand market sentiment and the level of volatility.
= Way of using the Indicator
You can use this indicator in the following ways:
- To apply sector rotation strategies.
- To build positions after volatile markets calm down.
- To take long positions on strong elements (higher ranks) and short positions on weaker ones (lower ranks).
= Things to Keep in Mind
It’s a Lagging Indicator
This indicator calculates rankings using the past 20 days of data. It doesn’t provide signals for the future but is a tool for analyzing past performance. To predict the market, you should combine this with other tools or leading indicators.
However, since trends in capital flows often continue, this indicator can help you spot those trends.
= Customization
This indicator is set up for U.S. and Japanese stock markets. However, you can customize it for other markets by changing the ticker and label description in the script.
==Japanese Description==
このインジケーターは、米国株市場におけるファクターやセクターの強弱を直感的に把握するために設計されています。
各ETFを参照し、特定期間(デフォルトでは20日間)のパフォーマンスを順位付けし、それを視覚的に表示します。
= インジケーターの特徴
- ランク付けの仕様
ランク1位は-1で表され、順位が下がるごとに-2、-3、-4…と減少します。この仕様により、TradingViewの標準状態でランクの高低を直感的に把握できるようにしました。
さらに、Inverse設定をONにすると、1位から順に正の値(例: 1, 2, 3…)で表示されるようになります。この場合、TradingViewのスケールを反転させることを推奨します。
= 市況とインジケーターの動き
- 平常時の市況
特定のファクターやセクターがランク1位を維持することが多いです。
例えば、2024年の年初や同年5月の上昇相場では、Momentumファクターが効果を発揮し、リスクオンの市場環境であったことを示しています。
一方、最下位に位置するセクターも特定の順位を維持する傾向があります。
- 天井圏の市況
セクター内の資金流入や流出が停滞し、上位ランクの変動が起こり始めます。これが市場の転換点を示唆する場合があります。
- 下落相場や荒れた市況
ランク順位が大きく乱れることが特徴です。この変動の大きさは、市況の雰囲気やボラティリティの高さを感じ取る材料として活用できます。
= 活用方法
このインジケーターは以下のような投資戦略に役立てることができます:
- セクターローテーションを活用した投資戦略
- 荒れた相場が落ち着いたタイミングでのポジション構築
- 強い要素(ランク上位)のロング、弱い要素(ランク下位)のショート
= 注意点
- 遅行指標であること
本インジケーターは、過去20日間のデータを基にランクを算出します。そのため、先行的なシグナルを提供するものではなく、過去のパフォーマンスに基づいた分析ツールです。市場を先回りするには、別途先行指標や分析を組み合わせる必要があります。
ただし、特定のファクターやセクターへの資金流入・流出が継続する傾向があるため、これを見極める手助けにはなります。
= カスタマイズについて
このインジケーターは米国・日本株市場に特化しています。ただし、他国のファクターやセクターのETFや指数が利用可能であれば、スクリプト内のtickerとlabel descriptionを変更することでカスタマイズが可能です。

Buying and Selling PressureThis indicator estimates and visualizes the buying and selling pressure within each bar by distributing the volume based on where the closing price falls within the bar's range. It calculates cumulative buying and selling volumes over the last 10 bars and plots these values, allowing traders to assess market sentiment and potential shifts in momentum.
This indicator provides valuable insights into market dynamics by estimating buying and selling pressures over a set period. By visualizing these pressures, you can enhance your understanding of market sentiment and improve decision-making processes. It's most effective when used alongside other forms of analysis, such as price action, support and resistance levels, and additional technical indicators.
Note: Always thoroughly test any new indicator or trading strategy before applying it to live trading. Understanding how it behaves under different market conditions ensures it aligns with your trading objectives and risk management practices.

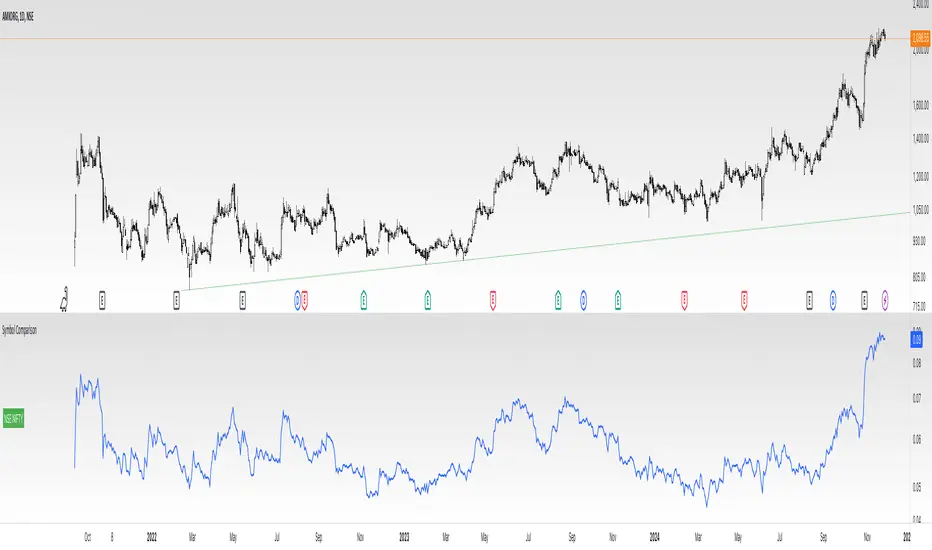
Divides company with IndexOverview:
This indicator simplifies the comparison of a stock's performance against a specified index, such as the Nifty 50. By calculating and plotting the ratio between the two, it provides a clear visual representation of relative strength.
Key Features:
-Direct Comparison: Easily compare any stock against a selected index.
-Customizable Index: Choose from a dropdown menu or input a custom index symbol.
-Visual Clarity: Maximizing the chart provides a clear view of the relative performance.
-SMA Overlay: Add a Simple Moving Average (SMA) to identify trends and potential entry/exit
points.
-Customizable Appearance: Adjust background color, text color, and label size for personalized
visualization.
How to Use:
Add the Indicator: Add the indicator to your chart.
Select the Index: Choose the desired index from the dropdown menu or input a custom symbol.
Analyze the Ratio:
-A rising ratio indicates the stock is outperforming the index.
-A falling ratio suggests underperformance.
-The SMA can help identify potential trends and momentum.
Customize the Appearance: Adjust the background color, text color, and label size to suit your preferences.
Benefits:
-Improved Decision Making: Gain insights into a stock's relative strength.
-Faster Analysis: Quickly compare multiple stocks against a benchmark index.
-Enhanced Visualization: Customize the chart for better understanding.
-By leveraging this indicator, you can make informed trading decisions and gain a deeper
understanding of market dynamics.
RS Theory IndicatorHow to Use:
Customize the Reference Symbol: In the settings of the indicator, you can change the referenceSymbol to the benchmark or asset you want to compare against.
RS Interpretation:
RS > 1: The current asset is outperforming the reference symbol.
RS < 1: The current asset is underperforming the reference symbol.
RS = 1: The current asset and the reference symbol are performing equally.
Alerts: You can enable alerts for when the RS crosses certain levels (e.g., when RS > 1 or RS < 1).
How It Works:
Reference Symbol: The user inputs the benchmark asset or symbol (e.g., "SPY" for an S&P 500 ETF). This will be used as the comparison symbol.
RS Calculation: The RS Value is calculated by dividing the current asset's close price by the reference asset's close price:
RS
=
Close Price of Current Asset
Close Price of Reference Asset
RS=
Close Price of Reference Asset
Close Price of Current Asset
Plotting:
The RS value is plotted on the chart as a line.
A horizontal line at RS = 1 is drawn for easy comparison, representing parity (when the asset and reference symbol have the same price).
Background Coloring: The background is colored:
Green when RS > 1 (indicating the asset is outperforming the benchmark).
Red when RS < 1 (indicating the asset is underperforming the benchmark).
Alerts: Alerts are triggered when the RS value is above or below 1, indicating outperformance or underperformance relative to the benchmark.

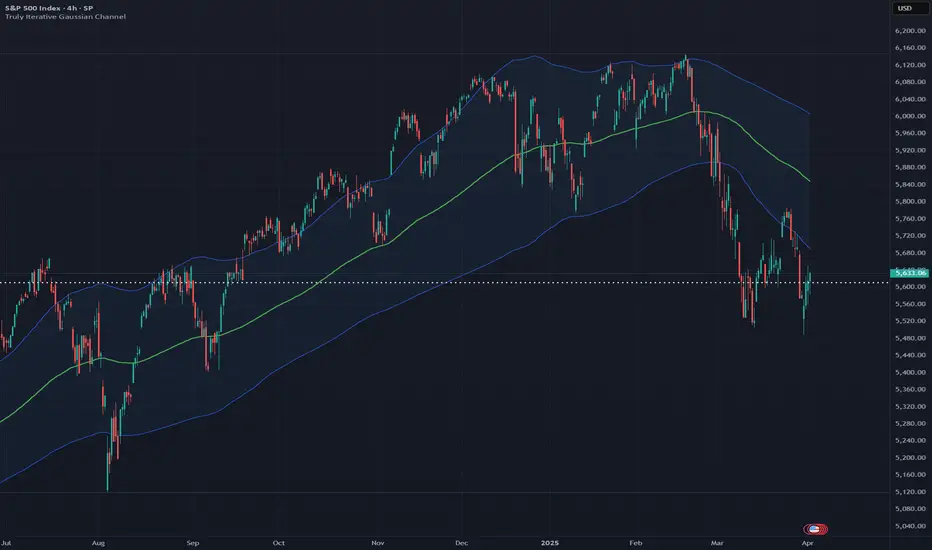
Truly Iterative Gaussian ChannelOVERVIEW
The Truly Iterative Gaussian Channel is a robust channeling system that integrates a Gaussian smoothing kernel with a rolling standard deviation to create dynamically adaptive upper and lower boundaries around price. This indicator provides a smooth, yet responsive representation of price movements while minimizing lag and dynamically adjusting channel width to reflect real-time market volatility. Its versatility makes it effective across various timeframes and trading styles, offering significant potential for experimentation and integration into advanced trading systems.
TRADING USES
The Gaussian indicator can be used for multiple trading strategies. Trend following relies on the middle Gaussian line to gauge trend direction: prices above this line indicate bullish momentum, while prices below signal bearish momentum. The upper and lower boundaries act as dynamic support and resistance levels, offering breakout or pullback entry opportunities. Mean reversion focuses on identifying reversal setups when price approaches or breaches the outer boundaries, aiming for a return to the Gaussian centerline. Volatility filtering helps assess market conditions, with narrow channels indicating low volatility or consolidation and suggesting fewer trading opportunities or an impending breakout. Adaptive risk management uses channel width to adjust for market volatility, with wider channels signaling higher risk and tighter channels indicating lower volatility and potentially safer entry points.
THEORY
Gaussian kernel smoothing, derived from the Gaussian normal distribution, is a cornerstone of probability and statistics, valued for its ability to reduce noise while preserving critical signal features. In this indicator, it ensures price movements are smoothed with precision, minimizing distortion while maintaining responsiveness to market dynamics.
The rolling standard deviation complements this by dynamically measuring price dispersion from the mean, enabling the channel to adapt in real time to changing market conditions. This combination leverages the mathematical correctness of both tools to balance smoothness and adaptability.
An iterative framework processes data efficiently, bar by bar, without recalculating historical value to ensure reliability and preventing repainting to create a mathematically grounded channel system suitable for a wide range of market environments.
The Gaussian channel excels at filtering noise while remaining responsive to price action, providing traders with a dependable tool for identifying trends, reversals, and volatility shifts with consistency and precision.
CALIBRATION
Calibration of the Gaussian channel involves adjusting its length to modify sensitivity and adaptability based on trading style. Shorter lengths (e.g., 50-100) are ideal for intraday traders seeking quick responses to price fluctuations. Medium lengths (e.g., 150-200) cater to swing traders aiming to capture broader market trends. Longer lengths (e.g., 250-400+) are better suited for positional traders focusing on long-term price movements and stability.
MARKET USAGE
Stock, Forex, Crypto, Commodities, and Indices.