RR 2 Software signal with Trend of the market/Central Pivot Range combined with RR1 for better results.Chỉ báo Pine Script®của RushabhZCập nhật 4484
RR 1 Software signal with Pivots/Previous day high/Previous day low combined with RR2 for better results.Chỉ báo Pine Script®của RushabhZCập nhật 1111
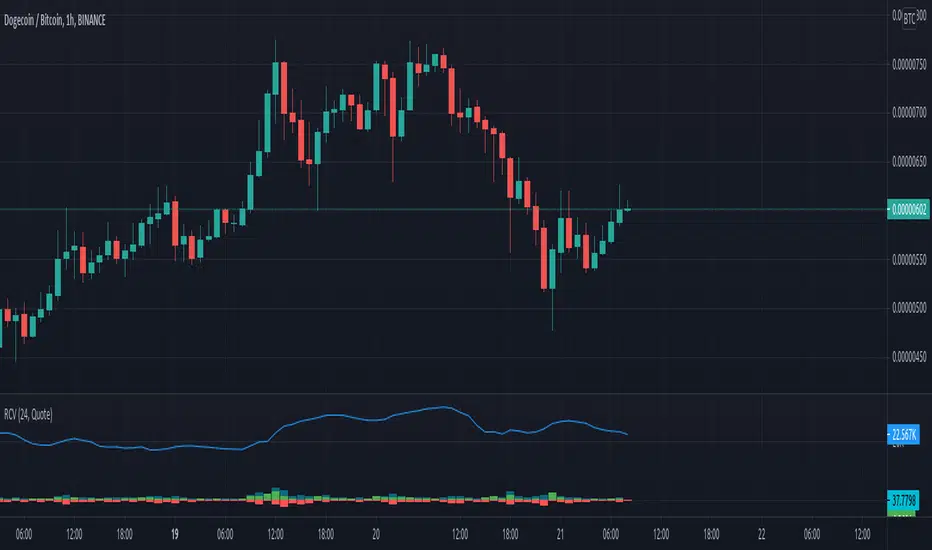
Rolling Cumulative VolumeThis indicator show a simple rolling cumulative volume. A field is specified. Then all last volume indicators are summed. For example it could calculate last 24h Volume if you use the 1h bars and set the length for 24. Chỉ báo Pine Script®của i_hodlCập nhật 33124
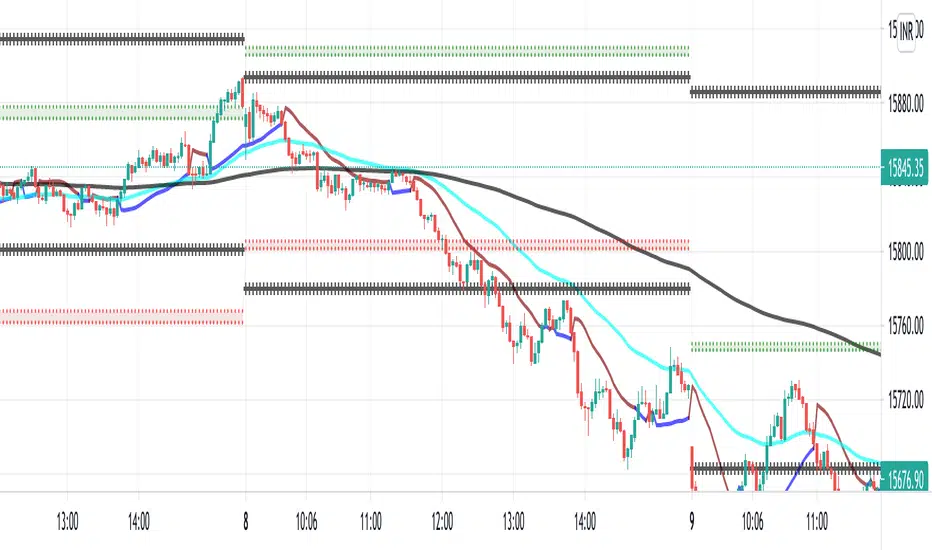
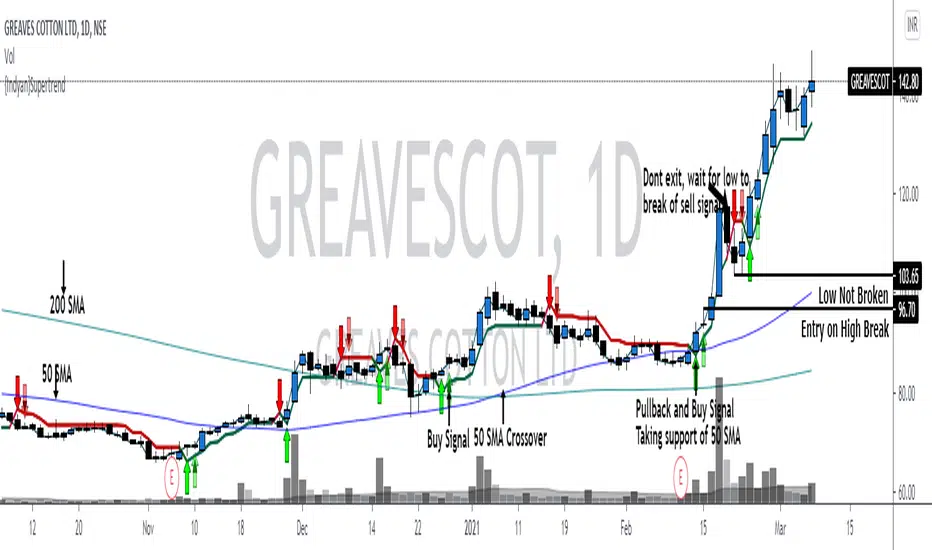
{Indyan}SupertrendHello trader friends, A very simple but effective supertrend startegy which help u to get good RR. It is combination of 3 supertrend values with sma crossover. Enrty at pullback after sma crossover , exit only if sell signal low is broken. I hope it will help my trader friends. Love Indyan Chỉ báo Pine Script®của Indyan66332
Buy_Sell_Pressure_v0.62This is a script that I've been using for some time, which covers Volume for me. It shows the total volumes in typical Column format, however this script attempts to suss out the details of WHERE that volume went (buying or selling), how EFFECTIVE that volume was at moving the price, and finally a COMPARISON of Buy vs. Sell volume MA's showing us the average buying and selling pressure over time, to assist us with determining the timing of a reversal. The oscillator portion shows us the Volume Columns and the MA's with shadow or offset MA's to detect reversals and crossovers of self, and on the bar/candle chart the bars are colored according to which volume is more dominant at that time. Alert conditions are available for the following events: - Buying Crosses over Selling (Bar Color Change) - Selling Crosses over Buying (Bar Color Change) - Sell Pressure Cross Up / Down (Single MA Direction Change) - Buy Pressure Cross Up/ Down (Single MA Direction Change)Chỉ báo Pine Script®của bgeraghty27
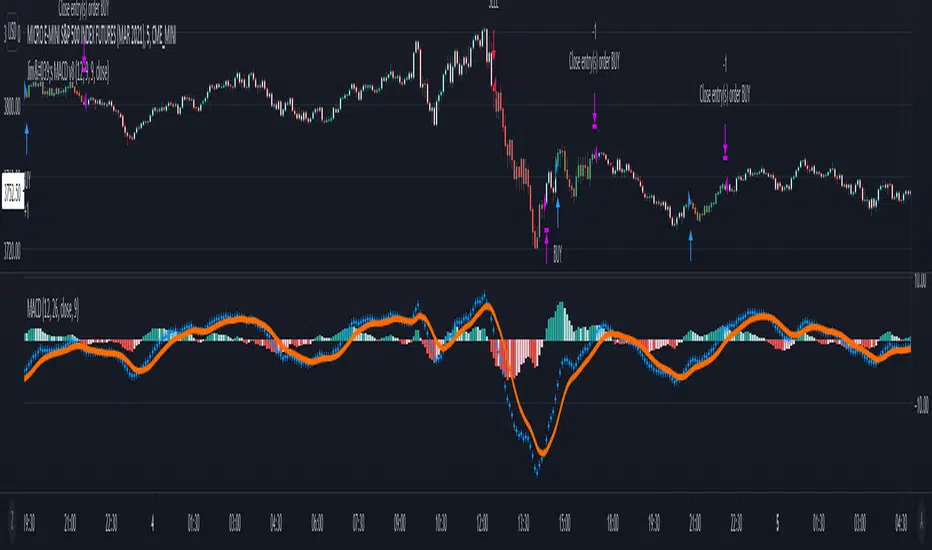
Jim's MACDMACD Buy/Sell Strategy Filters bearish crossovers above the 0 line and bullish crossovers below. Uses 34 ema to further filter the trades and take only longs above and only shorts below. Apply at least 2:1 risk to reward ratio to account for losing trades. Trade at own risk!Chiến lược Pine Script®của yimbobzCập nhật 22297
MA200W buy sell BTC ColoredA script to help you plan your entrances and exits with beautiful colors for BTC. It just helps to better highlight the gap between the start of the week and the end. It only work on Weekly. Info : Blue ... you can wait, enjoy your life Green is when you buy Yellow when you enter bull market Orange is when you begin to take care of next week Red when you begin to sell low part White, if while a week you see white you can sell bigs bags, if it end with White you can close majors positions Warning White may not appear, if second week after first Red week is not White you can sell large position Good luck and take a breathChỉ báo Pine Script®của Bioubiou1818892
[astropark] Progressive VWAPDearDear Followers, today another awesome Analysis Tool, that you can use in your trading journey: Progressive VWAP ! If you love vwap, you will love this indicator, as it calculates some special "progressive" / "evolving" vwap levels: daily vwap named dvwap 2D vwap named 2dvwap 3D vwap named 3dvwap weekly vwap named wvwap 2W vwap named 2wvwap Monthly vwap named mvwap Quarterly vwap named qvwap Yearly vwap named yvwap You can: choose which progressive vwap to show and which to hide change each line color / thickness / display style (solid or dashed) choose to show or hide labels and change their size Why such indicator should be helpful? How can I use it to do profit? In multiple ways: when a lower timeframe crosses an higher timeframe progressive vwap, you know sentiment is getting bullish and viceversa if the cross is downwards price tends to bounce on such progressive vwaps: the higher the timeframe, the more probably the bounce is as well as the magnitude of the breakout of the level This indicator works on every timeframe, market and pair. As I always say, all tools are great if you use them correctly: this is not the "Holy Grail", so always use proper money and risk management strategies. This is a premium indicator , so send me a private message in order to get access to this script. Chỉ báo Pine Script®của astropark29
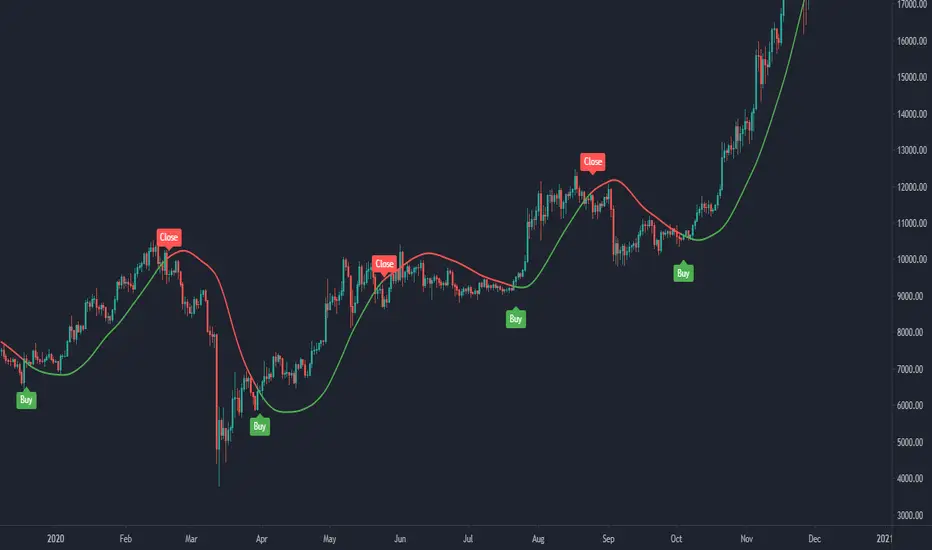
Buy and Hold entry finder StrategyHello everyone! I proudly present the backtest Strategy Script for my "Buy and Hold entry finder" Script. It basically shows you the outcome, if you would use my indicator in the past. The buy signals are limited to 1 order per month. Order Size: Allows you to choose, how much money you want to invest per month. (Please consider, it will only invest an x amount per Order, but it will not stack the amount you did not invest in an previous month ) (Example in my indicator) Pyramiding: Just regulates, how often you can open an position. Commission: Here you can set how much it will cost to open an position at your broker. I coded a feature that allows you to set a Start Date and an End Date for your backtest. In the end of the backtest the script closes all positions. If you got any question, feel free to ask in the comments or send me a message. Sincerely, RS Titan. Chiến lược Pine Script®của Embit0one55318
H.A B.S3 Do you prefer lower time frames starting from 3, 5, 15 and 30 minutes? Then, this Script is for you. Applicable to any type of Market, it can also be applied to higher time frames. Enjoy!!Chỉ báo Pine Script®của janeedward444466117
Betelgeuse-Good entry/exit zoneHello everyone and welcome! This is the my first indicator and also the first version of Betelgeuse script,I hope you will like it. The indicator was designed to be used on cryptocurrencies The idea is to be able to identify good entry and exit points in the market, traders often try to identify the minimum or maximum points and this is why Betelgeuse was born. Betelgeuse should be combined with your analysis and other indicators to find good entry and exit zones and not a precise point.Obviously the more the indicator will be used over long time frames the more accurate the signals will be. You can decide to wait for a good signal from the RSI or from the MACD and add up the Betelegeuse confirmation for a good entry or exit from the market. The MA based indicator will give you an idea of the direction of the medium term trend. Direct message me for acces. Chỉ báo Pine Script®của betelgeusescript3333123
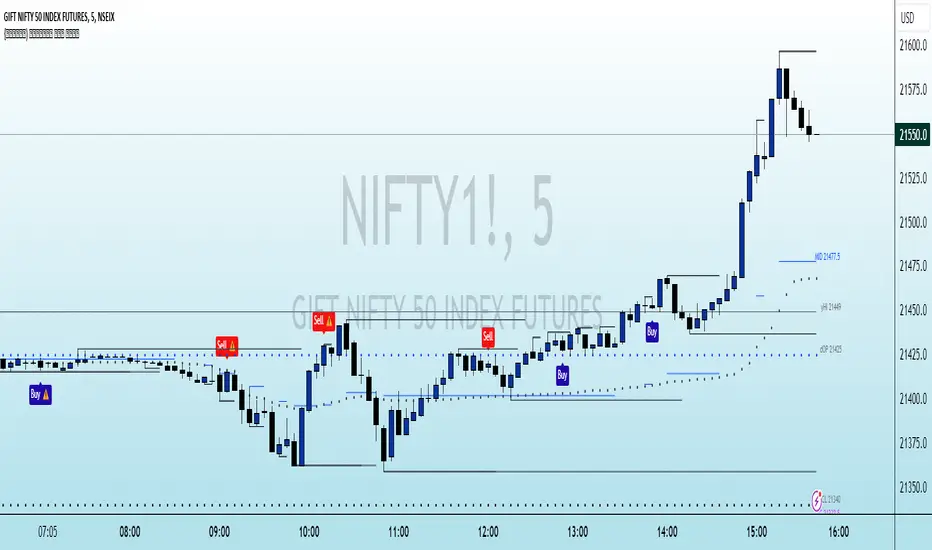
[DS]Entry_Exit_TRADE.V01-StrategyThe proposal of this script is to show the possible trading points of BUY and SELL based on the 15-minute chart of the Nasdaq Future Index. The start point of the strategy was schedule for 2021/01/01 and until the time of this publication (2021/01/31), for 1 index contract the results presented area a Gross Profit of 2.97% with a Net Profit of 1.35%. █ FEATURES The indicator shows on the graph the position of the MACD and TSI indicators that are the places of strength among Buyers and Sellers. It's possible to observe a sharp fall or rise in the price of these positions. On the current candle, a label is displayed containing the value of the William %R Mod indicator, which will display the OverBought position (dark red) and OverSold position (dark green). The other colors like light red and green are the regions where the price makes the decision of which direction to go. There are also other indicators: a) The positions of the BUY (light green) and SELL areas (light red); b) The label with the position of BUY (dark green) and SELL (dark red) with the line that connects these points; c) DEMA 72 (orange); d) EmaOchl4 in the color green for BULL and red for BEAR market; e) Pivots high and low f) Maximum (purple light) and minimum areas (blue light) █ FUNCTIONS AND SETTINGS The indicator uses the following functions: (1) DEMA - Double Exponential Moving Average (08,17,34, 72) (2) ema () - Exponential Moving Averge (72, ohlc4) (3) plot() (4) barcolor() (5) cross() (6) pivots () (7) William R% Md (OverBought = -7, OverSold=-93) (8) Maximum and Minimum Value (9) fill() (10) macd () - Moving Average Convergence Divergence (Fast Lengt=12, Slow Length=26, Source=close, Signal Smoothing=9) (11) tsi() - Trading Strenght Indicator==> Índice de Força Real ( IFR ) (Long Length=72, Short Length=17, Signal Length=17) (12) Buy and Sell TRADE Points █ PERFORMANCE AND ERRORS The positions of BUY and SELL points are defined through the crossing of the Dema 34 candles with the Ema Ohcl4. As it is an indicator, it can present different positions from de market direction. Thus there is a need to observe the direction of the market in order to verify whether the indicate decision is really acceptable. The decision to BUY or SELL an asset must be well studied to avoid financial losses. The indicator will only help you in this decision, is your responsibility the decision of entering or leaving an asset. █ THANKS TO PineCoders for all they do, all the tools and help they provide, and their involvement in making a better community. All the PineCoders, Pine Pros, and Pine Wizards, people who share their work and knowledge for the sake of it and helping others, I'm very happy and grate full indeed. █ NOTE If you have any suggestions for improving the script or need help using it, please send a message in the comments Chiến lược Pine Script®của DalmarSantos2020 2 K
[FTA] Double Responsive Price FilterThis is a very special indicator which uses a series of double filtering methods to filter out bad price data. Each filter uses a very complex mathematical formula to obtain the data, based on the Wave Function, then applies initial signal filtering on the output. The output of each filter is then compared to each other, and the output of this stage goes through another signal filtering process which is used in aviation industry (NASA) to track objects and keep them under radar! The final output is then squeezed through a truncated bandpass filter and plotted as two colors. This is to ensure a very quick and responsive entry and exit signal without any lagging, and also to ensure that the trader stays in the trade as long as profitable! Buy when color is aqua. Sell when color is fuchsia. Chỉ báo Pine Script®của UnknownUnicorn11161970Cập nhật 5557
Precise_SignalThis signal combines a portion of Chris Moody's 2014 SlingShot and my 2017 MTF Indicators. Both of our prior scripts over indicated Buy and Sell Points. This signal indicates a buy or sell point much less than our prior scripts did but with absolute precision. I would say it is 100% accurate, but that is because I am yet to find a timeframe and symbol where the Buy signal failed to see the equity move up or the Sell signal failed to see the equity move down over the next 5 bars. I have tested 2000 charts so far. To be safe, I would rather state this indicator is accurate nearly 100% of the time. The indicator is made up of 2 main portions and both of them have to agree on a buy or sell in order to indicate such with a vertical green or maroon bar beneath the chart. If there is a failure to agree, nothing is signaled. Indicator 1 combines a stochastic of a 3 hour chart and a daily chart to determine when the stochastics are in agreement on direction. When there is agreement, both of them MUST cross from a buy state to a sell state and vice versa at exactly the same time. This is difficult to achieve and it is already rare for this occurrence to produce a signal. When a signal is produce it is combine with Chris Moody's 2014 SlingShot Indicator which conservatively determines Buy and Sell signals based on EMAs and market direction. Signals from his SlingShot are infrequent. BUY Signal When my MTF signals Buy at the same time that the SlingShot signals a Buy, a vertical green bar will appear in the window containing this script. The vertical bar is based on the close price of the equity and is only final when the close price is final. A BUY signal means the equity will move up potentially as early as the next bar and achieve a higher value from the close price on the signal bar. SELL Signal Likewise, a sell signal from the MTF at the same time as a sell signal from the SlingShot will create a maroon bar in the window containing this script. The vertical bar is based on the close price of the equity and is only final when the close price is final. A SELL signal means the equity will move down potentially as early as the next bar and achieve a lower value from the close price on the signal bar. The default values for this script are hard-coded into this script. You can edit any of the value you would like to play with other timeframes, stochastic, and moving average lengths. I have played with these values and have hard-coded the ones that are most accurate. Please let me know if you find others that work. Hopefully this becomes an extra tool in your technical trading toolkit.Chỉ báo Pine Script®của StockSignaler1818877
© 2021 - SwingSwiss - BUY/SELL© 2021 - Dan Chetrit - BUY/SELL" Product Description: The Indicator combines the Relative Strength Index, Moving Average Convergence Divergence as well as Volume and Stochastic. The idea is to cross multiple data and signals from these indicators in order to trigger buy when crossing above and sell when crossing below the signal line. The idea was also to find a mathematical function that will trade the convergence of these lines trying to predict the market. This indicator works better on a daily chart. The indicator works long and short but is better for long positions. The script also includes an EMA 50 line as well as an overbought/oversold RSI background. The indicator can be used on every type of market: indices, stocks, cryptocurrencies, currencies, and others but, according to backtesting, it works better for the US stock market. This study is not a guaranteed profit. You should backtest or trade virtual money before using this study on your real portfolio, as it is intended to be a tool. Do your research and learn about the company you are investing in. Disclaimer: Trading and investing in the financial markets involves substantial risk of loss and is not suitable for every investor. All trading strategies are used at your own risk. Please send me a private message or comment on TradingView to gain access to the script.Chỉ báo Pine Script®của WiseStratCập nhật 271271374
{INDYAN} Perfect Buy SellA simple indicator based on candle stick strength, with cpr,vwap and support resistance... search for buy sell signal on 15 min timeframe and wait for second candle to close above/below of signal candle. Cpr pivots would act as support and resistance. Entry should only be based on 15 mins or higher timeframe. 3 and 5 mins timeframe for profit booking. No supertrend or atr used in this indicator. This show how a single candle can give u good trade... Love Indyan * tested on Banknifty and nifty , kindly share ur experiences on other scrips. ThanksChỉ báo Pine Script®của IndyanCập nhật 3636977
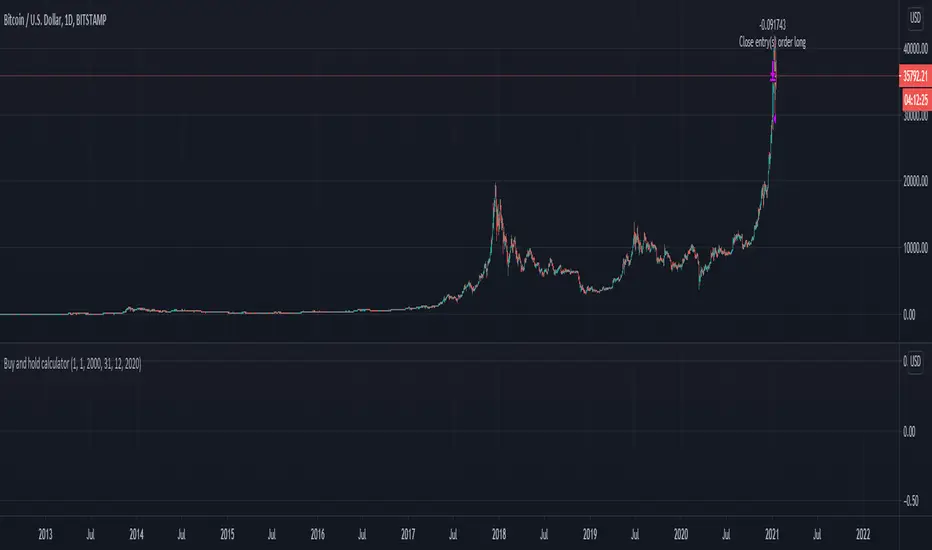
Buy and hold calculatorThis is a simple buy and hold calculator. You have an initial date and once that dated it passed it will sell the product that was bought initially. This strategy buys and sell 100% of the initial volume. Chiến lược Pine Script®của SoftKill2133167
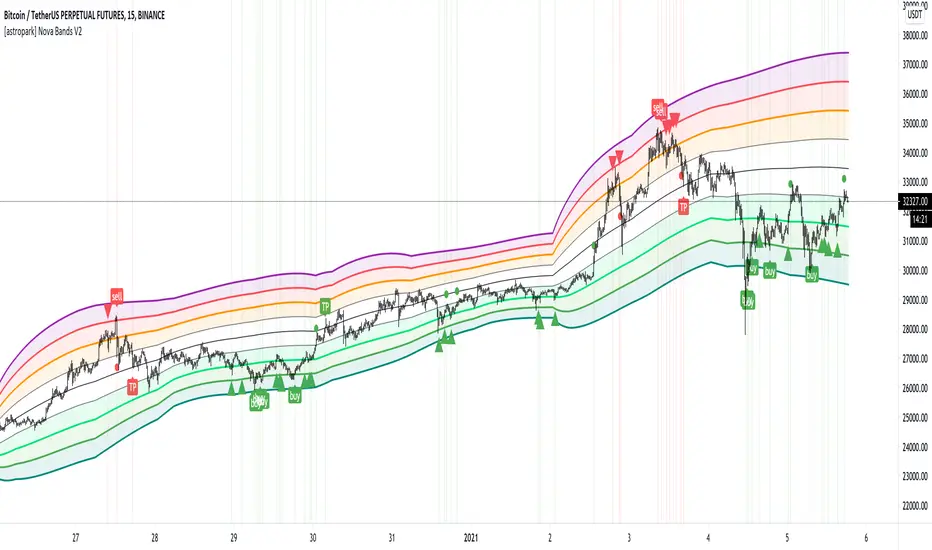
[astropark] Nova Bands V2Dear followers, today an upgraded version of Nova Bands indicator, here below the previous V1 This is a great analysis and scalping tool for day trading on low timeframes (5-15 minutes) or to plan swing trades on hourly timeframes. It can be used also on high timeframes just for analysis current market trend. The indicator plots a series of levels which create a nice bands flow. The slope of levels make you easily understand when price is in consolidation, in uptrend or in downtrend. The golden rule is always the same: buy low and sell high . This indicator plots: 3 "price is low here" levels (from dark green to light green) 3 "price is average here" levels 3 "price is high here" levels (from purple to orange) You can find more details on how to use the indicator in the description of V1. Please, always remember that: when bands are flat, price is in consolidation and this is best condition to trade with nova bands when bands get nearer and nearer is called "Bands Squeeze": price is next to a main breakout move, volatility is coming! The basic improvement in V2 is a different way to calculate the bands based on different timeframe resolution, default is setup to daily timeframe for example. A trader who wants to be a winner must understand that money and risk management are very important, so manage your position size and always have a stop loss in your trades. This is a premium indicator , so send me a private message in order to get access to this script. Chỉ báo Pine Script®của astropark101044
PRIO Trend FollowingWith this indicator you can generate automatic BUY-SELL signal on your chart and trade with an ease. This is a trend following indicator based on HIGH-LOW ema channel. You can choose ema period from the input menu on settings, and add to your favourite time frame. Chỉ báo Pine Script®của Prio19891010102
Escaping of Rate from Avarage By Mustafa OZVER StrategyI simulated the EoRfA indicator with the gold price For details about the indicator, visit my profile on tradingview For Simulation, with default settings, we order if Eorfa > 1 and change(eorfa) < 0 sell if Eorfa < -1 and change(eorfa) > 0 buy And we got - 2.49 % profit - 74 % profittable order from all But only this value can not guarantee good results for trading. BE CAREFUL Chiến lược Pine Script®của Mustafaozver96
Long Short | Buy Sell IndicatorThis indicator is based on an adaptive RSI. You can change one setting, the period. The period means, how many past bars are included in the calculation of the indicator. Be aware, that the period needs to be the same or less than the available past bars of your trading pair. The indicator works on every timeframe. The past data bars are repainted, but the real time indicator should just give you valid buy and sell alarms. The indicator includes: - buy / long signals - sell / short signals - buy and sell prices - results of trades - alarms for buy and sell Please try it out at first with no money or something. Just set alerts for buy and sell and check the performance of the indicator afterwards, maybe it is a good strategy for you with your settings. Greetings, snurkChỉ báo Pine Script®của snurk1717 1.6 K
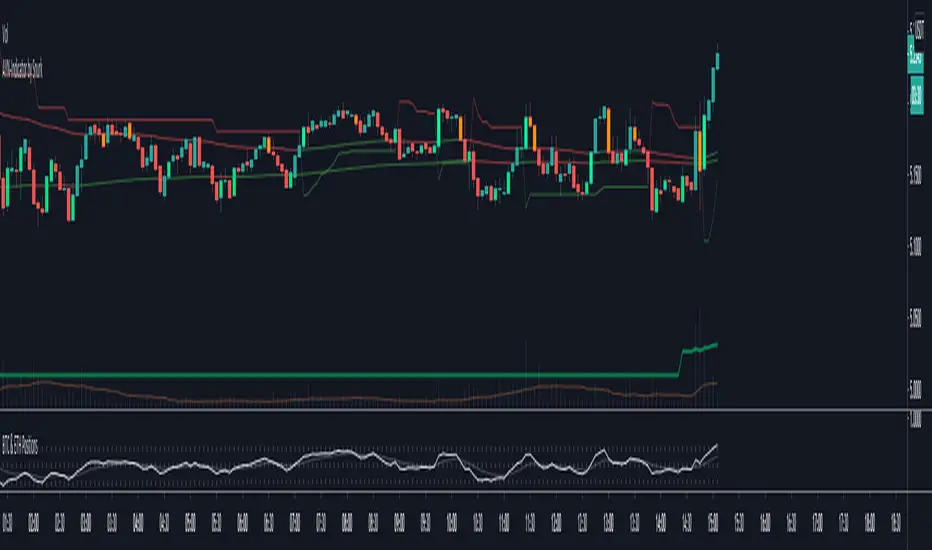
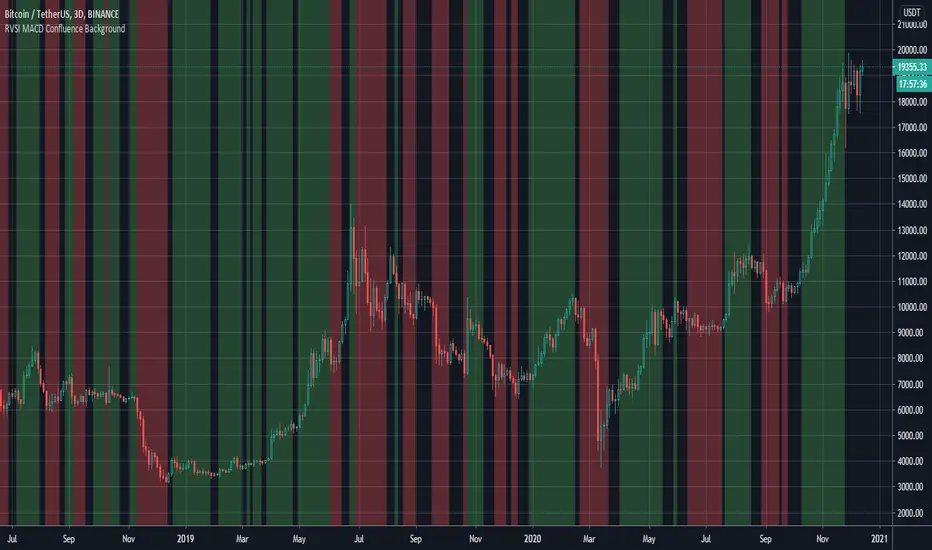
RVSI & MACD Confluence BackgroundThis indicator colors the background in vertical (green/red) stripes to indicate if the current trend is possibly bull / bear A region where the background is not colored indicates that the present trend can not be identified The algo combines the RVSI (Relative Volume Strength Index {ref fract} ) and the MACD The Relative Volume Strength Index has been adapted to include 2 moving averages, one fast and one slow This same fast slow lookback length is applied to the MACD for simplicity What's interesting is that there is a very strong confluence between the MACD and RVSI, as the MACD is obtained from 'price action only' and the RVSI from the 'volume only' So a break in confluence of these two might suggest that the current trend is weakening in confidence or can not be clearly identified Generally, a green background means consider going long ie price trend is rising A red background means consider going short ie price trend is falling An absent background color means - consider exiting current trade or wait to get into a new trade Best Regards, MoonFlag - and a special thanks/mention to 'fract' for the RVSI algo this is derived fromChỉ báo Pine Script®của MoonFlag11215
Trend Trader Buy/Sell SignalsTrend Trader The code is open source, what it uses to print signals is MACD cross and ADX. Bar colors change in relation to where price is according to the 50 day MA. The MA ribbon is used for visualizing trend and using it for dynamic support/resistance. The ribbon is comprised of the 50 day and 100 day MAs. Main reason to publish this script is because some like to jumble up scripts together slap some moving averages on it to "follow trend" and then label it an algorithm, market it and sell it to people online. No single system will work 100% of the time, do you due diligence in anything you are interested in buying. Plenty of free scripts in the TV library that can do you justice when trading. Chỉ báo Pine Script®của UnknownUnicorn1946597Cập nhật 2020 3.2 K