Adaptive ATR% Grid + SuperTrend + OrderFlipDescription:
This indicator combines multiple technical analysis tools to identify key price levels and trading signals:
ATR% Grid – automatic plotting of support and resistance levels based on current price and volatility (ATR). Useful for identifying potential targets and entry/exit zones.
SuperTrend – a classic trend indicator with an adaptive ATR multiplier that adjusts based on average volatility.
OrderFlip – identifies price reversal points relative to a moving average with ATR-based sensitivity, optionally filtered by OBV and DMI.
MTF Confirmation – multi-timeframe trend verification using EMA to reduce false signals.
Signal Labels – "LONG" and "SHORT" labels appear on the chart with an offset from the price for better visibility.
JSON Alerts – ready-to-use format for automated alerts, including price, SuperTrend direction, Fair Zone, and ATR%.
Features:
Fully compatible with Pine Script v6
Lines and signals are fixed on the chart, do not shift with new bars
Configurable grid, ATR, SuperTrend, and filter parameters
Works with MTF analysis and classic indicators (OBV/DMI)
Usage:
Best used with additional indicators and risk management strategies. ATR% Grid is ideal for both positional trading and intraday setups.
перевод на русский
Описание:
Этот индикатор объединяет несколько методов технического анализа для выявления ключевых уровней цены и сигналов на покупку/продажу:
Сетка ATR% (ATR% Grid) – автоматическое построение уровней поддержки и сопротивления на основе текущей цены и волатильности (ATR). Позволяет видеть потенциальные цели и зоны входа/выхода.
SuperTrend – классический трендовый индикатор с адаптивным множителем ATR, который корректируется на основе средней волатильности.
OrderFlip – определение моментов разворота цены относительно скользящей средней с учетом ATR, с возможностью фильтрации по OBV и DMI.
MTF-подтверждение – проверка направления тренда на нескольких таймфреймах с помощью EMA, чтобы снизить ложные сигналы.
Сигнальные метки – на графике появляются "LONG" и "SHORT" с отступом от цены для наглядности.
JSON Alerts – готовый формат для автоматических уведомлений, включающий цену, направление SuperTrend, Fair Zone и ATR%.
Особенности:
Поддержка Pine Script v6
Линии и сигналы закреплены на графике, не двигаются при обновлении свечей
Настраиваемые параметры сетки, ATR, SuperTrend и фильтров
Совместимость с MTF-анализом и классическими индикаторами OBV/DMI
Рекомендации:
Используйте в сочетании с другими индикаторами и стратегиями управления риском. Сетка ATR% отлично подходит для позиционной торговли и интрадей.
ATR% Grid – automatic plotting of support and resistance levels based on current price and volatility (ATR). Useful for identifying potential targets and entry/exit zones.
SuperTrend – a classic trend indicator with an adaptive ATR multiplier that adjusts based on average volatility.
DMI

TCP DMITCP DMI - Advanced Technical Indicator
This advanced DMI (Directional Movement Index) indicator enhances the traditional DMI by adding intelligent dynamic support and resistance levels based on historical price action analysis.
KEY FEATURES:
1. Standard DMI Components:
- DI+ (Directional Indicator Positive): Measures upward price movement
- DI- (Directional Indicator Negative): Measures downward price movement
- ADX (Average Directional Index): Measures trend strength
- Middle line at 20 for reference
2. Dynamic Support & Resistance Levels:
The indicator automatically identifies the most significant support and resistance levels by analyzing the last 400 candles (customizable) and detecting where DI lines have been rejected most frequently.
TWO TIERS OF LEVELS:
A) Normal Levels (Solid Lines):
- Support: Below 15
- Resistance: Above 25
- Style: Solid lines with 60% transparency
- These represent moderate support/resistance zones
B) Strong Levels (Dashed Lines):
- Strong Support: Below 10
- Strong Resistance: Above 30
- Style: Dashed lines with 40% transparency (more visible)
- These represent critical support/resistance zones
3. Intelligent Display Logic:
- When DI is ABOVE 20: Shows resistance levels (where price might face selling pressure)
- When DI is BELOW 20: Shows support levels (where price might find buying support)
- Each DI line (+ and -) has its own color-coded support/resistance levels for easy identification
4. Color Coding:
- DI+ levels use GREEN (customizable)
- DI- levels use RED/ORANGE (customizable)
- Support/Resistance lines match their respective DI colors but with reduced opacity
- This makes it instantly clear which DI the support/resistance belongs to
5. Rejection Detection Algorithm:
The indicator scans historical data to find peaks and troughs at specific levels, counting how many times price was rejected at each level. The level with the most rejections becomes the displayed support or resistance.
CUSTOMIZABLE PARAMETERS:
- ADX Smoothing: Default 14
- DI Length: Default 14
- Lookback Period: 400 candles (range: 50-500)
- Line Length: 15 candles forward + 15 candles back = 30 candle span
- DI+ Color: Customizable (default green)
- DI- Color: Customizable (default red)
- ADX Color: Customizable (default blue)
- Normal S/R Transparency: Default 60%
- Strong S/R Transparency: Default 40%
HOW TO USE:
1. Trend Identification:
- When DI+ crosses above DI-: Potential uptrend
- When DI- crosses above DI+: Potential downtrend
- ADX above 25: Strong trend
- ADX below 20: Weak trend or ranging market
2. Support/Resistance Trading:
- Watch for price reaction when DI approaches displayed support/resistance levels
- Solid lines = moderate levels
- Dashed lines = strong levels (more significant)
- The more rejections at a level, the more significant it becomes
3. Entry/Exit Signals:
- Entry: When DI bounces off support (below 20) or resistance (above 20)
- Exit: When DI breaks through major support/resistance levels
- Strong levels (dashed) are more reliable for major decisions
ADVANTAGES:
✓ Reduces chart clutter by only showing relevant levels based on current DI position
✓ Automatically adapts to changing market conditions
✓ Color-coded for instant visual recognition
✓ Two-tier system helps prioritize trading decisions
✓ Historical rejection analysis provides data-backed levels
✓ Fully customizable to match any trading style
BEST USED FOR:
- Swing trading
- Trend following
- Support/resistance trading strategies
- Identifying potential reversal zones
- Confirming breakout validity
- Risk management (stop-loss placement)
This indicator combines the power of traditional DMI with smart support/resistance detection, giving traders a comprehensive tool for technical analysis without overwhelming the chart with excessive information.

MTF Advanced DMI [NexusSignals]The MTF Advanced DMI is a multi-timeframe (MTF) enhancement of the classic Directional Movement Index (DMI) and Average Directional Index (ADX) indicator. It provides traders with insights into trend strength, direction, and momentum across multiple timeframes simultaneously. This version of DMI extends the single-timeframe analysis by incorporating two higher timeframes, allowing for better alignment of trends (e.g., confirming a short-term signal with longer-term context). It includes visual plots, a customizable data table showing MTF data, and expanded alert conditions for trend changes, consolidations, and reversals. Ideal for multi-timeframe strategies, trend confirmation, or avoiding false signals in volatile markets.
Key features include:
Multi-Timeframe Analysis: Displays DMI/ADX data for the current chart timeframe, plus two user-defined higher timeframes (e.g., 4H and 1D).
A trend strength metric that quantifies bullish/bearish dominance on each timeframe.
A dynamic table summarizing real-time MTF values, with color-coded signals, arrows, and buy/sell pressure percentages.
Visual fills and arrows for intuitive trend reading.
Built-in alerts for key events, including MTF-specific conditions (note: higher TF alerts may repaint due to live candle calculations via request.security).
How It Works
The indicator calculates DMI/ADX on three timeframes: the current chart TF, a mid-higher TF (default: 4H), and a highest TF (default: 1D).
For each:
+DI (Plus Directional Indicator): Upward movement strength.
-DI (Minus Directional Indicator): Downward movement strength.
ADX: Overall trend strength.
Trend Strength: ((+DI - -DI) / (+DI + -DI)) * ADX – positive for bullish, negative for bearish.
Buy/Sell %: Percentage of buyer/seller control in the candle based on HLC.
Plots focus on the current TF:
Strength Histogram: Color-coded (green bullish, red bearish).
ADX Line: White, with direction arrows.
+DI/-DI Lines: Green/red, with fills above 15 for strong trends.
Horizontal lines at 15 (consolidation) and 25 (strong trend).
The table (optional) shows data for the current timeframe candle, previous current timeframe candle, and the two higher TFs (if different from current), enabling quick cross-TF comparisons.
Inputs
General Settings:
DMI Length (default: 14): Period for +DI/-DI.
ADX Smoothing (default: 14): ADX period.
ADX Consolidation Threshold (default: 15): Low ADX suggests sideways.
ADX Stronger Trend Threshold (default: 25): High ADX indicates strong trends.
Higher Timeframe (default: 240/4H): Mid-level TF for MTF analysis.
Highest Timeframe (default: 1D): Top-level TF for broader context.
Threshold for Strong Bullish/Bearish DMI Strength (defaults: 10 / -10): For strength alerts.
Table Settings:
Show Table? (default: true): Toggle table visibility
Table Text Color, Header Color, Text Size (default: small)
Position (default: middle_right): Customize for your chart
Interpretation
Bullish Alignment: +DI > -DI across TFs, rising +DI (↑), Strength > 0 (green), Buy% > Sell%. Stronger if ADX > 25 on higher TFs.
Bearish Alignment: -DI > +DI, rising -DI (↑), Strength < 0 (red), Sell% > Buy%. Confirm with rising ADX on MTF.
Consolidation: +DI/-DI < 20 and ADX ≤ 15 (blue fill). Check if higher TFs show the same for range-bound confirmation.
Crossovers: +DI above -DI for bullish; reverse for bearish. MTF agreement reduces false signals.
Fills: Highlight dominant trends above 15 (green bullish, maroon bearish).
MTF Insight: Use the table to spot divergences (e.g., bullish current TF but bearish on daily) for potential reversals.
Combine with support/resistance or other momentum oscillators like macd, rsi, stochastic for robust strategies. Test on various assets and TFs to find the best settings that suit your trading style.
Alerts
Includes 20 alert conditions, with MTF extensions (higher TF alerts may repaint – use with caution for live trading):
Strength crossing 0 or bullish/bearish thresholds (on current and higher TFs).
+DI/-DI crossovers (bullish/bearish) on current TF.
ADX above strong threshold.
+DI/-DI above 25 or below 15.
Consolidation detection.
MTF-specific: Strength changes on higher TFs (e.g., "Strength Above Bullish Threshold on TF1").
Configure in TradingView by selecting from the alert dropdown.
Usage Tips
Select higher TFs that suit your strategy (e.g., 1H chart with 4H and Daily for day trading).
Use the table for at-a-glance MTF alignment without switching charts.
Customize appearance to avoid clutter on busy setups.
Backtest thoroughly, especially noting potential repainting on higher TFs.

Atlantean Sideways / Range Regime DetectorPurpose
When using trend based indicators, you can skip the false signals when there is a sideways action, protecting you from the false signals.
Flags likely sideways/range phases using three checks:
Weak trend (ADX from DMI)
Price compression (Bollinger Band Width, normalized)
Low volatility (NATR = ATR/Price%)
Logic
isSideways = (ADX < adxThresh) AND (bbNorm < 0.25) AND (NATR < natrMax)
When true: bars + background turn teal and a provisional Range High/Low (rolling rangeWin) is drawn.
Key Inputs
DMI: diLen(22)
Optimized for 15 mins Bitcoin, could change it to 14 for more general approach
ADX: adxSmooth(14), adxThresh(18)
Volatility: lenATR(14), natrMax(1.8)
Visuals: rangeWin(20), bar/range toggles
Quick Tuning
More signals: raise adxThresh to 20–25, raise natrMax to 2.5–4.0, increase BB cutoff by editing bbNorm < 0.25 --> 0.35–0.50.
Smoother range lines: increase rangeWin to 30–40.
Use Cases
Mean reversion inside teal ranges.
Breakout prep when price closes outside the drawn range after teal ends. Could be used as a signal although not suggested.
Filter trend systems: skip trades when sidewaysCond is true. This is the main purpose, for it to be combined with trend based indicators, like Supertrend.
Alert
“Sideways Detected” triggers when isSideways is true.
Script could be expanded upon your requests.

DMI Toolbox StrategyThe Directional Movement Index (DMI) was originally developed by J. Welles Wilder Jr. in 1978. Wilder introduced the DMI along with the Average Directional Index (ADX) in his book, “New Concepts in Technical Trading Systems,” which became a foundational reference for technical analysis.
The indicator can offer a myriad of signals for building a trading strategy. In an effort to provide the user with a meaningful way to evaluate these signals, this DMI Toolbox Strategy offers the chance to back-test various combinations and permutations of DMI signals on long trades. By default it will open a long position on the +DI (upward movement) crossing above the -DI (downward movement). By default, It exits long positions when the ADX (trend strength) reverses.
Suggested Use
Try a wide variety of long entry and exit signals across many different timeframes to see what is most effective for the item you wish to trade. There is a table in the upper right corner that will give a quick view of which signal is dominant across 5 timeframes, based on your current settings. Adjust the pyramidding, slippage, and commission values to more closely match your situation.
Visual Helpers
The DMI indicator has been altered to include a smoothed version of the ADX, as well as a colored background to show which signal is dominant (+DI or -DI). Small up arrows call your attention to ADX crossovers that may indicate a significant threshold in trend strength.

3X Sniper BotThe 3X Sniper Bot is built for traders who demand clarity, precision, and confidence in their decision-making. This tool isn’t just another crossover script—it’s a full multi-confirmation system that helps you spot momentum shifts, identify high-probability entries, and filter out the noise.
🔥 Why traders love it:
Triple confirmation engine: Only fires when multiple conditions align, reducing false signals.
Strong vs. Regular vs. Possible setups: Get nuanced alerts that distinguish between high-conviction moves and early opportunities.
Both Buy & Sell coverage: Stay prepared in any market environment.
Smart flexibility: Works across strict or sequenced signal modes, giving you control over how conservative or aggressive you want to trade.
Visual clarity: Clean chart markers and optional regime shading keep your screen easy to read at a glance.
Alert-ready: Set and forget—never miss a move with real-time TradingView alerts.
This indicator was designed to make complex multi-factor analysis simple, giving traders a clear visual edge without clutter or guesswork. Whether you scalp intraday or swing multi-day, the 3X Sniper Bot adapts to your style.

Directional Movement Index (DMI) + AlertsThis is a Study with associated visual indicators and Bullish/Bearish Alerts for Directional Movement (DMI). It consists of an Average Directional Index (ADX), Plus Directional Indicator (+DI) and Minus Directional Indicator (-DI).
Published by J. Welles Wilder in 1978 for use with currencies and commodities which are typically more volatile than stocks and have stronger trends.
Development Notes
---------------------------
This indicator, and most of the descriptions below, were derived largely from the TradingView reference manual. Feedback and suggestions for improvement are more than welcome, as well are recommended Input settings and best practices for use.
tradingview.com/chart/?solution=43000502250
Strategy Description
---------------------------
ADX defines whether or not there is a trend present; +DI and -DI compliment the ADX by taking direction into account. An ADX above 25 indicates a strong trend, and a Bullish alert is subsequently triggered when +DI is above -DI and a Bearish alert when -DI is above +DI.
Note that the Bullish or Bearish crossover alert will only trigger if ADX is simultaneously above 25 during the crossover event. If ADX later rises to 25 and +DI is still greater than -DI, or -DI greater than +DI, then a delayed alert will not trigger by design.
Basic Use
---------------------------
Acceptable DMI values are up to the trader's interpretation and may change depending on the financial instrument being examined. Recommend not changing any default values without being first familiar with their purpose and impact on the indicator at large.
Confidence in price action and trend is higher when two or more indicators are in agreement -- therefore we recommend not using this indicator by itself to determine entry or exit trade opportunities.
Recommend also choosing 'Once Per Bar Close' when creating alerts.
Inputs
---------------------------
ADX Smoothing - the time period to be used in calculating the ADX which has a smoothing component (14 is the Default).
DI Length - the time period to be used in calculating the DI (14 is the Default).
Key Level - any trade with the ADX above the key level is a strong indicator that it is trending (23 to 25 is the suggested setting).
Sensitivity - an incremental variable to test whether the past n candles are in the same bullish or bearish state before triggering a delayed crossover alert (3 is the Default). Filter out some noise and reduces active alerts.
Show ADX Option - two visual styles are provided for user preference, a visible ADX line or a background overlay (green or red when ADX is above the key level, for bullish or bearish, and gray when below).
Color Candles - an option to transpose the bullish and bearish crossovers to the main candle bars. Can be turned off in the Style Tab by deselecting 'Bar Colors'. Dark blue is bullish, dark purple is bearish, and the black inner color is neutral. Note that the outer red and green border will still be distinguished by whether each individual candle is bearish or bullish during the specified timeframe.
Indicator Visuals
---------------------------
Bullish or Bearish plot based on DMI strategy (ADX and +/-DI values).
Visual cues are intended to improve analysis and decrease interpretation time during trading, as well as to aid in understanding the purpose of this study and how its inclusion can benefit a comprehensive trading strategy.
Trend Strength
---------------------------
To analyze trend strength, the focus should be on the ADX line and not the +DI or -DI lines. An ADX reading above 25 indicates a strong trend, while a reading below 20 indicates a weak or non-existent trend. A reading between those two values would be considered indeterminable. Though what is truly a strong trend or a weak trend depends on the financial instrument being examined; historical analysis can assist in determining appropriate values.
Bullish DI Cross
---------------------------
1. ADX must be over 25 (strong trend) (value is determined by the trader)
2. +DI cross above -DI
3. Set Stop Loss at the current day's low (any +DI cross-backs below -DI should be ignored)
4. Set trailing stop if ADX strengthens (i.e., signal rises)
Bearish DI Cross
---------------------------
1. ADX must be over 25 (strong trend) (value is determined by the trader)
2. -DI cross above +DI
3. Set Stop Loss at the current day's high (any -DI cross-backs below +DI should be ignored)
4. Set trailing stop if ADX strengthens (i.e., signal rises)
Disclaimer
---------------------------
This post and the script are not intended to provide any financial advice. Trade at your own risk.
No known repainting.
Version 1.1
-------------------------
- Added multi-timeframe resolution using PineCoders secure security function to eliminate repainting.
- Cleaned up option for selecting ADX view; and added a colored line as a choice, based on same bullish, bearish, or neutral colors as the background.
- Added exit crossover indicator to aid in an overall strategy development. This ability pairs better with my CHOP Zone Entry Strategy which relies on DMI Exits. Note that exit conditions don't employ the sensitivity variable. Green labels are for Bullish exits and red are for Bearish.
-- Exit condition is triggered if in an active Bullish or Bearish position and ADX drops below 25, Or if either the -DI crosses above +DI (for previously Bullish) or +DI crosses above -DI (for previously Bearish).
- Added reverse position determination. Triggers when a Bullish entry occurs on the same candle as a Bearish exit, or vice versa. Green labels are for Bullish reverses and red are for Bearish.
- Added selectable option to choose visible labels -- Bearish, Bullish, Both, Exits, Reverses, or All.
-- Note that a reverse label will only show if the opposing entry and exit labels are set to show, otherwise the reverse will revert to the appropriate entry or exit on the chart.
- Added alerts to account for new conditions.
-- Note that alerts for crossovers, exits, and reverses will only be triggered if the associated labels are selected to be shown (i.e., what you choose to see on the chart is what you will be alerted to).
Version 1.2
-------------------------
- Changed exit condition to be decided on by whether ADX is below 25 and on a +/-DI crossover. Versus being either or. The previous version had too many false triggers. This variety can now show multiple Bullish or Bearish alerts before an Exit condition too. I'm tempted to simply make this condition based on ADX, and not DI … thoughts? See lines 138 and 139.
- Updated the Background view to have deeper shades of colors dependent upon the ADX trend strength.
- Added an Oscillator view for the ADX and momentum computations to color the histogram by trend. DI lines are hidden.
-- If ADX is Bullish, then the oscillator is colored light green in an uptrend and dark green in a downtrend; if Bearish, then its light red in an uptrend and dark redin a downtrend; if adx is below key level, then it is light gray in a downtrend and dark grey in the uptrend.
- Added option to Hide ADX in case only the Directional lines are desired. This could be useful if you would like to have the ADX oscillator in one panel and +/-DI crossovers in another.
- Added a Columnar view for the ADX. DI lines are hidden. This view is really simple and compact, with the trend strength still easily understood. Colors are the same as for the oscillator -- the deeper the shade of green or red, then the higher the ADX trend strength level.
- Added a Trend Strength label.
ADX Trend Strength Trade (Y/N) Setup Types
0 to 10 = Barely Breathing N N/A
10 to 20 = Weak Trend Y Range/Pre-Breakout
20 to 30 = Potentially Starting to Trend Y Early Stage Trend
30 to 50 = Strong Trend Y Ride the Wave
50 to 75 = Very Strong Trend N Exhaustion
75 to 100 = Extremely Strong Trend N N/A
Version 1.3
-------------------------
Updated to Pine Script v5 to resolve errors from the deprecated v4 version.
This is a reissue of a previously published script that was hidden due to a v4 compatibility issue.
'https://www.tradingview.com/script/9OoEHrv5-Directional-Movement-Index-DMI-Alerts/'

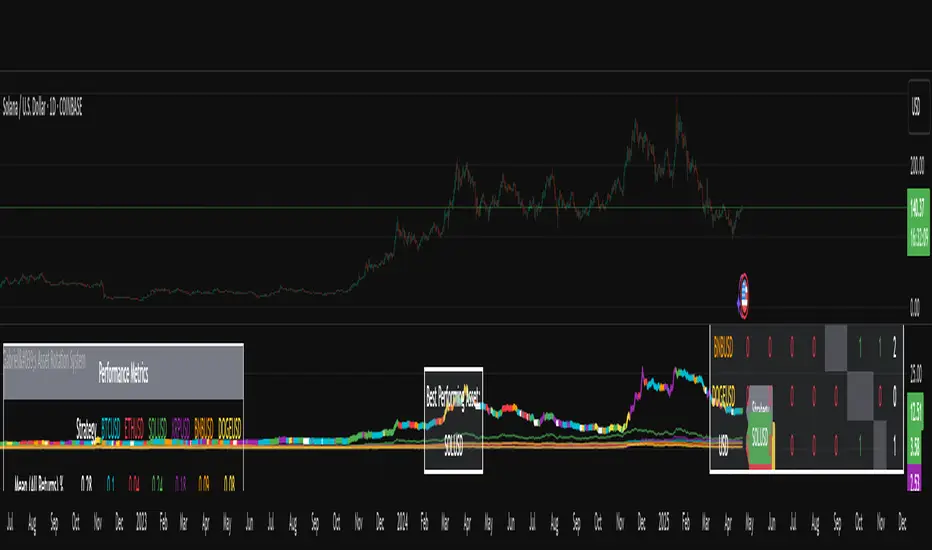
Gabriel's Asset Rotation System📈 Gabriel's Asset Rotation System
Overview
Gabriel’s Asset Rotation System is an advanced multi-asset trend-following tool that dynamically ranks and rotates up to 6 assets (plus USD) based on a customizable trend scoring matrix. Using enhanced signal detection techniques like Cauchy-weighted Supertrend, Jurík RSX, Fisherized CCI, Kalman-filtered PSAR, and Dynamic DMI Smoothing, the system identifies the most dominant asset and simulates strategy equity performance compared to buy-and-hold benchmarks.
🔍 Key Features
✅ Multi-Asset Rotation: Analyze up to 6 symbols and USD simultaneously.
✅ Relative Strength Matrix: Compares every asset against each other to find outperformers.
✅ Custom Trend Engine:
Jurik RSX with advanced RSX logic
Fisherized CCI for momentum confirmation
Kalman-smoothed PSAR for trend bias
SuperTrend using a Cauchy Moving Average
Smoothed DMI signal across looped periods (10–17)
✅ Dynamic Best Asset Detection: Identifies and tracks the asset with the highest trend score over time.
✅ Performance Table: Displays Sharpe, Sortino, and Omega Ratios along with drawdowns and means for both strategy and each asset.
✅ Visual Trend Matrix: Tabular view of asset strength comparisons against each other + final scoring.
✅ Realistic Strategy Equity Curve: Tracks performance assuming full capital rotation into the best asset.
✅ Alerts: Get notified when the top-performing asset changes.
⚙️ Inputs
🔹 Assets: Customize 6 tickers (crypto, stocks, ETFs, etc.)
🔹 Trend Classification Method:
RSI
CCI
SuperTrend
DMI
PSAR
or use all together
🔹 Jurik RSX Length
🔹 Fisherized CCI Length
🔹 Cauchy MA Gamma and ATR Settings
🔹 DMI Range and MA Type (SMA, EMA, HMA, etc.)
🔹 PSAR Parameters with Kalman smoothing
🔹 Custom Backtest Start Date
📊 Outputs
Plot 1: Best Asset Equity (colored dynamically)
Plot 2–7: Buy & Hold Curves for each asset (with labels)
Tables:
Rotation Matrix (bottom-right)
Best Performing Asset (bottom-center)
Performance Metrics Table (optional toggle)
🧠 Use Case Ideas
🔁 Dynamic Portfolio Rebalancing
⚖️ Compare Risk-Adjusted Returns Across Crypto or Stocks
🧪 Backtest Rotation Hypotheses
🚀 Identify Strongest Breakout Assets in Trend Environments
📉 Avoid Weakening Assets with Rising Drawdowns
🚨 Alerts
🔔 "New Optimal Asset": Triggers when a new top-ranking asset replaces the current one.
Multi-Time Frame DMI with Gradient Bar ColoringDisplays a table showing the Directional Movement Index (DMI) sentiment for multiple time frames based on the Average Directional Index (ADX) value for each time frame.
Table Position and Text Size are configurable, with two styles (vertical or horizontal) available.
Time frame labels can be toggled off for color-only table.
Bars are colored based on the ADX value using a color gradient between the bullish and bearish color inputs. The neutral color is independent of the gradient for contrast.

DEMA Adaptive DMI [BackQuant]DEMA Adaptive DMI
PLEASE Read the following, knowing what an indicator does at its core before adding it into a system is pivotal. The core concepts can allow you to include it in a logical and sound manner.
Conceptual Foundation and Innovation
The DEMA Adaptive DMI blends the Double Exponential Moving Average (DEMA) with the Directional Movement Index (DMI) to offer a unique approach to trend-following. By applying DEMA to the high and low prices, this indicator refines the traditional DMI calculation, enhancing its responsiveness to price changes. This results in a more adaptive and timely measure of market trends and momentum, providing traders with a more refined tool for capturing directional movements in the market.
Technical Composition and Calculation
At its core, the DEMA Adaptive DMI calculates the DEMA for both the high and low prices over a user-defined period. This dual application of DEMA serves to smooth out price fluctuations while retaining sensitivity to market movements. The DMI is then derived from the changes in these DEMA values, producing a set of plus and minus directional indicators that reflect the prevailing trend. Additionally, an Average Directional Index (ADX) is computed to measure the strength of the trend, with the entire process being dynamically adjusted based on the DEMA calculations.
DEMA Application:
The DEMA is applied to both high and low prices to reduce lag and provide a smoother representation of price action.
Directional Movement Calculation: The DMI is calculated using the smoothed price changes, resulting in plus and minus indicators that accurately reflect market trends.
ADX Calculation:
The ADX is computed to quantify the strength of the trend, offering traders insight into whether the market is trending strongly or is in a phase of consolidation.
Features and User Inputs The DEMA Adaptive DMI offers a range of customizable options to suit different trading styles and market conditions:
DEMA Calculation Period: Users can set the period for the DEMA calculation, allowing for adjustments based on the desired sensitivity.
DMI Length: The length of the DMI calculation can be adjusted, providing flexibility in how trends are measured.
ADX Smoothing Period: The smoothing period for the ADX can be customized to fine-tune the trend strength measurement.
Divergence Detection: Optional divergence detection features allow traders to spot potential reversals based on the DMI and price action.
Visualization options include static high and low levels to mark extreme DMI thresholds, the ability to color bars according to trend direction, and background hues to highlight overbought and oversold conditions.
Practical Applications
The DEMA Adaptive DMI is particularly effective in markets where trend strength and direction are crucial for successful trading. Traders can leverage this indicator to:
Identify Trend Reversals:
Detect potential trend reversals by monitoring the DMI and ADX in conjunction with divergence signals.
Trend Confirmation:
Use the DEMA-based DMI to confirm the strength and direction of a trend, aiding in the timing of entries and exits.
Strategic Positioning:
The indicator's responsiveness allows traders to position themselves effectively in fast-moving markets, reducing the risk of late entries or exits.
Advantages and Strategic Value
By integrating the DEMA with the DMI, this indicator provides a more adaptive and timely measure of market trends. The reduced lag from the DEMA ensures that traders receive signals that are closely aligned with current market conditions, while the dynamic DMI calculation offers a more accurate representation of trend direction and strength. This makes the DEMA Adaptive DMI a valuable tool for traders looking to enhance their trend-following strategies with a focus on precision and adaptability.
Summary and Usage Tips
The DEMA Adaptive DMI is a sophisticated trend-following indicator that combines the benefits of DEMA and DMI into a single, powerful tool. Traders are encouraged to incorporate this indicator into their trading systems for a more nuanced and responsive approach to trend detection and confirmation. Whether used for identifying trend reversals, confirming trend strength, or strategically positioning in the market, the DEMA Adaptive DMI offers a versatile and reliable solution for trend-following strategies.
Thus following all of the key points here are some sample backtests on the 1D Chart
Disclaimer: Backtests are based off past results, and are not indicative of the future.
INDEX:BTCUSD
INDEX:ETHUSD
BINANCE:SOLUSD

Trend Deviation strategy - BTC [IkkeOmar]Intro:
This is an example if anyone needs a push to get started with making strategies in pine script. This is an example on BTC, obviously it isn't a good strategy, and I wouldn't share my own good strategies because of alpha decay.
This strategy integrates several technical indicators to determine market trends and potential trade setups. These indicators include:
Directional Movement Index (DMI)
Bollinger Bands (BB)
Schaff Trend Cycle (STC)
Moving Average Convergence Divergence (MACD)
Momentum Indicator
Aroon Indicator
Supertrend Indicator
Relative Strength Index (RSI)
Exponential Moving Average (EMA)
Volume Weighted Average Price (VWAP)
It's crucial for you guys to understand the strengths and weaknesses of each indicator and identify synergies between them to improve the strategy's effectiveness.
Indicator Settings:
DMI (Directional Movement Index):
Length: This parameter determines the number of bars used in calculating the DMI. A higher length may provide smoother results but might lag behind the actual price action.
Bollinger Bands:
Length: This parameter specifies the number of bars used to calculate the moving average for the Bollinger Bands. A longer length results in a smoother average but might lag behind the price action.
Multiplier: The multiplier determines the width of the Bollinger Bands. It scales the standard deviation of the price data. A higher multiplier leads to wider bands, indicating increased volatility, while a lower multiplier results in narrower bands, suggesting decreased volatility.
Schaff Trend Cycle (STC):
Length: This parameter defines the length of the STC calculation. A longer length may result in smoother but slower-moving signals.
Fast Length: Specifies the length of the fast moving average component in the STC calculation.
Slow Length: Specifies the length of the slow moving average component in the STC calculation.
MACD (Moving Average Convergence Divergence):
Fast Length: Determines the number of bars used to calculate the fast EMA (Exponential Moving Average) in the MACD.
Slow Length: Specifies the number of bars used to calculate the slow EMA in the MACD.
Signal Length: Defines the number of bars used to calculate the signal line, which is typically an EMA of the MACD line.
Momentum Indicator:
Length: This parameter sets the number of bars over which momentum is calculated. A longer length may provide smoother momentum readings but might lag behind significant price changes.
Aroon Indicator:
Length: Specifies the number of bars over which the Aroon indicator calculates its values. A longer length may result in smoother Aroon readings but might lag behind significant market movements.
Supertrend Indicator:
Trendline Length: Determines the length of the period used in the Supertrend calculation. A longer length results in a smoother trendline but might lag behind recent price changes.
Trendline Factor: Specifies the multiplier used in calculating the trendline. It affects the sensitivity of the indicator to price changes.
RSI (Relative Strength Index):
Length: This parameter sets the number of bars over which RSI calculates its values. A longer length may result in smoother RSI readings but might lag behind significant price changes.
EMA (Exponential Moving Average):
Fast EMA: Specifies the number of bars used to calculate the fast EMA. A shorter period results in a more responsive EMA to recent price changes.
Slow EMA: Determines the number of bars used to calculate the slow EMA. A longer period results in a smoother EMA but might lag behind recent price changes.
VWAP (Volume Weighted Average Price):
Default settings are typically used for VWAP calculations, which consider the volume traded at each price level over a specific period. This indicator provides insights into the average price weighted by trading volume.
backtest range and rules:
You can specify the start date for backtesting purposes.
You can can select the desired trade direction: Long, Short, or Both.
Entry and Exit Conditions:
LONG:
DMI Cross Up: The Directional Movement Index (DMI) indicates a bullish trend when the positive directional movement (+DI) crosses above the negative directional movement (-DI).
Bollinger Bands (BB): The price is below the upper Bollinger Band, indicating a potential reversal from the upper band.
Momentum Indicator: Momentum is positive, suggesting increasing buying pressure.
MACD (Moving Average Convergence Divergence): The MACD line is above the signal line, indicating bullish momentum.
Supertrend Indicator: The Supertrend indicator signals an uptrend.
Schaff Trend Cycle (STC): The STC indicates a bullish trend.
Aroon Indicator: The Aroon indicator signals a bullish trend or crossover.
When all these conditions are met simultaneously, the strategy considers it a favorable opportunity to enter a long trade.
SHORT:
DMI Cross Down: The Directional Movement Index (DMI) indicates a bearish trend when the negative directional movement (-DI) crosses above the positive directional movement (+DI).
Bollinger Bands (BB): The price is above the lower Bollinger Band, suggesting a potential reversal from the lower band.
Momentum Indicator: Momentum is negative, indicating increasing selling pressure.
MACD (Moving Average Convergence Divergence): The MACD line is below the signal line, signaling bearish momentum.
Supertrend Indicator: The Supertrend indicator signals a downtrend.
Schaff Trend Cycle (STC): The STC indicates a bearish trend.
Aroon Indicator: The Aroon indicator signals a bearish trend or crossover.
When all these conditions align, the strategy considers it an opportune moment to enter a short trade.
Disclaimer:
THIS ISN'T AN OPTIMAL STRATEGY AT ALL! It was just an old project from when I started learning pine script!
The backtest doesn't promise the same results in the future, always do both in-sample and out-of-sample testing when backtesting a strategy. And make sure you forward test it as well before implementing it!
Furthermore this strategy uses both trend and mean-reversion systems, that is usually a no-go if you want to build robust trend systems .
Don't hesitate to comment if you have any questions or if you have some good notes for a beginner.

ADX Thrust Reversal & Trend
Created by Love Sharma, CMT, CFTe
the idea is simple. there needs to be thrust in prices before adx goes above any barrier or level say 25/10 or even 10/ The Di plus or Di minus should be above ADX. This indicates the change in direction or change in underlying price and obviously followed by ADX indicator which is dependent on user which level it exceed.
The ADX - Shows Trend Strength
The =/- Di show Thrust or reversal in prices.
it helps in entering the directional change in prices early rather than waiting for ADX

Harmonic Trend Fusion [kikfraben]📈 Harmonic Trend Fusion - Your Personal Trading Assistant
This versatile tool combines multiple indicators to provide a holistic view of market trends and potential signals.
🚀 Key Features:
Multi-Indicator Synergy: Benefit from the combined insights of Aroon, DMI, MACD, Parabolic SAR, RSI, Supertrend, and SMI Ergodic Oscillator, all in one powerful indicator.
Customizable Plot Options: Tailor your chart by choosing which signals to visualize. Whether you're interested in trendlines, histograms, or specific indicators, the choice is yours.
Color-Coded Trends: Quickly identify bullish and bearish trends with the color-coded visualizations. Stay ahead of market movements with clear and intuitive signals.
Table Display: Stay informed at a glance with the interactive table. It dynamically updates to reflect the current market sentiment, providing you with key information and trend direction.
Precision Control: Fine-tune your analysis with precision control over indicator parameters. Adjust lengths, colors, and other settings to align with your unique trading strategy.
🛠️ How to Use:
Customize Your View: Select which indicators to display and adjust plot options to suit your preferences.
Table Insights: Monitor the dynamic table for real-time updates on market sentiment and trend direction.
Indicator Parameters: Experiment with different lengths and settings to find the combination that aligns with your trading style.
Whether you're a seasoned trader or just starting, Harmonic Trend Fusion equips you with the tools you need to navigate the markets confidently. Take control of your trading journey and enhance your decision-making process with this comprehensive trading assistant.

Directional Movement Index FLEXA common problem experienced by short term traders using DMI/ADX is that the session breaks results in carry-over effects from the prior session. For example, a large gap up would result in a positive DMI, even though momentum is clearly negative. Note the extremely different results in the morning session, when the gap is reversed.
The DMI-FLEX algoritm resets the +DI and -DI values to the prior session ending midpoint, so that new momentum can be observed from the indicator. (Note for Pinescript coders: rma function does not accept series int, thus the explicit pine_rma function)
DMI-FLEX has the added feature that the ADX value, instead of a separate line, is shown as shading between the +DI and -DI lines, and the color itself is determined by whether +DI is above -DI for a bullish color, or -DI is above +DI for a bearish color.
DMI Flex also gives you the flexibility of inverse colors, in case your chart has inverted scale.
Summary and How to use:
1) Green when +DI is above -DI
2) Red when -DI is above +DI
3) Deeper shading represents a higher ADX value.

ADXcellenceThis advanced trading indicator, inspired by Dr. Charles B. Schaap's book "ADXcellence: Power Trend Strategies", leverages the principles of the Average Directional Index (ADX) to help traders identify and exploit trending conditions in the market.
The ADXcellence Indicator uses multiple levels of analysis to evaluate the strength and direction of trends.
In addition to the classic ADX+DMI input settings, these features are included:
ADX Slope Signal: This parameter, controls the sensitivity of the ADX slope, which will indicate when the trend strength is increasing or decreasing.
The indicator provides three trend levels: strong trend level, trending level, and low volatility level, which can be customized to suit various trading strategies.
The color gradients for the ADX, DI+, and DI- lines are designed to visually represent the trend strength from the low volatility level to the strong trend level. The indicator also uses a dynamic background color, highlighting the periods when the ADX is rising. The color will vary depending on the dominant DI.
The ADXcellence Indicator also offers a unique feature of dynamically adjusting the fill between DI+ and DI-, with the color and fill intensity changing based on the relative value of the two.
This indicator is a powerful tool for traders who use trend-following strategies and is best used in conjunction with other technical analysis tools to confirm signals and avoid potential false signals.
Remember, no indicator is perfect and every trading strategy should include risk management and proper due diligence.
Enjoy :)

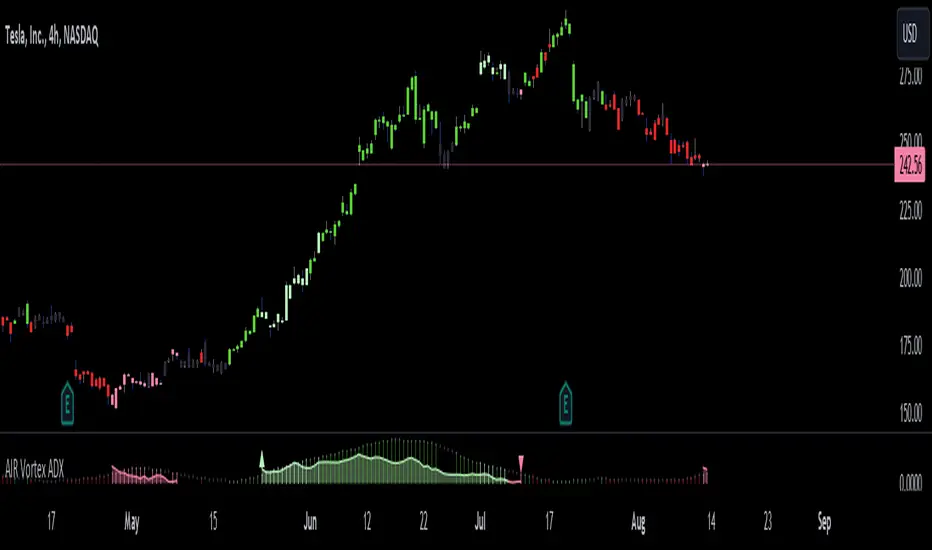
AIR Vortex ADXThis project started as an effort to improve the user interface of the hybrid indicator ADX of Vortex, which is, as per the name, a blend of ADX and Vortex Indicator. Plotting both indicators on the same polarity and normalising the vortex, a better interpretation of the interaction between the two is possible, and trend becomes apparent.
Basically, the Vortex provides the bright punch and ADX the continuation of the trend and momentum.
A range mixer has been added to the vortex, comprising both true and interpercentile ranges (see my previous script for a desrciption of interpercentile range). Users can activate and add amounts of each as they see fit.
Finally, there is an RSI filter, the idea of which is to filter out ranging (flat) markets, where no distinct direction is yet emerging.
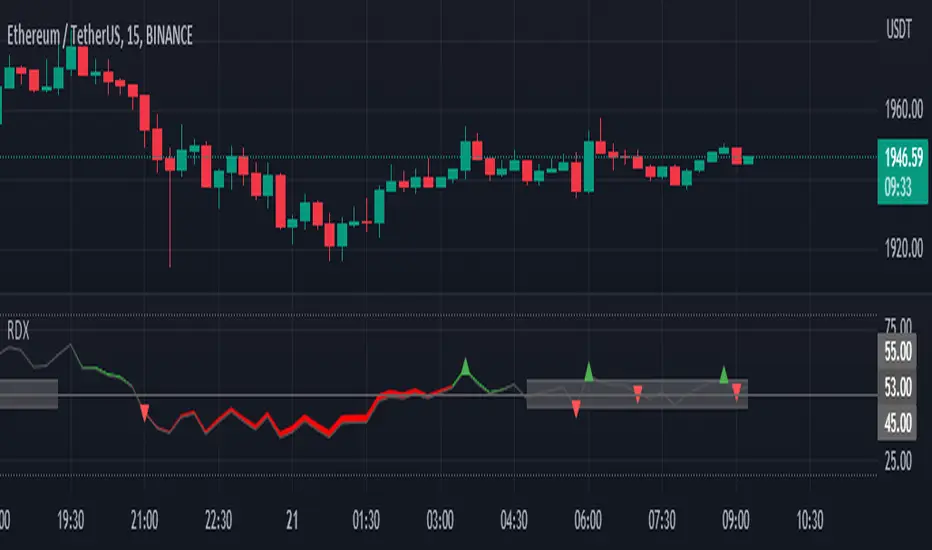
RDX Relative Directional IndexRDX Relative Directional Index, Strength + Direction + Trend. This indicator is the combination of RSI and DMI or ADX. RDX aims at providing Relative direction of the price along with strength of the trend. This acts as both RSI and Average Directional Index. as the strength grows the RSI line becomes wider and when there is high volatility and market fluctuation the line becomes thinner. Color decides the Direction. This indicator provides sideways detection of RSI signal.
RDX Width: This determines the strength of RSI and Strength of ADX, The strength grows RDX band grows wider, as strength decreases band shrinks and merge into the RSI line. for exact working simply disable RSI plot on the indicator. when there is no strength the RSI vanishes..
Technical:
RSI : with default 14 period
ADX : Default 14 period
RDX=RSI+(ADX-20)/5
Color Code:
Red: Down Direction
Green: Up Direction
Sideways:
A rectangular channel is plotted on RSI 50 Level
Oversold Overbought:
Oversold and Overbought Levels are plotted for normal RSI Oversold and Overbought detection.
Buy/Sell:
Buy sell signals from ADX crossover are plotted and its easy to determine
Strength + Direction + Trend in one go
Hope the community likes this...
Contibute for more ideas and indicators..
RiverFlow ADX ScreenerRiverFlow ADX Screener, Scans ADX and Donchian Trend values across various Timeframes. This screener provides support to the Riverflow indicator. Riverflow concept is based on Two indicators. Donchian Channel and ADX or DMI.
How to implement?
1.Donchian Channel with period 20
2. ADX / DMI 14,14 threshold 20
Entry / Exit:
1. Buy/Sell Signal from ADX Crossovers.
2. Trend Confirmation Donchian Channel.
3. Major Trend EMA 200
Buy/Sell:
After a buy/sell is generated by ADX Crossover, Check for Donchian Trend. it has to be in same direction as trend. for FTT trades take 2x limit. for Forex and Stocks take 1:1.5, SL must be placed below recent swing. One can use Riverflow indicator for better results.
ADX Indicator is plotted with
Plus: Green line
Minus: Red Line
ADX strength: plotted as Background area.
TREND: Trend is represented by Green and Red Area around Threshold line
Table:
red indicates down trend
green indicates up trend
grey indicates sideways
Weak ADX levels are treated sideways and a channel is plotted on ADX and PLUS and MINUS lines . NO TRADES are to be TAKEN on within the SIDEWAYS region.
Settings are not required as it purely works on Default settings. However Donchian Length can be changed from settings.
Timeframes below 1Day are screened. Riverflow strategy works on timeframe 5M and above timeframe. so option is not provided for lower timeframes.
Best suits for INTRADAY and LONG TERM Trading

ADX Trend FilterADX Trend Filter Indicator is a traditional ADX indicator with a different presentation. its consist of two indicators EMA TREND and ADX / DMI
About Indicator:
1. BAND / EMA band to represent EMA Trend of EMA-12 and EMA-50
(Band is plotted at level-20 which is the Threshold level of DMI / ADX indicator)
2. Histogram showing the direction of ADX / DMI trend
3. Area behind the histogram showing ADX/DMI strength
How to use?
1. Histogram represents current Trend Red for Bearish / Green for Bullish
2. Area behind the histogram represents Strength of ADX / DMI Threshold level is 0-20(represented as band). (Area below the Band is Sideways)
3. Band represents the current MA Trend.
4. Buy Sell signals are plotted as triangles in red/green obtained from ADX / DMI Crossovers
Buy Signal (Green Triangle on band- ADX Crossover)
1.Band below Histogram must be Green
2.Histogram must be green
3.Area behind histogram must be above the lower trend band (20level) and visible
Sell Signal (Red Triangle on band- ADX Crossover)
1.Band below Histogram must be Red
2.Histogram must be Red
3.Area behind histogram must be above the lower trend band (20level) and visible
Alerts provided for ADX crossovers.

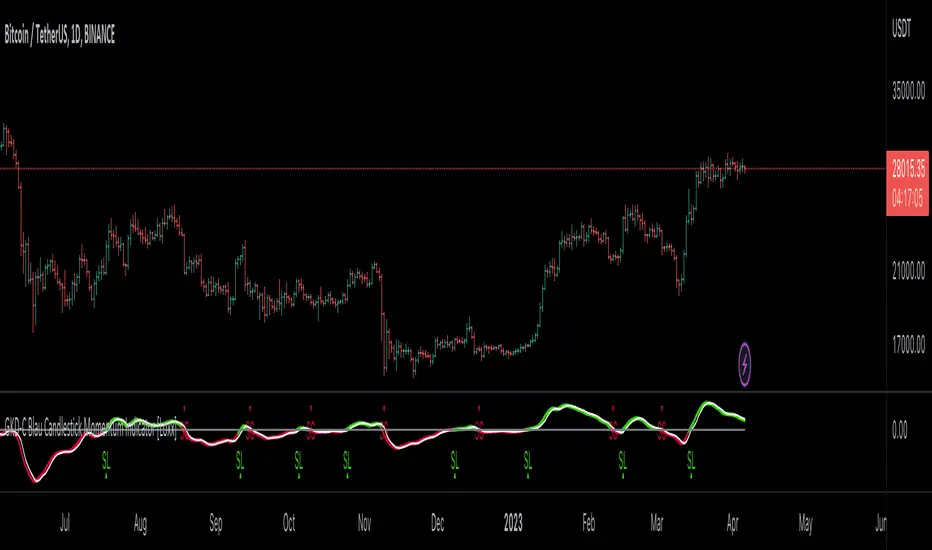
GKD-C Blau Candlestick Momentum Indicator [Loxx]Giga Kaleidoscope GKD-C Blau Candlestick Momentum Indicator is a Confirmation module included in Loxx's "Giga Kaleidoscope Modularized Trading System".
█ Giga Kaleidoscope Modularized Trading System
What is Loxx's "Giga Kaleidoscope Modularized Trading System"?
The Giga Kaleidoscope Modularized Trading System is a trading system built on the philosophy of the NNFX (No Nonsense Forex) algorithmic trading.
What is the NNFX algorithmic trading strategy?
The NNFX (No-Nonsense Forex) trading system is a comprehensive approach to Forex trading that is designed to simplify the process and remove the confusion and complexity that often surrounds trading. The system was developed by a Forex trader who goes by the pseudonym "VP" and has gained a significant following in the Forex community.
The NNFX trading system is based on a set of rules and guidelines that help traders make objective and informed decisions. These rules cover all aspects of trading, including market analysis, trade entry, stop loss placement, and trade management.
Here are the main components of the NNFX trading system:
1. Trading Philosophy: The NNFX trading system is based on the idea that successful trading requires a comprehensive understanding of the market, objective analysis, and strict risk management. The system aims to remove subjective elements from trading and focuses on objective rules and guidelines.
2. Technical Analysis: The NNFX trading system relies heavily on technical analysis and uses a range of indicators to identify high-probability trading opportunities. The system uses a combination of trend-following and mean-reverting strategies to identify trades.
3. Market Structure: The NNFX trading system emphasizes the importance of understanding the market structure, including price action, support and resistance levels, and market cycles. The system uses a range of tools to identify the market structure, including trend lines, channels, and moving averages.
4. Trade Entry: The NNFX trading system has strict rules for trade entry. The system uses a combination of technical indicators to identify high-probability trades, and traders must meet specific criteria to enter a trade.
5. Stop Loss Placement: The NNFX trading system places a significant emphasis on risk management and requires traders to place a stop loss order on every trade. The system uses a combination of technical analysis and market structure to determine the appropriate stop loss level.
6. Trade Management: The NNFX trading system has specific rules for managing open trades. The system aims to minimize risk and maximize profit by using a combination of trailing stops, take profit levels, and position sizing.
Overall, the NNFX trading system is designed to be a straightforward and easy-to-follow approach to Forex trading that can be applied by traders of all skill levels.
Core components of an NNFX algorithmic trading strategy
The NNFX algorithm is built on the principles of trend, momentum, and volatility. There are six core components in the NNFX trading algorithm:
1. Volatility - price volatility; e.g., Average True Range, True Range Double, Close-to-Close, etc.
2. Baseline - a moving average to identify price trend
3. Confirmation 1 - a technical indicator used to identify trends
4. Confirmation 2 - a technical indicator used to identify trends
5. Continuation - a technical indicator used to identify trends
6. Volatility/Volume - a technical indicator used to identify volatility/volume breakouts/breakdown
7. Exit - a technical indicator used to determine when a trend is exhausted
What is Volatility in the NNFX trading system?
In the NNFX (No Nonsense Forex) trading system, ATR (Average True Range) is typically used to measure the volatility of an asset. It is used as a part of the system to help determine the appropriate stop loss and take profit levels for a trade. ATR is calculated by taking the average of the true range values over a specified period.
True range is calculated as the maximum of the following values:
-Current high minus the current low
-Absolute value of the current high minus the previous close
-Absolute value of the current low minus the previous close
ATR is a dynamic indicator that changes with changes in volatility. As volatility increases, the value of ATR increases, and as volatility decreases, the value of ATR decreases. By using ATR in NNFX system, traders can adjust their stop loss and take profit levels according to the volatility of the asset being traded. This helps to ensure that the trade is given enough room to move, while also minimizing potential losses.
Other types of volatility include True Range Double (TRD), Close-to-Close, and Garman-Klass
What is a Baseline indicator?
The baseline is essentially a moving average, and is used to determine the overall direction of the market.
The baseline in the NNFX system is used to filter out trades that are not in line with the long-term trend of the market. The baseline is plotted on the chart along with other indicators, such as the Moving Average (MA), the Relative Strength Index (RSI), and the Average True Range (ATR).
Trades are only taken when the price is in the same direction as the baseline. For example, if the baseline is sloping upwards, only long trades are taken, and if the baseline is sloping downwards, only short trades are taken. This approach helps to ensure that trades are in line with the overall trend of the market, and reduces the risk of entering trades that are likely to fail.
By using a baseline in the NNFX system, traders can have a clear reference point for determining the overall trend of the market, and can make more informed trading decisions. The baseline helps to filter out noise and false signals, and ensures that trades are taken in the direction of the long-term trend.
What is a Confirmation indicator?
Confirmation indicators are technical indicators that are used to confirm the signals generated by primary indicators. Primary indicators are the core indicators used in the NNFX system, such as the Average True Range (ATR), the Moving Average (MA), and the Relative Strength Index (RSI).
The purpose of the confirmation indicators is to reduce false signals and improve the accuracy of the trading system. They are designed to confirm the signals generated by the primary indicators by providing additional information about the strength and direction of the trend.
Some examples of confirmation indicators that may be used in the NNFX system include the Bollinger Bands, the MACD (Moving Average Convergence Divergence), and the MACD Oscillator. These indicators can provide information about the volatility, momentum, and trend strength of the market, and can be used to confirm the signals generated by the primary indicators.
In the NNFX system, confirmation indicators are used in combination with primary indicators and other filters to create a trading system that is robust and reliable. By using multiple indicators to confirm trading signals, the system aims to reduce the risk of false signals and improve the overall profitability of the trades.
What is a Continuation indicator?
In the NNFX (No Nonsense Forex) trading system, a continuation indicator is a technical indicator that is used to confirm a current trend and predict that the trend is likely to continue in the same direction. A continuation indicator is typically used in conjunction with other indicators in the system, such as a baseline indicator, to provide a comprehensive trading strategy.
What is a Volatility/Volume indicator?
Volume indicators, such as the On Balance Volume (OBV), the Chaikin Money Flow (CMF), or the Volume Price Trend (VPT), are used to measure the amount of buying and selling activity in a market. They are based on the trading volume of the market, and can provide information about the strength of the trend. In the NNFX system, volume indicators are used to confirm trading signals generated by the Moving Average and the Relative Strength Index. Volatility indicators include Average Direction Index, Waddah Attar, and Volatility Ratio. In the NNFX trading system, volatility is a proxy for volume and vice versa.
By using volume indicators as confirmation tools, the NNFX trading system aims to reduce the risk of false signals and improve the overall profitability of trades. These indicators can provide additional information about the market that is not captured by the primary indicators, and can help traders to make more informed trading decisions. In addition, volume indicators can be used to identify potential changes in market trends and to confirm the strength of price movements.
What is an Exit indicator?
The exit indicator is used in conjunction with other indicators in the system, such as the Moving Average (MA), the Relative Strength Index (RSI), and the Average True Range (ATR), to provide a comprehensive trading strategy.
The exit indicator in the NNFX system can be any technical indicator that is deemed effective at identifying optimal exit points. Examples of exit indicators that are commonly used include the Parabolic SAR, the Average Directional Index (ADX), and the Chandelier Exit.
The purpose of the exit indicator is to identify when a trend is likely to reverse or when the market conditions have changed, signaling the need to exit a trade. By using an exit indicator, traders can manage their risk and prevent significant losses.
In the NNFX system, the exit indicator is used in conjunction with a stop loss and a take profit order to maximize profits and minimize losses. The stop loss order is used to limit the amount of loss that can be incurred if the trade goes against the trader, while the take profit order is used to lock in profits when the trade is moving in the trader's favor.
Overall, the use of an exit indicator in the NNFX trading system is an important component of a comprehensive trading strategy. It allows traders to manage their risk effectively and improve the profitability of their trades by exiting at the right time.
How does Loxx's GKD (Giga Kaleidoscope Modularized Trading System) implement the NNFX algorithm outlined above?
Loxx's GKD v1.0 system has five types of modules (indicators/strategies). These modules are:
1. GKD-BT - Backtesting module (Volatility, Number 1 in the NNFX algorithm)
2. GKD-B - Baseline module (Baseline and Volatility/Volume, Numbers 1 and 2 in the NNFX algorithm)
3. GKD-C - Confirmation 1/2 and Continuation module (Confirmation 1/2 and Continuation, Numbers 3, 4, and 5 in the NNFX algorithm)
4. GKD-V - Volatility/Volume module (Confirmation 1/2, Number 6 in the NNFX algorithm)
5. GKD-E - Exit module (Exit, Number 7 in the NNFX algorithm)
(additional module types will added in future releases)
Each module interacts with every module by passing data between modules. Data is passed between each module as described below:
GKD-B => GKD-V => GKD-C(1) => GKD-C(2) => GKD-C(Continuation) => GKD-E => GKD-BT
That is, the Baseline indicator passes its data to Volatility/Volume. The Volatility/Volume indicator passes its values to the Confirmation 1 indicator. The Confirmation 1 indicator passes its values to the Confirmation 2 indicator. The Confirmation 2 indicator passes its values to the Continuation indicator. The Continuation indicator passes its values to the Exit indicator, and finally, the Exit indicator passes its values to the Backtest strategy.
This chaining of indicators requires that each module conform to Loxx's GKD protocol, therefore allowing for the testing of every possible combination of technical indicators that make up the six components of the NNFX algorithm.
What does the application of the GKD trading system look like?
Example trading system:
Backtest: Strategy with 1-3 take profits, trailing stop loss, multiple types of PnL volatility, and 2 backtesting styles
Baseline: Hull Moving Average
Volatility/Volume: Hurst Exponent
Confirmation 1: Blau Candlestick Momentum Indicator as shown on the chart above
Confirmation 2: Williams Percent Range
Continuation: Fisher Transform
Exit: Rex Oscillator
Each GKD indicator is denoted with a module identifier of either: GKD-BT, GKD-B, GKD-C, GKD-V, or GKD-E. This allows traders to understand to which module each indicator belongs and where each indicator fits into the GKD protocol chain.
Giga Kaleidoscope Modularized Trading System Signals (based on the NNFX algorithm)
Standard Entry
1. GKD-C Confirmation 1 Signal
2. GKD-B Baseline agrees
3. Price is within a range of 0.2x Volatility and 1.0x Volatility of the Goldie Locks Mean
4. GKD-C Confirmation 2 agrees
5. GKD-V Volatility/Volume agrees
Baseline Entry
1. GKD-B Baseline signal
2. GKD-C Confirmation 1 agrees
3. Price is within a range of 0.2x Volatility and 1.0x Volatility of the Goldie Locks Mean
4. GKD-C Confirmation 2 agrees
5. GKD-V Volatility/Volume agrees
6. GKD-C Confirmation 1 signal was less than 7 candles prior
Continuation Entry
1. Standard Entry, Baseline Entry, or Pullback; entry triggered previously
2. GKD-B Baseline hasn't crossed since entry signal trigger
3. GKD-C Confirmation Continuation Indicator signals
4. GKD-C Confirmation 1 agrees
5. GKD-B Baseline agrees
6. GKD-C Confirmation 2 agrees
1-Candle Rule Standard Entry
1. GKD-C Confirmation 1 signal
2. GKD-B Baseline agrees
3. Price is within a range of 0.2x Volatility and 1.0x Volatility of the Goldie Locks Mean
Next Candle:
1. Price retraced (Long: close < close or Short: close > close )
2. GKD-B Baseline agrees
3. GKD-C Confirmation 1 agrees
4. GKD-C Confirmation 2 agrees
5. GKD-V Volatility/Volume agrees
1-Candle Rule Baseline Entry
1. GKD-B Baseline signal
2. GKD-C Confirmation 1 agrees
3. Price is within a range of 0.2x Volatility and 1.0x Volatility of the Goldie Locks Mean
4. GKD-C Confirmation 1 signal was less than 7 candles prior
Next Candle:
1. Price retraced (Long: close < close or Short: close > close )
2. GKD-B Baseline agrees
3. GKD-C Confirmation 1 agrees
4. GKD-C Confirmation 2 agrees
5. GKD-V Volatility/Volume Agrees
PullBack Entry
1. GKD-B Baseline signal
2. GKD-C Confirmation 1 agrees
3. Price is beyond 1.0x Volatility of Baseline
Next Candle:
1. Price is within a range of 0.2x Volatility and 1.0x Volatility of the Goldie Locks Mean
3. GKD-C Confirmation 1 agrees
4. GKD-C Confirmation 2 agrees
5. GKD-V Volatility/Volume Agrees
█ GKD-C Blau Candlestick Momentum Indicator
What is Blau Candlestick Momentum Indicator?
The Candlestick Momentum Indicator is a technical analysis indicator developed by William Blau and described in his book “Momentum, Direction, and Divergence: Applying the Latest Momentum Indicators for Technical Analysis”. It measures the difference between the current close price and the open price of a certain number of bars ago. The values of the Candlestick Momentum Indicator are normalized by absolute values and mapped into the interval .
The Candlestick Momentum Indicator is calculated using the following formula:
CMtm(price1,price2,q,r,s,u) = 100 * EMA(EMA(EMA(cmtm(price1,price2,q),r),s),u)
where:
- price1: close price
- price2: open price q bars ago
- q: number of bars used in calculation of Candlestick Momentum
- cmtm(price1,price2,q): Candlestick Momentum
- CMtm(price1,price2,q,r,s,u): Triple smoothed Candlestick Momentum
- EMA(...,r): first smoothing - exponentially smoothed moving average with period r, applied to Candlestick Momentum
- EMA(EMA(...,r),s): second smoothing - EMA of period s, applied to result of the first smoothing
- EMA(EMA(EMA(...,r),s),u): third smoothing - EMA of period u, applied to result of the second smoothing .
The input parameters for this indicator are:
- q: number of bars used in calculation of Candlestick Momentum (default value is 1)
- r: period of the first EMA applied to Candlestick Momentum (default value is 20)
- s: period of the second EMA applied to result of the first smoothing (default value is 5)
- u: period of the third EMA applied to result of the second smoothing (default value is 3)
- AppliedPrice1: price type (default value is PRICE_CLOSE)
- AppliedPrice2: price type (default value is PRICE_OPEN) .
Requirements
Inputs
Confirmation 1 and Solo Confirmation: GKD-V Volatility / Volume indicator
Confirmation 2: GKD-C Confirmation indicator
Outputs
Confirmation 2 and Solo Confirmation Complex: GKD-E Exit indicator
Confirmation 1: GKD-C Confirmation indicator
Continuation: GKD-E Exit indicator
Solo Confirmation Simple: GKD-BT Backtest strategy
Additional features will be added in future releases.
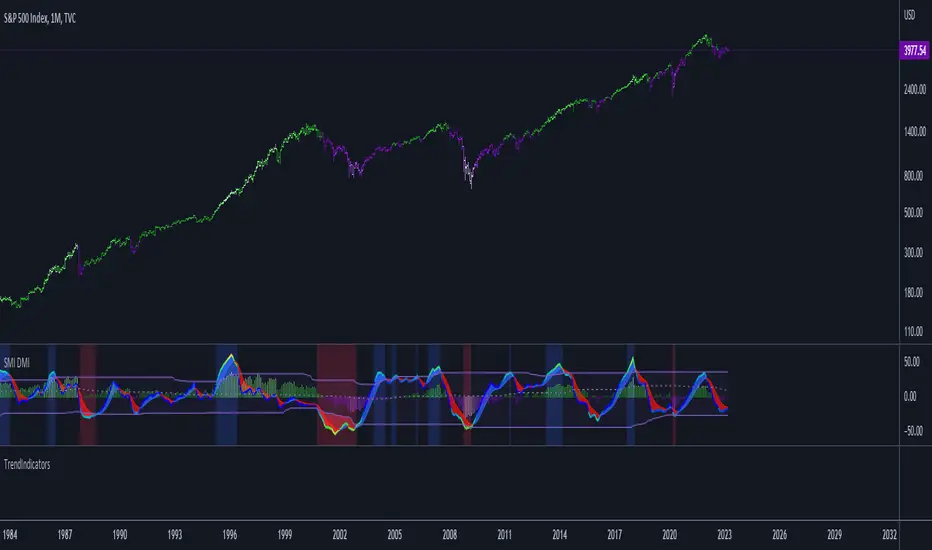
TrendIndicatorsLibrary "TrendIndicators"
This is a library of 'Trend Indicators'.
It aims to facilitate the grouping of this category of indicators, and also offer the customized supply of
the source, not being restricted to just the closing price.
Indicators (this is a work in progress):
1. Absolute DI (Directional Moviment Index) (Difference between DI+ and DI-).
Used in 'DMI Stochastic Extreme' by Barbara Star.
2. DMI
DI_Abs(lengthDI, smoothDI, typeMA, lengthMA)
@description Absolute DI (Directional Moviment Index).
Used in 'DMI Stochastic Extreme' by Barbara Star.
Difference between DI+ and DI-
Parameters:
lengthDI : (int) Length of DI+/DI-
smoothDI : (bool) Sets whether absolute DI should be smoothed
typeMA : (int) Type of moving average of smoothing
lengthMA : (int) Length for moving average of smoothing
Returns: (float) Absolute value of DI
dmi(diLength, adxSmoothing)
@description DMI (Directional Movement Index)
Same as ta.dmi()
Parameters:
diLength : (int) Length of DI+/DI-
adxSmoothing : (int) ADX Smoothing
Returns: Tuple of three DMI series: Positive Directional
Movement (+DI), Negative Directional Movement (-DI) and Average Directional Movement Index (ADX).
dmi(source, diLength, adxSmoothing)
@description DMI (Directional Movement Index)
Customized version of ta.dmi(), with custom source
Parameters:
source : (float) Source for DI+/DI-
diLength : (int) Length of DI+/DI-
adxSmoothing : (int) ADX Smoothing
Returns: Tuple of three DMI series: Positive Directional
Movement (+DI), Negative Directional Movement (-DI) and Average Directional Movement Index (ADX).
SumIndTarget:
The SumInd indicator combines Heiking Ashi, Sar Parabolic, Koncord, RSI, DMI, MACD and Bollinger Bands to give buy or sell signals or trends. This are called base indicators.
The goal is to have a clear and quick buy or sell suggestion and to avoid evaluating all or some of the named indicators, especially if they give contradictory signals among them. This speed and simplicity helps the trader to see several tickers in less time. It is intended for all markets and time periods where the above-mentioned indicators can be used.
How it works:
SumInd already has the importance or "weight" of each indicator named above configured, but they can be modified. You can set 0% for no use, or any other value based on the weight you want to give it, between 1% and 200% where 100% is the normal use, and increases or decreases based on importance.
Each base indicator can give signals to buy, sell or just "wait and see".
Each base indicator is checked for a buy signal, in which case its weight is added to the positive or green line, and if there is a sell signal, its weight is subtracted from the sell or red line. in case of indeterminacy or 'wait and see', nothing is added to any signal.
The yellow or total line is the sum of the buy or green signal plus the sell or red signal.
If the yellow or total line rises above the buy level, the background changes to green and an up arrow appears at the bottom of the chart indicating the buy suggestion, because most of the indicators you are interested in gave a buy signal.
If the yellow line or total falls below the sell level, the background changes to red and a downward arrow appears in the upper area of the chart indicating the sell suggestion, because most of the indicators you are interested in gave a sell signal.
The Buy and Sell level can be changed according to the security of the suggestion you need.
Areas without arrows or marks are considered "wait and see" areas, the previous trend in principle continues. They can be marked with the default background if desired from the SumInd settings.
Details and criterials:
Each of the following indicators can be turned on or off and assigned different weights of importances, by whether or not it shares the following criteria:
Heikin Ashi candles: add or subtract half an assigned weight if there is a buy or sell candle and the other half weight if there are two consecutive candles with the same signal.
RSI: Adds or subtracts the assigned weight if the ema is below or above the signal.
Parabolic Sar: Adds half a weight in transition to buy or sell and another half weight if there are two consecutive signals of the same trend.
Koncord: Add or subtract the weight if the current trend (mountain) grows or decreases respectively from the 4th previous time signal, and also the value (red line) is less than 35 or exceeds 65 respectively.
DMI: Adds or subtracts a quarter of the weight assigned by the DMI signal multiplied by the value of DMI, if the positive or negative signal exceeds the other negative or positive signal by 15% respectively.
Bollinger Bands: Add or subtract the weight if the previous third signal touches or falls out of the zone and keeps growing or decreasing respectively.
MACd: Add or subtract one third of the weight if the last 3 time signals are rising or falling, Add or subtract another third if the fast signal is above or below the slow signal, and Add or subtract the last third of the weight if it is rising with the negative fast signal, or falling with the positive fast signal.

Strength Index I2-SIIdea:
Enhance the Stoch RSI with DMI to get the visualization of the strength movement.
Concept:
(Note that we take the close to get the closing price).
-Combination of 2 Stoch RSI (using value K): 1 is UP, 1 is DOWN (these settings have been customized).
-Every time they cross, it calculates the direction of 3 nearly previous crossings to get the color of the current line.
-The value has been re-calculated with the processed value from ADX and DI- (That's why it can be more than 100 or -100 in some cases).
-RSI Overbuy and oversell are removed because the value could be beyond it.
How it works:
1. The line is show as the strength index of bars
- Green means the up strength is strong.
- Red means the down strength is strong.
- Gray means the previous strength is getting week.
2. This one can be used to find divergence.
3. This indicator provides a warning signal when the color of the line changes:
- Change color:
+Turn red: "Down Red"
+Turn green: "Up Green"
+Turn gray: "Down Gray"/"Up Gray"
Suitable time frames:
15m, 4h, 1D, 1W
* Please note that this logic does not attempt to predict future prices or 100% accurate signal.
(INVITE ONLY indicator. Please direct message or visit website if you want to try it out)
Hope you guys enjoy!
Examples:
BTCUSD 1D
XAUUSD 4H
EURUSD 1H
SPX 15m
