Ichimoku Kinkō hyō Keizen 改善
The script is not finnished yet and show's an other interpretation of how it could be scripted
Step -1 is complete... Basic Ichimoku with asjutable length and editable lines colors and visibilities.
Step -2 in progress... Adding ability to une multiple Spans, sens and Kumo on higher and lower timeframe.
Your Step : Like and Share ;) have a good year 2020 !
2020-01-06 /--------/ -R.V.
Kênh Donchian (DC)
Donchian Channels Alert SystemThis time I was using an script/indicator that was originally written by ChrisMoody on 12-14-2014, as turned it an Alert System to know whether the price breaks above or below the donchian channel of 20 periods.
I would like to show you how easy is to use it and configure it to receive this alerts in your phone.
Here's a page about what Donchian Channels are for the ones that don't know already: www.investopedia.com
This simple indicator prints a green alert when the close price crosses above the upper band of the DC, and a red alert when the price crosses the lower band of the DC.
When these conditions are met, the indicator throws an alertcondition signal. You can personalize your Trading View alerts using this information.
Create new alert, In the condition select "DC Alert System" and below select "Break Above" or "Break Below" depending on the case you're looking for. Save the Alert and voila.
Simply as that.
The Donchian Channel period is set to 20 by default, but you can update it to what suit best for you.
Hope this is a +1 to your trade alert system.
Have a good day!
If you like this script please give me a like and comment below.

X Period High/Low/MidToday we have a simple, but endlessly versatile, indicator that plots the X Period High/Low/Mid of your chosen market.
Traditionally the 52 week High/Low is used as a breakout signal. However, by changing to an X period, and adding a midway line, we create a more versatile indicator that can be tailored to various markets.
By default it's set at 250 periods (because I like the 250 period moving average), and I generally trade H4 and Daily time frames. But tweak it to your liking, you just have to modify the length periods by your desired time frame and lookback length. E.g. to create a 52 week indicator on the daily time frame, enter a length of 260 in the indicator (5 days per week * 52 weeks = 260).
For the above reason, I haven't made this indicator MTF, as there's no real need. However, if users find it easier I can look at adding it later.
Also, the mid point between an X period high/low is often a good trend-follower, as well as acting as support/resistance . I encourage you to experiment with different ways of using this indicator. Entire systems (if your risk management is correct) can be built and traded from this one indicator.
Good luck.
DD

Adaptive ChannelThis indicator uses KAMA to adjust the length of a channel according to volatility.
A set up is generated when a candle closes below/above the mid point line; this is indicated via the background color.
Buy/sell on the break of the high/low of the signal candle.
Use the channel top/bottom as a stop (or a close above/below the mid pint line)

Rumpy's Donchian Anchored VWAPUses donchian points to anchor VWAPs (start a new VWAP interval). The defaults are set up for a 1H chart, with lookback periods of 1 day, 2 days, 1 week, 2 weeks and 4 weeks for the anchor points.
Green : upper donchian AVWAPs, Red : lower donchian AVWAPS, thin/1day to thickest/4 week.
Option to test whether a new point should be formed from a high or low exceeding the historical high/low over a lookback length or using a closes that exceed the historical high/low.
--------------------------------------
If you find it useful please consider a tip/donation :
BTC - 3BMEXEDyWJ58eXUEALYPadbn1wwWKmf6sA

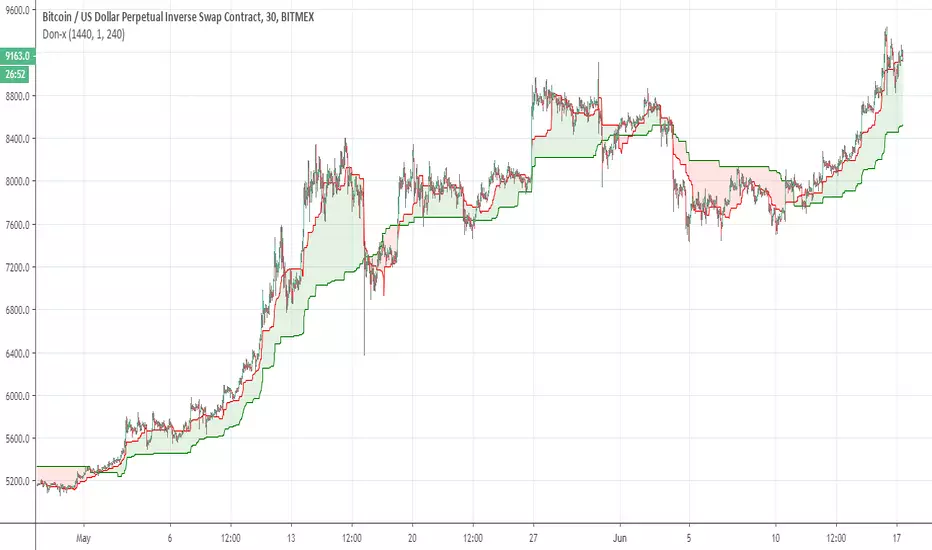
Don-xSimple indicator that nased on two donochian bases each calculated slight different with MTF , where we based a faster of 240 min over slower of daily one on each other and we put on lower time frame (30 min, 1 hour or 2 hour )
hence we can see the bullish trend (green ) or bearish trend (green ) more easy
can be used as by its own (slight lag ) or with other indicators to see where the asset direction is
Volume Weighted Donchian ChannelsDonchian channels weighted with volume, they are now closer to the price and can cross it.

Donchian resistance and sup MTFThis model has Donchian channel support and resistance levels
if you want to buy and sell according to it then you need to activate the HIGH (resistance =sell) , LOW= support =buy
as you can make signal once they occur
It has MTF so you can see it in different time frame on your graph

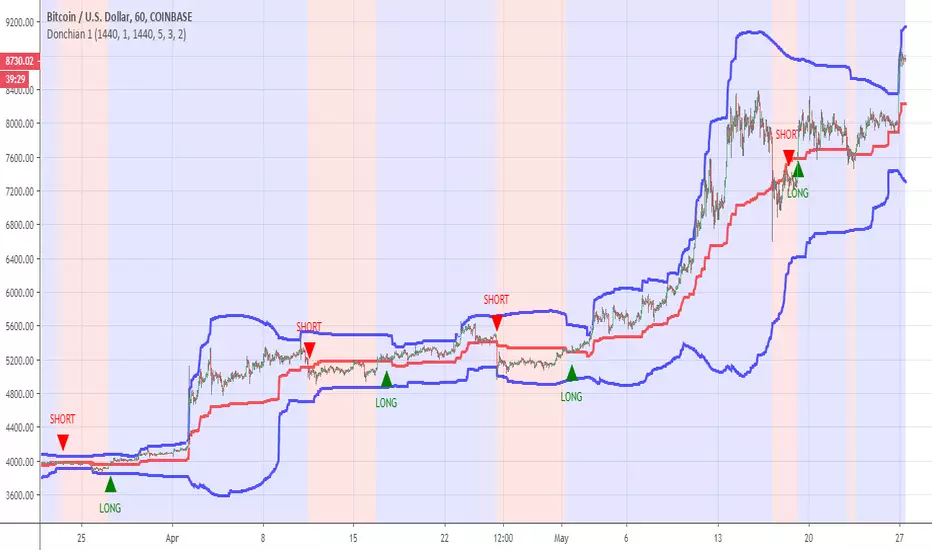
Donchian 1Based on the donchian bollinger that made before , then we can build signal by the channel
with alerts , take profit and stop loss
Donchian as bollingerThis indicator give as a donchian channel as bollinger
when the coin bellow the median the asset is bearish zone and opposite when its above the median
you can change the time frame=now on 1440 min
and the standart deviation of the donchian as you wish
so this model try to make the donchian channel to be more flexible like bollinger to some extent

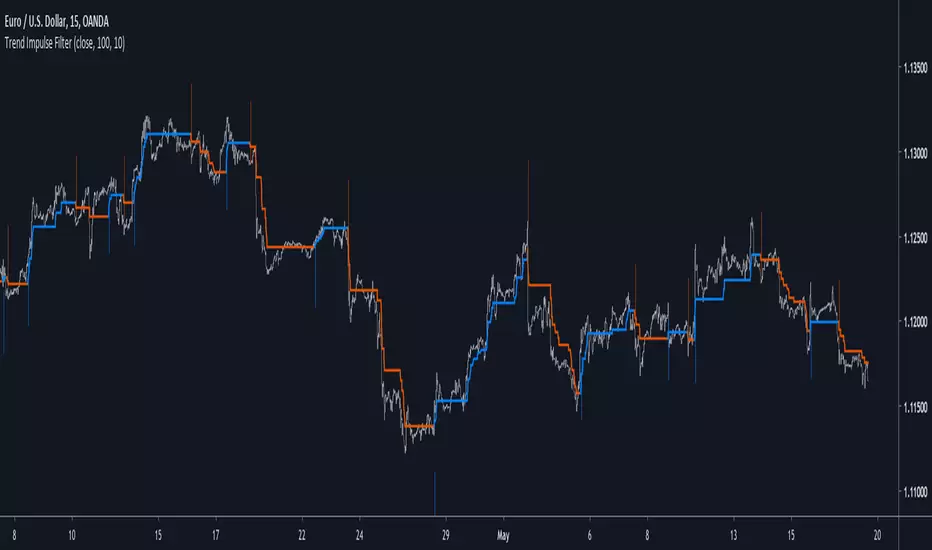
Trend Impulse FilterIntroduction
There is a lot of indicators similar to this one, however i think this one don't share the same calculation method and this is why i share it. This indicator aim to forecast price direction using an exponential filter architecture using highest and lowest information for the estimation of a smoothing variable. This filter is similar to the average Max-Min filter.
The Indicator
In the code a is equal to 1 when the price is greater or lower than any past price over length period, else a is equal to 0. The center parameter control the filtering degree of the output, when center is equal to 1 and a = 1 the indicator return the highest or lowest depending on market current trend, when center is superior to 1 the output will be smoother, however the reactivity of the indicator will still depend on the length parameter.
A color option show you the trend of the market, however the generated signals are the same that can be generated from a Donchian channel.
When highest is greater than previous highest the indicator direction will move upward, else if lowest is lower than previous lowest the indicator direction will move downward. Therefore the indicator can give information on the Donchian channels direction and provide a nice filter.
Conclusions
Adapting to highest and lowest can make an indicator adapt to the essence of trend trading, the indicator i showed can be used as source for others indicator or in MA crossover strategies. If you have a strategy using Donchian channels you may be interested in using this indicator and se how it fit in your strategy. Hope you like it.
Thanks for reading !

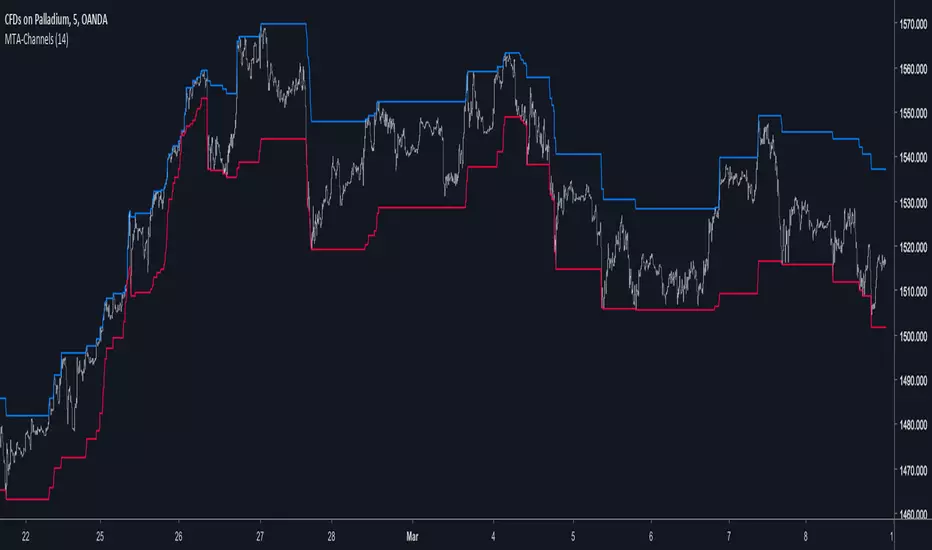
Motion To Attraction ChannelsIntroduction
Channels are used a lot on technical-analysis, however most of the them rely on adding/subtracting a volatility indicator to a central tendency indicator, sometimes the central tendency indicator can even be replaced by pure price. A great channel who does not rely on this kind of architecture is the Donchian channels or the quartiles bands. Here i propose a channel similar to the one made by Richard Donchian with some additional abilities.
The Channels
In my indicator, Motion To Attraction mean that the movement of an object a attract an object b , but we can resume this approach by saying that the longer a trend period is, the smaller the distance between each channels, for example if the price create a new highest then the lowest will move toward this new highest, each time coming closer. The philosophy behind this is that the longer a trend is the more probable it is that she will end.
The code reflect it this way :
here the parameter controlling the channel A (upper)
c = change(b) ? nz(c ) + alpha : change(a) ? 0 : nz(c )
this is traduced by : if channel b move then the parameter c become greater, if channel a move then reset the parameter , the parameter d do the same.
c is used to move the channel A, when c < 1 A is closer to the highest, when c = 1 A is in a central tendency point, when c > 1 A is closer to the lowest.
Slaving the Movement
It is possible to have a better control over the channels, this is done by making c and d always equal or lower than 1. Of course it could be another max value selected by the user.
In order to do that add c1 and d1 as parameter with c1 = c > 1 ? 1 : c , same with d1 but replace c by d.
Its safer to do this but i prefer how the channels act the other way, i will consider implementing this option in the future.
Conclusion
This channel indicator does not rely on past data thanks to recursion. The alpha variable at the start can also be adaptive, this let you make the channels adaptive even if such idea can add non desired results. Low length values can create effects where the lower channel can be greater than the higher one, this can be fixed directly in the code or using the method highlighted in the Slaving the Movement part.
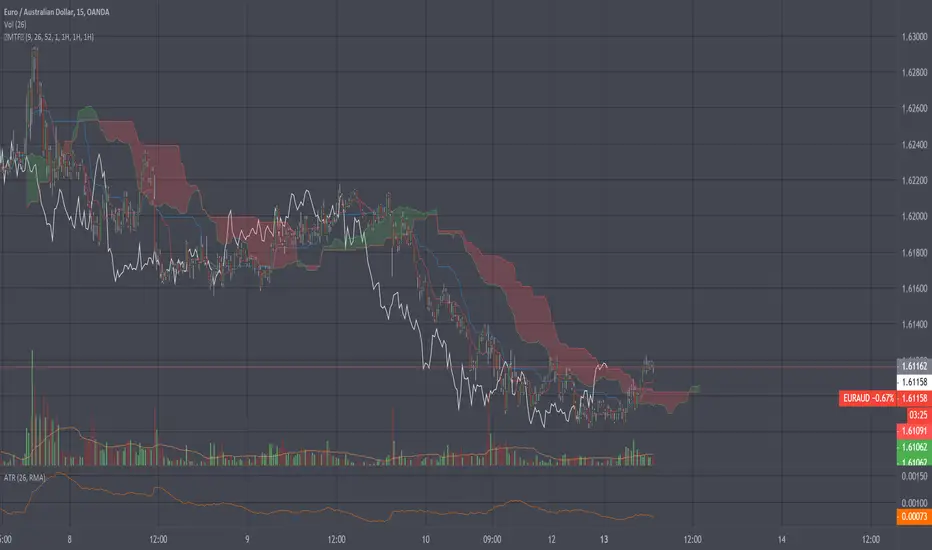
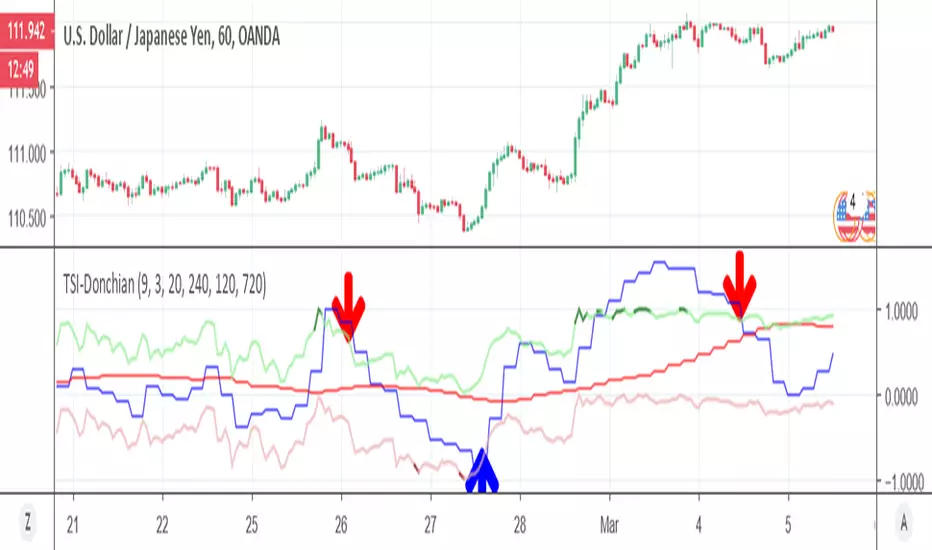
TSI-DonchianHere it a TSI with MTF function , together with Donchian high and low channel
the best entry and exit are shown in arrow
Donchian ATR ChannelThis uses a Donchian center line and adds an ATR multiple to generate a channel.

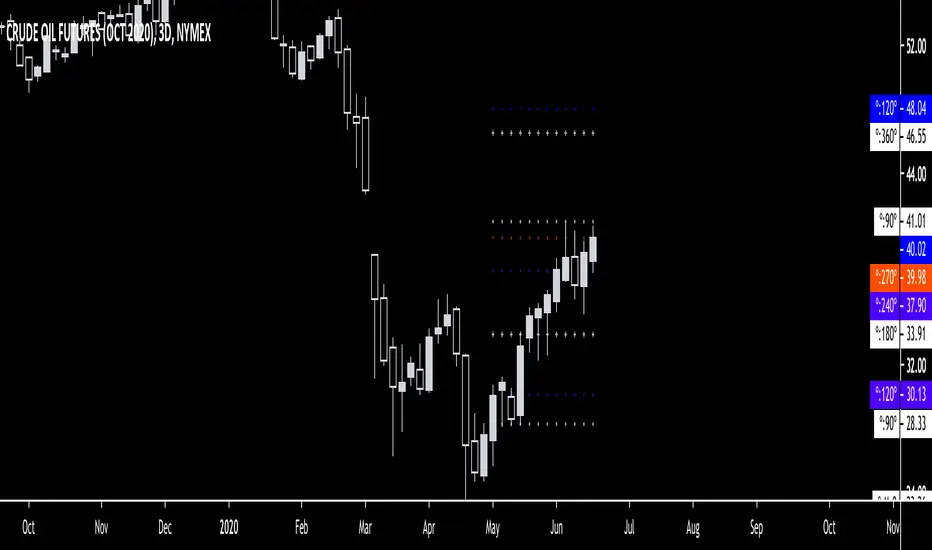
Gann Square Of 9 LevelsThis script uses the last hlc3 value of 1H, 4H, D and/or W and rotates it 360º up/down with four increments of 90º to find out potential support and resistance areas. Can be used as a dynamic support & resistance tool or just to gauge how overbought/oversold the market is. Special thanks to @Nv56 for his assistance in writing this script.
EASY SYSTEMSo how to use this very easy system
we have two system the first is based on ATR resistance and support and the other based on % channel based on donchian channel
The black line is the price line
The red lines are % line of the donchian channel (here it set to 2 and 3 % (you can set it any number you want ) this lines are the low end
Theblue d lines are % line of the donchian channel (here it set to 2 and 3 % (you can set it any number you want ),this lines are upper end
you look at the resistance and the support of the ATR and on the % channel
lets say you decide to go long -best if it in lower end of your % channel you can either set alert if price crossup the lower % line that you set
and you can make take profit if it reach the target level by % of the line of your choice
oposite you do in shorting
using the build in alert in TV you can make your trade more easy setting the target in more logical way

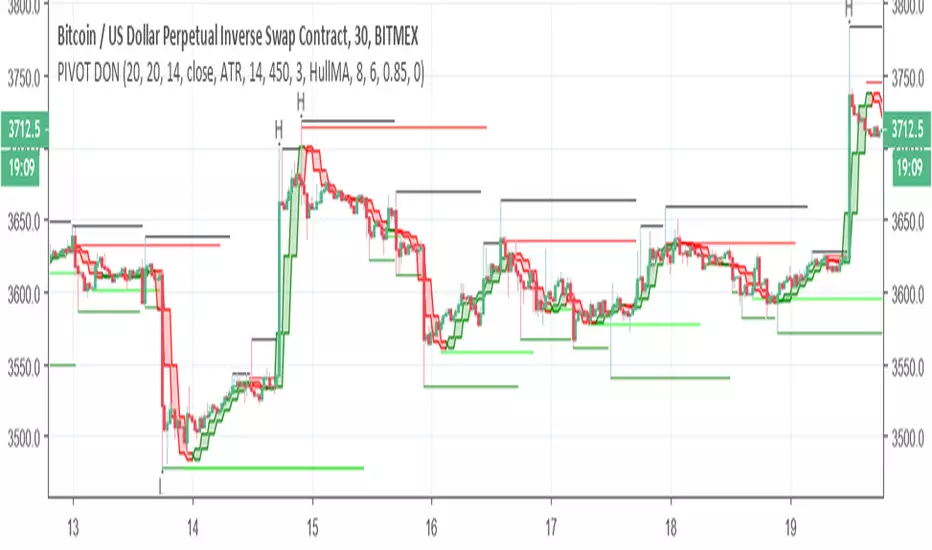
PIVOT DONThis indicator is great to detect resistance and support
The H and L are based on new high and low formed by Donchian cahnnel , the lines of support and resistance are based on pivot system
by the TF you can control the time length of the donchian channel
no alert to this system
Don ratioUsing the ratio of donchian channel from early script we can calculate factor Z which is the estimate of the high ratio and the low ratio
crossing it with +100 and -100 we can produce the signals with addition on non repaint donchian ratio channel
inside the script one can take profit for both long and short , buy again and sell again with stop loss if needed
by the same logic we can calculate factor to z to any channel we want once we create the correct ratio to it

Donochian CCISo this indicator have the following:
1. MTF CCI
2. donochian channel MTF both non repaint mode
buliish and bearish zone determine by ratio of the the donochian cahnnel
enter or exit can be either the bullish or bearish change of color or by cross over or under of the CCI
or combination of both
The high max and low max of the donochian channel show in hilated bar

Donochian zonesThis indicator give the ratio between the high and low of donochian channel and if we take ratio and add it to each other then we can calculate if it + meaning bullish trend or negative meaning bearish trend
using non repainting MTF we can see the zone of the channel at different time set
we can use this indicator to filter bad signal or make it stand alone
here example of amazon stock with 360 min mtf over one hour graph
here facebook 240min over 15 min graph

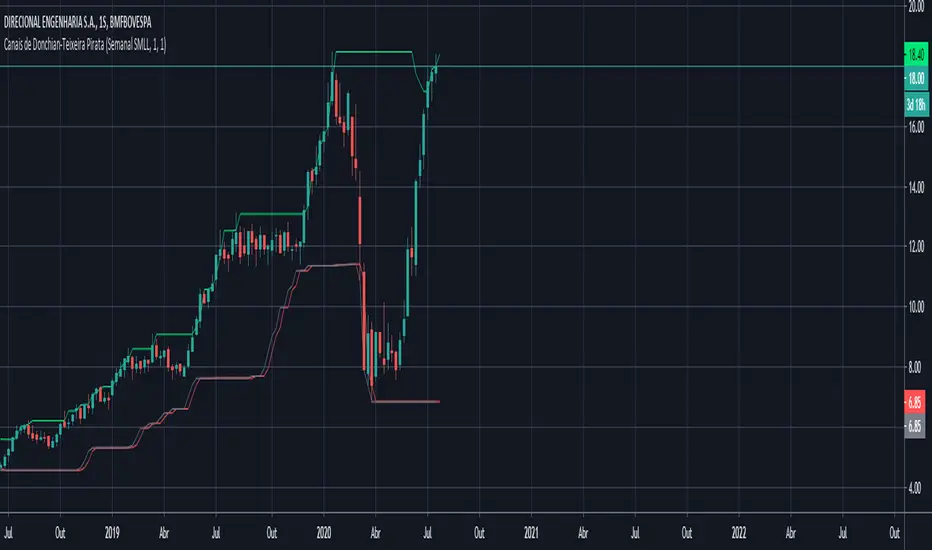
Trend Follower With Help of Donchian Channels - TFWHDCThis is a simple Day Trade indicator, but can be used for swing and long term trades.
It is based on Donchian Channels to detect trend and point out resistance or support breakouts using arrows.
The bars ared colored when a breakout occurs. When a resistance breakout occurs the current and the next bars are colored green (default) and when a support breakout occurs the current and the next bars are colored red (default). This way this indicator can show if its an uptrend or a downtrend.
I hope this indicator will be useful for many traders!
Thank you!
